
 ?Mathematical formulae have been encoded as MathML and are displayed in this HTML version using MathJax in order to improve their display. Uncheck the box to turn MathJax off. This feature requires Javascript. Click on a formula to zoom.
Abstract
Purpose: Preclinical studies and clinical observations suggest that amplitude modulation (AM) below 100 kHz may enhance the intratumoral power absorption of radiofrequency hyperthermia at 13.56 MHz; however, it remains unclear whether AM induces temperature-dependent effects.
Methods: We established tumor models assuming typical tumor architectures or cell suspensions to analyze the effects of additional power dissipation. The preconditions for demodulation at cell membranes in situ were outlined. The bioheat transfer equation was solved analytically for the selected models and the possibility of circumscribed temperature increases (point heating) with dependency on the specific absorption rate (SAR) peaks was estimated for centimeter down to nanometer scales.
Results: Very-low-frequency (VLF) AM radiofrequency can increase the SAR in the extracellular space or necrosis of tumors as compared to radiofrequencies alone. Such modulation-derived SAR peaks can induce higher temperatures (hot spots) in tumors with necrotic areas of millimeter to centimeter size. However, for lesions <1 cm, excessive (unrealistic) SAR > 1000, 10,000 and 1014 W/kg for diameters of ∼5 mm, ∼1 mm and ∼10 nm (nanoheating), respectively, would be required to explain the cell kill observed in pre-clinical and clinical data, even with VLF modulation.
Conclusion: Our analysis suggests that VLF AM of radiofrequency hyperthermia for a theoretical tumor model cannot induce relevant temperature-dependent effects, as the associated temperature increases caused by the resultant SAR peaks are too small. Further investigation of possible non-temperature-dependent effects is recommended.
Introduction
Radiofrequency (RF) hyperthermia using annular phased array (APA) techniques (70–140 MHz), capacitive systems (8–13.5 MHz) or local applicators (200–1000 MHz) has been validated for various tumor entities [Citation1–5]. The basic physics, thermal dose concepts and associated planning are well understood [Citation6–8]. Typically, only a specific absorption rate (SAR) of 10–20 W/kg is achieved in difficult-to-heat tumors; this can approach 60–100 W/kg under favorable conditions (i.e., for easy-to-heat tumors) [Citation6]. The steady-state temperature increase θ [°C] in extended tumors is also influenced by the tumor perfusion w [ml/100 g/min] and can be estimated using a simple equation involving the SAR: θ = 1.5 × SAR/w. Therefore, the final intratumoral temperature is widely predetermined by anatomical and physiological determinants. In clinical practice, the most significant parameter as regards increased RF heating effectiveness is increasing the total power to the upper limit tolerated by the patient. Therefore, based on successful clinical trials (e.g., for cervical cancer), we can assume a typical total power >600 W for APA systems [Citation6,Citation9] and an even higher total power >800 W for capacitive techniques [Citation10,Citation11].
Recent clinical data [Citation12] suggest that RF heating at 13.56 MHz in conjunction with amplitude modulation (AM) at very low frequencies VLF of the order of hertz to 10 kHz (called ‘modulated electro hyperthermia [mEHT]’) is effective, and permits use of much lower power levels [Citation6,Citation9–11]. A randomized trial [Citation12] targeting locally advanced cervical cancer (standard radiochemotherapy with or without mEHT) revealed superiority of the experimental arm with respect to response/local control, with a total power of only 130 W. Further, the temperatures in the tumor were conceivably below those reported in [Citation6,Citation9–11]. Therefore, we hypothesize that additional non-temperature-dependent effects affected the results.
Moreover, in another recent study, mEHT with 40–150 W was applied as mono-therapy (without radiotherapy or chemotherapy) to target recurrent glioblastoma/astrocytoma III after standard treatment [Citation13]. The researchers found objective remissions with volume reduction (i.e., complete/partial remissions) in one third of 50 patients, which is a surprisingly high response rate.
An additional effect of VLF-modulation is also evidenced by preclinical studies on cell suspensions and experimental tumors. In those works, the researchers compared water bath hyperthermia [Citation14–17] and RF hyperthermia [Citation18] with a modulated capacitive heating technique (i.e., mEHT) using a carrier frequency ν of 13.56 MHz. Various experiments indicated stronger effects when mEHT was applied compared with water bath/infrared heating with the same temperature adjustments (typically 38 °C or 42 °C). Notably, Yang et al. [Citation18] estimated a temperature difference of approximately 4 °C with comparable apoptotic cell rates for water bath heating and mEHT heating, which were performed at 46 and 42 °C, respectively.
Therefore, additional cell kill mechanisms may exist beyond the homogeneous temperature elevation (via water bath heating or infrared heating) achieved via VLF-modulation. Researchers often explain such data by assuming the occurrence of undetected temperature peaks (hot spots) during mEHT application. In such cases, the higher temperatures could primarily be due to the associated heterogeneous temperature distributions, which are inadequately sampled by conventional thermometry techniques.
This study explores the effects of mEHT application with regard to potential SAR peaks, which may cause hot spots. A theoretical approach is adopted, with the fundamental bioheat transfer equation (BHTE) being analytically solved for suitable models.
Methods
Model description
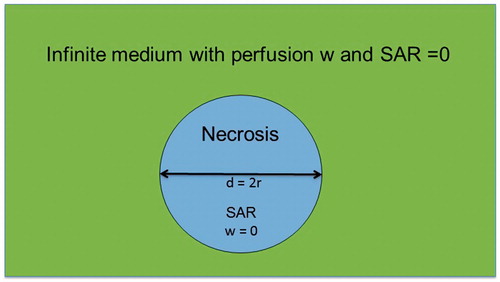
We adopted various tumor models based on typical tumor architectures or cell suspensions to analyze the effect of additional power dissipation. shows a single necrotic sphere of diameter d containing extracellular fluid (ECF) illuminated by constant SAR in an infinite medium with perfusion w and 0 SAR. Based on this model, we studied the temperature effects of high SAR peaks of extension d. The major advantage of this model is the existence of an analytical solution for the temperature distribution, which enables assessment down to microscopic dimensions (e.g., 10–100 µm).
Figure 1. Simplified model of necrosis as sphere of diameter d with constant specific absorption rate (SAR) inside and perfusion w = 0. The sphere is embedded in an infinite medium with 0 SAR and arbitrary w.
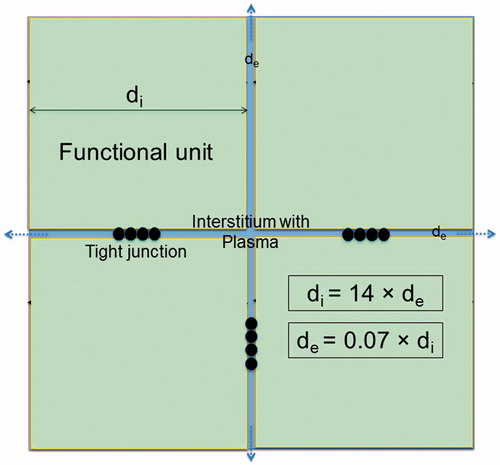
shows a simplified three-dimensional model applicable to cell suspensions and some tumors (with typical microenvironments), consisting of cubical cell clusters of extension di (where index ‘i’ indicates ‘intracellular’). These suspensions or tumor cell clusters are located in an extracellular medium with distance de (index ‘e’ indicates ‘extracellular’) between the cell clusters in all spatial directions x, y, z. The parameters di/e may be selected to represent a variety of tumor architectures, from predominantly hydrated/necrotic (de ≫ di) to solid (de ≪ di) tumors. Clearly, the parameters di/e can vary with position and indicate a local property of the tumor. The intra-/extracellular spaces Vintra/Vextra can be estimated from the relations
(1)
(1)
where N = [L/(di + de)]3 indicates the number of cells or cell clusters in the tumor and L is the tumor size (). The typical tumor microenvironment is characterized by high proportions of ECF and/or necrosis, which correlates with the common increased T2-intensity in magnetic resonance imaging of tumors. In the literature, we find typical data of >80% water content, i.e., <20% intracellular macromolecule content [Citation19]. This yields >60% ECF, as illustrated by . Note that a relationship of di = 2 × de yields 70% extracellular space according to EquationEquation (1)
(1)
(1) ; this space is typically composed of 65% ECF and 5% plasma (in the vascular system) [Citation20].
Figure 2. Simplified tumor model with cubical tumor cells or cell clusters of extension di (‘i’ for intracellular) in extracellular medium ‘e’ of width de. Assuming a tumor cube of edge length L [cm], we can determine the number N3 of tumor cell clusters from di and de. The tumor is more solid and more hydrated for di > de and di < de, respectively. The cell membrane has ∼5-nm thickness. The cell cluster arrangement is continued in all directions. The figure illustrates a di = 2 × de relationship yielding 70% extracellular fluid (ECF, see text). This is a three-dimensional model with the coordinate origin and x/y axes plotted for analytical solution (EquationEquations 7–9).
![Figure 2. Simplified tumor model with cubical tumor cells or cell clusters of extension di (‘i’ for intracellular) in extracellular medium ‘e’ of width de. Assuming a tumor cube of edge length L [cm], we can determine the number N3 of tumor cell clusters from di and de. The tumor is more solid and more hydrated for di > de and di < de, respectively. The cell membrane has ∼5-nm thickness. The cell cluster arrangement is continued in all directions. The figure illustrates a di = 2 × de relationship yielding 70% extracellular fluid (ECF, see text). This is a three-dimensional model with the coordinate origin and x/y axes plotted for analytical solution (EquationEquations 7–9).](/cms/asset/d65334dc-5619-4060-a5ad-ab3109f67e84/ihyt_a_1692376_f0002_c.jpg)
Conversely, in normal tissue, the total water content is 60% (intra-, extracellular, plasma) and, consequently, the macromolecule content is 40% [Citation20]. This yields an extracellular space of 20%, as illustrated true-to-scale in . That figure shows the typical structure of normal tissue (e.g., muscle or organ) containing functional units of parenchymal cells arranged by connective tissue strands. An extracellular space proportion of 20% is achieved for di ≈ 14 × de, according to EquationEquation (1)(1)
(1) . The cell-membrane interacting area in normal tissue is further diminished by the cell interconnections (as represented by the tight junctions in ).
Figure 3. Simplified model of normal tissue such as muscle or liver. The extracellular space has a share of 20%, yielding this scale drawing (see text). Therefore, the functional units are considerably larger than the tumor cell cluster of and de ≪ di. Because of the narrow interstitium of only a few micrometer, the membrane accessibility as regards electrical processes may be reduced. The membrane area is further decreased by the interconnections between the normal tissue cells (e.g., tight junctions), as sketched between the functional units.
Electrical constants
summarizes the electrical properties of the intracellular and extracellular spaces used in the model of , which are assumed as constant from direct current (DC) until 100 MHz [Citation21,Citation22]. The extracellular space is an electrolytic fluid similar to a 0.9%-NaCl solution with frequency-independent high electrical conductivity σe = 1.2 S/m. The lower electrical conductivity σi = 0.3 S/m of the cytoplasm is due to water bounded by proteins and may vary according to cell type [Citation19]. For a cell membrane (index ‘m’) of 5–10 nm thickness, low dielectric values and extremely low electrical conductivities σm have been reported for frequencies <1 MHz with increasing σm above 1 MHz [Citation22].
Table 1. Compilation of physical constants and formulas used in main text [Citation6,Citation21–22]. For our purposes, the frequency range can be restricted to <100 MHz. The relaxation times depending on the spot size are given below (see Discussion).
For biological tissue, the relative permittivity is known to be strongly dispersed (α- and β-dispersion in the kilohertz range and at some 100 kHz, respectively) as extensively studied in the past [Citation19,Citation23–25]; this is not reflected in , for the following reasons. First, these dispersions were found in normal tissue with much higher macromolecule and membrane concentrations than in tumors. Second, the relative permittivity is relatively unimportant for our low-frequency (<100 kHz) considerations, which are dominated by σ [Citation19].
The electrical behavior at VLF is determined by the conductivity σe (), because the cell membrane acts as an isolator. Therefore, the different architectures found in tumors () compared with normal tissue () yield higher σ at audio frequencies. However, these notable differences may not be valid for every tumor and depend on the specific microscopic structure. Above 1 MHz, the membranes become increasingly transparent/conducting and the intracellular SAR SARi [W/kg] approaches 25% of the extracellular SAR SARe (derived from the σi/σe ratio given above). Therefore, in tumors, mean values σTM (where index ‘TM’ indicates ‘tumor’) of 0.6–0.8 S/m between σi and σe are reasonable assumptions for RF hyperthermia planning systems (10–500 MHz) [Citation26,Citation27].
The power per mass for alternating current (AC) electrical fields E is given by the relation SAR [W/kg] = (σ/2ρ)E2, with the assumed simplification that the density ρ = 1 kg/l for all tissue. The typical mean SAR values achieved in tumors using clinical hyperthermia systems, either APAs or capacitive techniques, are 10–60 W/kg [Citation6]; the corresponding E fields have amplitudes of 100–300 V/m ().
For ν ≥ 1 MHz, dielectric power dissipation is dominant; i.e., the rotational or vibrational energies of atoms and ions generated via interaction with E(ν). The SAR is split into different SARi/e.
For ν ≤ 1 MHz, however, conductive power dissipation becomes dominant. We assume that the cytoplasm region is surrounded by practically perfectly insulating cell membranes. Therefore, almost no current enters the cytoplasm and SARi becomes negligible. Thus, the power is deposited via ion currents in the widely connected extracellular space that characterizes many tumors.
Demodulation
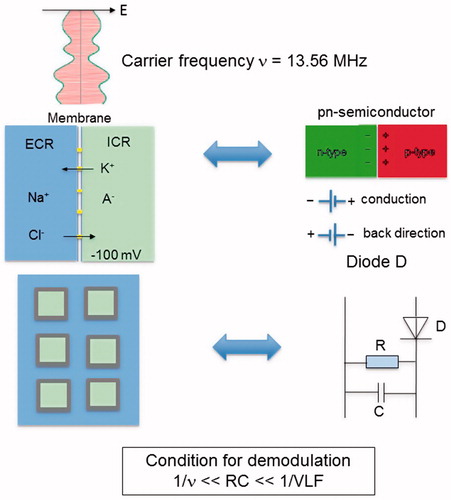
VLF-related conductive power dissipation may be possible in tumors through application of VLF-AM for a VLF of some kHz and an RF ν of 13.56 MHz [Citation28]. To cause VLF-currents in the tumor, this particular tumor tissue must act as a demodulator. In terms of an equivalent circuit, the tumor cell membranes operate like barrier-layer rectifiers (diodes) and form a capacitance C (∼µF/cm2), while the ECF and specific channels act as resistors (R ∼100 Ω × [cm2]), as illustrated in . That diagram shows the basic circuitry of the earliest receiver known as the ‘crystal radio receiver’ (see Wikipedia). Demodulation is realized by rectification (where the cell membrane is analogous to a diode) in conjunction with smoothing (via C and R). The time constant RC must be between the cycle times of the carrier (1/ν) and the modulation frequency (1/VLF) for a proper (distortion-free) demodulation [Citation29]. We expect considerably a greater demodulation in the tumor, which is composed of widely connected and abundant ECF adjoining rectifying membranes. Because the other (preferably normal) tissue has no strong ability to demodulate, the AM carrier signal passes through without generation of VLF-currents. Thus, when both ν and VLF are appropriately selected, VLF-conduction may only occur in a limited volume of the exposed body region. This is particularly valid for tumors having suitable microenvironments.
Figure 4. Equivalent circuit diagram of tumor, acting as demodulator of AM RF frequency at 13.56 MHz. The membranes (top left) are comparable to a rectifier diode (top right), because they have high permeability/conductivity for K+ and Cl− ions (forward direction) and are much less permeable for Na+ and A− (backward direction). The resistance R and capacitance C of the membranes or cell formations of the tumor determine the demodulation condition (see text). The electrical parameters can be derived utilizing the parameters of . The power absorption of the tumor may be increased by adjusting the carrier frequency v or the modulation frequency spectrum to the specific tumor (bottom left) and its electrical attributes (bottom right).
In the case of a basic double-sideband (DSB) AM scheme (DSB-AM), ν is fully modulated by VLF frequencies with a modulation index m = 1. Then, the total power of the sidebands is equal to half the carrier power [Citation29]. The power relationship between the carrier and sidebands can be modified in favor of the latter, e.g., by using a DSB reduced carrier (DSB-RC) transmission. Therefore, the sideband power can range from half the total RF power P(ν) for DSB-AM with m = 1 to a multiple of P(ν) for DSB-RC, and will increase the VFL-related power transfer in the tumor ECF. This may yield enhanced generation and absorption of VLF-currents. In consequence, the local SAR in the tumor ECF generated by VLF-demodulation and conduction, SARTM(VLF), can be higher than the (mean) SAR in the tumor generated by the carrier frequency SARTM(ν) alone. We describe this effect by the following equation:
(2)
(2)
In our calculations, we take K = 1–100 as an assumed power range in order to estimate the effect due to enhanced VLF-current conduction in tumors. A special modulating frequency that maximizes K may exist in the VLF-range, depending on the individual tumor architecture. Matching of the modulated power through proper selection of the modulating frequency spectrum is a possible strategy for increasing/maximizing K, which is in principle unknown for every new case [Citation28].
Note that an increase of SARTM(VLF) up to 100 W/kg in the ECF of a 100-ml tumor (∼6 cm extension) requires a total power of only 10 W, which is a small portion of the total power from the amplifier. Furthermore, assumption of K > 10 (or even K > 2) in EquationEquation (2)(2)
(2) is probably unrealistic. However, such a hypothesis is tested to clarify whether temperature-dependent effects can occur as a consequence of exceedingly high SAR in a circumscribed necrosis with diameter d () or in a tumor ECF of width de ().
BHTE formulation
On a microscopic level, the SAR distribution is heterogeneous and follows the rules outlined in the previous section. However, determination of the corresponding temperature increase θ is much less straightforward, because of the rapid heat redistribution that occurs at microscopic dimensions of size d = 1–10 nm according to the thermal equilibration relaxation time τ = d2c/κ, listed in using the constants c, κ in .
The value of θ in the steady state is approximated by the well-known BHTE [Citation30] with source term SAR and an omnidirectional w [ml/100 g/min]:
(3)
(3)
using the constants κ, ρ(water), ρb(blood), c(water), cb(blood) described in .
Results
The power deposition patterns (SAR) in Watts per kilogram can be estimated on a microscopic level for nanotherapy or various electromagnetic techniques. In the case of mEHT, we employ simple three-dimensional models and assume arbitrarily high SAR in the ECF, which is deposited by currents at low frequencies ( and ). Then, the temperature distribution can be evaluated utilizing numerical methods; however, this is a difficult task in the case of microscopic dimensions (down to nanometer scale). Therefore, in this study, we adopted an alternative approach and searched for analytical solutions, which are not restricted by physical dimensions, memory space, computing speed or numerical inaccuracies. We investigated whether undetected small, or even microscopic, hot spots (exposed to temperature increases >5–6 °C) can explain the data reported in Refs. [Citation12–18].
In the following, we report deduction of the analytical solutions of the BHTE (EquationEquation 3(3)
(3) ) for the models shown in and . The inserted physical constants are listed in .
Analytical solution for model
We formulated the BHTE in spherical coordinates:
(4a)
(4a)
(4b)
(4b)
After straightforward calculation with θin(½d) = θ0 and θin(0) = θmax, we achieved (assigning the parameters of and taking r in centimeter):
(5a)
(5a)
(5b)
(5b)
where θout, θin, θ0 and θmax are the temperature elevations outside, inside, at the edge and at the center of the sphere, respectively. Note that θmax is also the maximum temperature increase. Hence, the temperature elevation θ(r) exhibits an inverted parabola inside the sphere and an exponential decline outside.
Finally, employing the following boundary conditions at the edge ½d of the sphere:
we obtained formulas allowing estimation of the temperature elevations θ0 and θmax [°C] for the sphere depending on d [cm], SAR [W/kg] and w [ml/100 g/min]:
(6a)
(6a)
(6b)
(6b)
and for
(6c)
(6c)
Note that the induced temperature elevation increases (only) linearly with SAR, but has a fast quadratic decay with declining d.
Analytical solution for model
We formulated the BHTE in Cartesian coordinates of x, y and z:
(7)
(7)
The general solution is
(8)
(8)
By substituting (8) into (7), we obtained A = –(ρ/6 κ) × SAR and, for reasons of symmetry, B = 0 (θ(–x, 0, 0) = θ(+x, 0, 0)). Defining the coordinate origin in the center of the extracellular space ‘e’ according to , we assumed for every direction x, y, z the same θ(x, y, z) behavior. In the center of the aqueous space the temperature increase is maximal, θe(0,0,0) = θmax. By considering ½de in every direction x, y, z to the furthermost point at the cell membrane, we found the minimum temperature increase θmin, i.e., θmin = θe(½de, ½de, ½de). Then, assuming SARi = 0, we obtained for the temperature difference Δθ [°C] ():
(9)
(9)
where SAR is in Watts per kilogram; de is in centimeter, κ = 0.006 W/cm/°C and ρ = 0.001 kg/cm3 (). Note that the predicted (additional) temperature increases θmax or Δθ, respectively, are equal for both models (/EquationEquation 9
(9)
(9) versus /EquationEquation 6c
(6c)
(6c) ).
We assumed a mean SAR(ν) at the tumor within the range of 10 to 60 W/kg (from difficult to easy to heat, respectively). EquationEquation (2)(2)
(2) predefines the additional power provided by the VLF-AM to the tumor stroma, either a necrosis with diameter d or tumor ECF of width de.
Equations (5) and (6) were used to evaluate the likelihood of ‘point heating’, i.e., the creation of circumscribed temperature elevations (hot spots) by high SAR peaks of limited size. Advantageously, for arbitrary values of SAR and d (i.e., for a heated sphere of diameter d), θ could be calculated and the actual temperature estimated by adding a systemic temperature of 37.5 °C. We quickly recognized that effective heating in small volumes of microscopic dimensions < millimeter scale is virtually impossible, if realistic SAR are assumed.
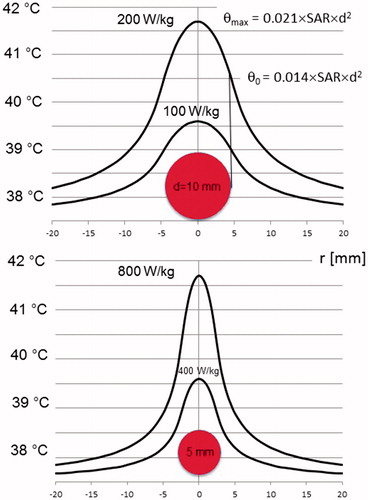
(top) illustrates that, in a sphere of 1-cm diameter, SAR = 200 W/kg is required for temperatures >41.5 °C. Further, if SAR = 100 W/kg is achieved (still challenging), the temperature elevation is only 39.6 °C. If we assume the occurrence of SAR peaks in volumes of 5 mm (, bottom), excessive SAR = 800 W/kg is required in order to achieve a temperature >41.5 °C. Even SAR = 400 W/kg yields unsatisfactory temperatures of 39.6 °C. In summary, either unrealistically high SAR (> hundreds of Watts per kilogram) and/or large heated volumes (> centimeter scale) are necessary to achieve effective temperatures. In addition, according to the curves of , the temperature increase scales larger than the diameter of the absorbing area to the surroundings. Consequently, a temperature elevation on a macroscopic level is expected. Therefore, hot spots at microscopic dimensions of < millimeter scale with no macroscopic temperature elevation are very unlikely according to our physical analysis.
Figure 5. Temperature distributions for SAR peaks in spheres of 5-mm (bottom) or 10-mm (top) diameter, illustrating the possibility of ‘point heating’. For lesions of ≤1 cm, extremely large SAR of hundreds of Watts per kilogram are required to obtain a relevant temperature >41 °C (still far from cytotoxic temperatures). On the other hand, temperature elevations of centimeter range around the lesion are measurable. Therefore, ‘point heating’ in the absence of bulk heating is physically impossible. The formula for the maximum temperature increase θmax in the lesion center () or the ECF () is given together with the temperature increase θ0 at the edge. The temperature at the ordinate is given by 37.5 °C+θ (using EquationEquations 5a(5a)
(5a) and Equation5b
(5b)
(5b) ).
Applying EquationEquations (6c)(6c)
(6c) and Equation(9)
(9)
(9) , we calculated θmax for the two tumor models. Interestingly, the same formula was used and the (local) SAR values (for either heating of the sphere with diameter d or the ECF of width de) were inserted. To be more specific, we defined the ‘critical lesion diameters’ dc as the minimum d or de required to achieve an effective temperature of 43.5 °C or higher in the center, i.e., θmax ≥ 6 °C, for a given SAR (assuming a systemic temperature of 37.5 °C). The relationship between dc and SAR is given by the following simple formulas:
(10a)
(10a)
or
(10b)
(10b)
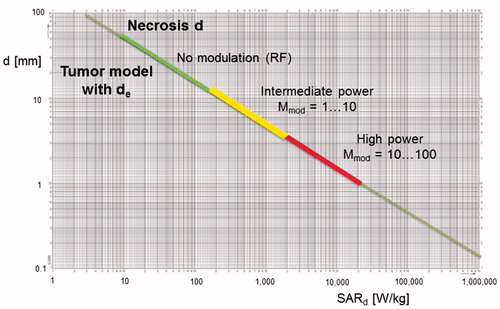
illustrates the dependency between dc (referring to the models of and ) and SAR. For difficult-to-heat tumors, we expect only 10 W/kg in the lesion. Hence, we need large necrotic areas (dc>5 cm) in order to obtain effective temperatures (>43 °C) using such low RF levels. For easy-to-heat tumors with very high SAR, the obtained dc approaches one centimeter. However, extremely local SAR peaks >1000 W/kg are required for tiny dc of a few millimeters. Such high SAR levels are unlikely to be achieved even if the SAR is increased by AM modulation. Finally, for submillimeter dimensions, e.g., 100 µm, excessive SAR peaks >106 W/kg are required to generate a significant hot spot. We can quickly deduce from EquationEquation (10b)(10b)
(10b) that, for targets (e.g., proteins) in a cell membrane of ∼10-nm size, SAR levels of >1014 W/kg are required in order to generate a temperature-dependent effect. This is clearly an unrealistic requirement.
Figure 6. Diameters d of spherical hot spots (θmax = 6 °C) versus required SAR peaks in sphere. Three colored ranges of hot spot development according to the degree of power enhancement K by VLF modulation are shown. For RF alone (K = 0), up to SAR = 100 W/kg, only necrotic/aqueous areas of centimeter size can be heated. For high power dissipation via VLF modulation (K = 100) above SAR = 10,000 W/kg, necrotic/aqueous areas down to millimeter d are effectively heated; however, necrotic/aqueous areas of microscopic dimensions (e.g., d of 100 µm) are still excluded. For areas of d ∼ 100 µm, excessive (unrealistic) values of SAR > 1,000,000 W/kg are required. This general diagram is also valid for microscopic d from micrometer down to nanometer scales (nanoheating range), requiring SAR values of up to a quadrillion (EquationEquation 10b(10b)
(10b) ).
Discussion
The AM-RF radiation technique is reported to employ RF for heating (here, 13.56 MHz) as well as VLF radiation (1 Hz to 10 kHz). The latter employs a completely different mechanism to dissipate energy via currents in a conductive medium and may enhance the SAR in aqueous tumors. This additional intratumoral power deposition SARTM (VLF) requires demodulation and is said to be locally restricted to malignant cells because of the specific microenvironment frequently found in tumors and the peritumoral area [Citation19]. For our theoretical analyses, we assumed a considerably higher power in the extracellular space according to a simplified tumor model (). Note that, to identify an appropriate VLF range for optimization of this selective effect, matching procedures may be useful [Citation28]. Further, for demodulation, we require a rectifying component; this is obviously accomplished by cell membranes in contact with the extracellular space. Notably, the effects of different frequency ranges have been applied for therapeutic ultrasound through modulation with a lower frequency [Citation31], even though that mechanism is completely different to the mechanism discussed here.
In the preclinical studies cited above [Citation14–18], a higher cell kill (determined by various surrogate parameters) was achieved with application of the mEHT technique in comparison with water bath heating or RF heating, through adjustment to achieve the same (mean) temperature in the specimens (i.e., cell suspensions, experimental tumors). These phenomena were overwhelmingly explained via the hypothesis that small (undetected) hot spots occur in the mEHT experiment. Some researchers have hypothesized that cell kill occurs on a millimeter scale, while the mean temperature in the reference point remains almost constant.
However, our physical analysis suggests that such temperature-dependent effects cannot fully explain the data. According to and , relevant temperature increases on a millimeter (or even sub-millimeter) scale are improbable, because unrealistic SAR delta peaks are required, e.g., SAR > 10,000 W/kg for a sphere of 1-mm diameter. Even for a sphere of 1 cm, already having macroscopic dimensions, the SAR is either very high (>200 W/kg) or the temperature increase is only a few degrees Celsius (∼2 °C for 100 W/kg); this increase is insufficient for cell damage. Furthermore, the temperature increase has a range of several d of the heated lesion in all directions () and, therefore, a measurable macroscopic temperature increase should also occur. According to , this conclusion is even valid for an aqueous tumor, if the SAR peak of diameter d is replaced by a much more extended network of width d. Thus, we find the same limitations. Note that presents the most optimistic tumor model with respect to microscopic heating effects. Heterogeneities and tumor stroma typically reduce the power deposition in the extracellular space and further limit the temperature-dependent effects.
In summary, we cannot exclude a slight circumscribed temperature increase of a few degrees Celsius. However, these slight inhomogeneities of the temperature distribution cannot explain the extremely large differences in cell kill. The discussion of ‘point heating’ is not new [Citation32], and is still implicitly proposed if temperature-dependent biological effects are postulated in the absence of bulk heating. A similar discussion has again arisen using the buzzword ‘nanoheating’, which has essentially the same meaning as ‘point heating’. Nanomedicine researchers have evaluated heating of a single cell or a microscopic cell cluster to a cytotoxic temperature through use of intracellular nanoparticles [Citation33,Citation34]. Realistic estimations of the expectable nanoparticle power absorption indicate that we are far from heating of a single cell, because the required intracellular SAR would exceed one million Watts per kilogram for a region of <100 µm, according to [Citation6]. For a region of 10 nm, which is most likely intended in the context of nanoheating, trillions of Watts per kilogram (>200 × 1012 W/kg) are required to achieve a corresponding temperature increase of 6 °C, according to EquationEquation (10b)(10b)
(10b) .
Next, the possibility of non-temperature-dependent effects can be considered. In the VLF range, ion movements at and through the membranes may cause chemical imbalances. If so, the local cell environment affects the extent and impact of any chemical stress. For example, electrochemical effects may occur more easily in the tumor microenvironment with its wide ECF network (). The discussion of non-thermal effects on viable cells in general [Citation35–37], and of VLF electromagnetic fields in particular, has a long history [Citation38–40]. The resting potential along the cell membranes (–90 to –50 mV along <10 nm) generates an extraordinarily high E field of 107 V/m. The common consensus is that we require E > 1000 V/m to exceed the thermal noise. Such E fields are beyond the therapeutic level (). However, the minimum field strength (the so-called ‘thermal noise limit’) necessary to achieve a cell response remains unclear. Different sophisticated electrical models of the membrane have provided completely diverging estimations of the electric noise [Citation38–40], indicating the complexity of this issue. However, the thermal noise limit is a key parameter if non-equilibrium external signals must be comparable to the thermal noise [Citation41]. Obviously, the presence of pumps, transporters and channels (pores) embedded in a lipid bilayer must be considered in a valid theory, but this field is still largely unexplored. Therefore, ‘guided’ nonequilibrium VLF currents as induced in the tumor microenvironment may have a much stronger effect on the living cells than expected. One search strategy for non-temperature-dependent effects involves investigations conducted on various ion channels (e.g., potassium or calcium), which demodulate the AM-RF and may be influenced/triggered/modified by the VLF E fields according to their specific functionality.
Previously, Szasz et al. [Citation42] analyzed the consequences of depositing the power in the extracellular medium and postulated a heat flow that would induce various non-equilibrium thermal microprocesses. However, on a microscopic scale of 10 nm (cell membrane) to 10 µm (cell diameter), the relaxation times () are very short, enforcing thermal equilibrium after nanosecond to millisecond periods. We conclude that, after power activation, a microscopic temperature distribution steady state is achieved within some milliseconds; hence, our steady state analysis is valid. Recently, Papp et al. [Citation43] suggested that the non-temperature-dependent effects of mEHT can be explained by considering E field interactions with lipid rafts, which arise more frequently in some tumor cell membranes than in normal tissue [Citation44]. However, no experimental validation exists for this asserted mode of action.
In summary, the existence of non-temperature-dependent effects during mEHT is under debate as the specific proof still awaits experimental substantiation. Because mEHT is typically performed at low power levels (e.g., 130 W in [Citation12]), the achieved temperatures are probably also low (e.g., 38–39 °C). Typically, they are not measured. Therefore, the label ‘hyperthermia’ is probably misleading and could be replaced by ‘electromagnetic treatment’ or the like.
Conclusions
In this study, a possible additional effect of VLF-AM modulation of a carrier RF in tumors was evaluated from physical principles. Hence, we found that temperature-dependent mechanisms cannot be involved. Further investigations are recommended to evaluate the possible occurrence of non-temperature-dependent effects involving membranes and the local cell environment.
Acknowledgements
We acknowledge support from the German Research Foundation (DFG) and the Open Access Publication Fund of Charité – Universitätsmedizin Berlin.
Disclosure statement
On behalf of all authors, the corresponding author states that there is no conflict of interest.
References
- Issels RD, Lindner LH, Verweij J, et al. Effect of neoadjuvant chemotherapy plus regional hyperthermia on long-term outcomes among patients with localized high-risk soft tissue sarcoma: the EORTC 62961-ESHO 95 randomized clinical trial. JAMA Oncol. 2018;4:483–492.
- Datta NR, Stutz E, Gomez S, et al. Efficacy and safety evaluation of the various therapeutic options in locally advanced cervix cancer: a systematic review and network meta-analysis of randomized clinical trials. Int J Radiat Oncol Biol Phys. 2019;103:411–437.
- Datta NR, Puric E, Klingbiel D, et al. Hyperthermia and radiation therapy in locoregional recurrent breast cancers: a systematic review and meta-analysis. Int J Radiat Oncol Biol Phys. 2016;94:1073–1087.
- Datta NR, Rogers S, Ordóñez SG, et al. Hyperthermia and radiotherapy in the management of head and neck cancers: a systematic review and meta-analysis. Int J Hyperthermia. 2016;32:31–40.
- Wust P, Hildebrandt B, Sreenivasa G, et al. Hyperthermia in combined treatment of cancer. Lancet Oncol. 2002; 3:487–497.
- Wust P. Thermotherapy in oncology. Bremen/London/Boston (MA): UNI-MED Verlag AG; 2016.
- Canters RA, Paulides MM, Franckena M, et al. Benefit of replacing the sigma-60 by the sigma-eye applicator. Strahlenther Onkol. 2013;189:74–80.
- Kok HP, Crezee J, Franken NA, et al. Quantifying the combined effect of radiation therapy and hyperthermia in terms of equivalent dose distributions. Int J Radiat Oncol Biol Phys. 2014;88:739–745.
- Van der Zee J, Gonzalez Gonzalez D, van Rhoon GC, et al. Comparison of radiotherapy alone with radiotherapy plus hyperthermia in locally advanced pelvic tumours: a prospective, randomised, multicentre trial. Lancet. 2000;355:1119–1125.
- Harima Y, Nagata K, Harinma K, et al. A randomized clinical trial of radiation therapy versus thermoradiotherapy in stage III cervical carcinoma. Int J Hyperthermia. 2001;17:97–105.
- Harima Y, Ohguri T, Imada H, et al. A multicenter randomised clinical trial of chemoradiotherapy plus hyperthermia versus chemoradiotherapy alone in patients with locally advanced cervical cancer. Int J Hyperthermia. 2016;32:801–808.
- Minnaar CA, Kotzen JA, Ayeni OA, et al. The effect of modulated electro-hyperthermia on local disease control in HIV-positive and -negative cervical cancer women in South Africa: early results from a phase III randomised controlled trial. PLoS One. 2019;14:e0217894.
- Fiorentini G, Sarti D, Milandri C, et al. Modulated electrohyperthermia in integrative cancer treatment for relapsed malignant glioblastoma and astrocytoma: retrospective multicenter controlled study. Integr Cancer Ther. 2019;18:1534735418812691.
- Andocs G, Renner H, Balogh L, et al. Strong synergy of heat and modulated electromagnetic field in tumor cell killing. Strahlenther Onkol. 2009;185:120–126.
- Andocs G, Meggyeshazi N, Balogh L, et al. Upregulation of heat shock proteins and the promotion of damage-associated molecular pattern signals in a colorectal cancer model by modulated electrohyperthermia. Cell Stress Chaperones. 2015;20:37–46.
- Andocs G, Rehman MU, Zhao QL, et al. Comparison of biological effects of modulated electro-hyperthermia and conventional heat treatment in human lymphoma U937 cells. Cell Death Discov. 2016;2:16039.
- Meggyesházi N, Andocs G, Balogh L, et al. DNA fragmentation and caspase-independent programmed cell death by modulated electrohyperthermia. Strahlenther Onkol. 2014;190:815–822.
- Yang KL, Huang CC, Chi MS, et al. In vitro comparison of conventional hyperthermia and modulated electro-hyperthermia. Oncotarget. 2016;7:84082.
- Foster KR, Schwan HP. Dielectric properties of tissues and biological materials: a critical review. Crit Rev Biomed Eng. 1989;17:25–104.
- Silbernagl S, Despopoulos A. Color atlas of physiology. 7th ed. Stuttgart/New York (NY): Georg Thieme Verlag; 2015.
- Kotnik T, Miklavcic D. Theoretical evaluation of the distributed power dissipation in biological cells exposed to electric fields. Bioelectromagnetics. 2000;21:385–394.
- Kotnik T, Miklavcic D. Second-order model of membrane electric field induced by alternating external electric fields. IEEE Trans Biomed Eng. 2000;47:1074–1081.
- Pethig R. Dielectric properties of biological materials: biophysical and medical applications. IEEE Trans Elect Insul. 1984;5:453–474.
- Gabriel S, Lau RW, Gabriel C. The dielectric properties of biological tissues: II. Measurements in the frequency range 10 Hz to 20 GHz. Phys Med Biol. 1996;41:2251.
- Gabriel S, Lau RW, Gabriel C. The dielectric properties of biological tissues: III. Parametric models for the dielectric spectrum of tissues. Phys Med Biol. 1996;41:2271.
- Trefná HD, Crezee J, Schmidt M, et al. Quality assurance guidelines for superficial hyperthermia clinical trials. Strahlenther Onkol. 2017;193:351–366.
- Kok HP, Kotte ANT, Crezee J. Planning, optimisation and evaluation of hyperthermia treatments. Int J Hyperthermia. 2017;33:593–607.
- Szasz A, Szasz O, Iluri N, inventor. Radiofrequency hyperthermia device with targeted feedback signal modulation. United states Patent US 9,320,911 B2. 2016.
- Meinke HV, Gundlach FW. Paperback of high frequency engineering with the collaboration of several experts. Berlin/Heidelberg/New York (NY): Springer-Verlag; 2013.
- Pennes HH. Analysis of tissue and arterial blood temperatures in the resting human forearm. J Appl Phys. 1948;1:93–122.
- Grandia W, Bar-Cohen Y, inventor. Medical noninvasive operations using focused modulated high power ultrasound. United States patent US 5,827,204. 1998 Oct 27.
- Schäfer H, Schwan HP. Zur Frage der selektiven Erhitzung kleiner Teilchen im Ultrakurzwellen-Kondensator Feld. Ann Phys. 1943;43:99–135.
- Rabin Y. Is intracellular hyperthermia superior to extracellular hyperthermia in the thermal sense? Int J Hyperthermia. 2002;18:194–202.
- Hedayati M, Thomas O, Abubaker-Sharif B, et al. The effect of cell cluster size on intracellular nanoparticle-mediated hyperthermia: is it possible to treat microscopic tumors? Nanomedicine. 2013;8:29–41.
- Litvak E, Foster KR, Repacholi MH. Health and safety implications of exposure to electromagnetic fields in the frequency range 300 Hz to 10 MHz. Bioelectromagnetics. 2002;23:68–82.
- Adair RK. Biophysical limits on athermal effects of RF and microwave radiation. Bioelectromagnetics. 2003;24:39–48.
- Foster KR, Glaser R. Thermal mechanisms of interaction of radiofrequency energy with biological systems with relevance to exposure guidelines. Health Phys. 2007;92:609–620.
- Weaver JC, Astumian RD. The response of living cells to very weak electric fields: the thermal noise limit. Science. 1990;247:459–462.
- Kaune WT. Thermal noise limit on the sensitivity of cellular membranes to power frequency electric and magnetic fields. Bioelectromagnetics. 2002;23:622–628.
- Vincze G, Szasz N, Szasz A. On the thermal noise limit of cellular membranes. Bioelectromagnetics. 2005;26:28–35.
- Bier M. Gauging the strength of power frequency fields against membrane electrical noise. Bioelectromagnetics. 2005;26:595–609.
- Szasz A, Vincze GY, Szasz O, et al. An energy analysis of extracellular hyperthermia. Electromagn Biol Med. 2003;22:103–115.
- Papp E, Vancsik T, Kiss E, et al. Energy absorption by the membrane rafts in the modulated electro-hyperthermia (mEHT). OJBIPHY. 2017;07:216–219.
- Agus DB, Alexander JF, Arap W, et al; for Oncology Centers Network. A physical sciences network characterization of non-tumorigenic and metastatic cells. Sci Rep. 2013;3:1449.