
Abstract
Introduction
An abscopal effect is a clinical observation whereby a local treatment is associated with regression of metastatic cancer at a site distant from the primary location of treatment. Here, we describe the clinical systemic effect induced by regional hyperthermia combined with low-dose chemotherapy and provide immunologic correlates.
Case presentation
A 15-year-old patient had been diagnosed with alveolar rhabdomyosarcoma (ARMS). All previous treatment options failed in the patient including haploidentical stem cell transplantation and donor lymphocyte infusion. The patient presented with local and metastatic disease, and upon admission, underwent regional hyperthermia combined with low-dose chemotherapy. Immediately following therapy severe skin reactions were observed. Skin biopsies revealed an intraepithelial lymphocytic infiltration dominated by CD3+/CD8+ T cells with a regular network of dendritic cells. Clinical images compared before and during sequential treatment cycles showed complete metabolic response of the local tumor for more than 10 months of therapy. In addition, metastases completely regressed although they were not direct targets of regional hyperthermia. The systemic effect was associated with enhanced frequency of NK cells and T cells expressing the lectin-like natural-killer group 2 D activating receptor (NKG2D), an increase of the CD56bright subset of NK cells, as well as an increase of effector/memory and effector CD8+ and CD4+ T cells in the blood while the percentage of CD25+FOXP3+ regulatory T cells declined.
Conclusions
Regional hyperthermia combined with low-dose chemotherapy had the potential to create a systemic effect which was associated with activation of NK cells and T cells.
Introduction
Alveolar rhabdomyosarcoma (ARMS) with PAX3–FKHR translocation is an aggressive subtype of rhabdomyosarcoma in childhood with dismal prognosis [Citation1]. Regional hyperthermia is a noninvasive cancer treatment targeting heat (range 41–43 °C) to the region of the localized tumor without an increase of the systemic body temperature. In a randomized phase III trial comparing regional hyperthermia combined with chemotherapy to chemotherapy alone, the addition of heat improved local tumor control in patients with high-risk soft tissue sarcoma [Citation2]. After long-term follow-up, survival was improved also in the subgroup of patients with extremity tumors who usually die of metastases, suggesting immune effects outside of the heated target [Citation3]. Cell stress provides critical cues for activating and targeting the immune system to recognize cancer cells [Citation4]. Up-regulation of the MHC class I chain-related protein family (MICA, MICB) and induction of heat shock protein 70 (HSP70) by heat-stress have been identified as triggers to activate innate immunity and to bridge toward adaptive immunity [Citation5]. NK cells as well as cytotoxic CD8+ and subsets of CD4+ T cells express the lectin-like natural-killer group 2 D (NKG2D) activating receptor and thereby can receive co-stimulation through stress-induced NKG2D ligands, like MICA/B and HSP70, and thereby support their capacity to kill tumor cells [Citation6]. Furthermore, NK cells recognize and target cells with an incomplete or incompatible expression of MHC class I molecules (KIR-ligand mismatch) [Citation7].
Case presentation
A female adolescent received a diagnosis of disseminated rhabdomyosarcoma in August 2008 at 15 years of age. The primary tumor originated from the nasal cavity with cervical, mandibular, and axillary lymph node metastasis, including pelvic bone with bone marrow involvement. Lymph node biopsy revealed ARMS with the PAX3–FKHR-translocation. Standard vincristine, adriamycin, ifosfamide, and actinomycin D (VAIA) chemotherapy was initiated according to the high-risk arm of the CWS-IV 2002 protocol with hyper-fractioned radiotherapy of the primary tumor region and sites of lymph node involvement. Remission was consolidated by tandem high-dose thiotepa/cyclophosphamide and melphalan/etoposide chemotherapy. In May 2009, because of relapse, the patient was considered for haploidentical stem-cell transplantation (h-SCT) with her father as an HLA-A2 mismatched donor. After conditioning, she received a total of 4.90 × 10⁶/kg CD34+ (CD3/CD19-depleted) cells. The patient developed grade 4 acute graft-versus-host disease (GvHD) but remained disease-free for 18 months thereafter. Full donor chimerism was confirmed and no fusion transcript of the PAX3/FKHR gene was detected by molecular analysis of the bone marrow aspirate.
In November 2010, the patient developed scleral icterus and pathological blood chemistry of intrahepatic cholestasis. The F-18 fluorodeoxyglucose (FDG) PET-CT-scan showed an abdominal tumor mass of 4 × 8 cm bi-dimensional diameter. Metastases were seen in cervical lymph nodes and in the skeletal system (, Panel A). The CT-guided tumor aspiration specimen revealed desmin-positive tumor cells consistent with the diagnosis of ARMS. The tumor cells expressed high levels of CD56 and were negative for PD-L1 (Supplementary Figure S1). In December 2010, she received a donor lymphocyte infusion (DLI) dosed at 1 x 10⁶ CD3+/kg without signs of GvHD. Upon presentation four weeks later, the FDG PET-CT scan (, Panel B) showed disease progression at all sites and the condition of the patient deteriorated (ECOG 3). By ultrasound examination, extensive ascites fluid formation was diagnosed that required consecutive draining puncture twice weekly. Response to DLI had not occurred with apparent continued worsening of disease at all three sites, appearance of a new bone lesion at the right extremity and increased size of the lymphadenopathy with heightened metabolic activity. The clinical situation required immediate therapeutic intervention. At the end of January 2011, the first cycle of regional hyperthermia was started in combination with low-dose three-drug chemotherapy based on the original full-dose regimen (ICE) as previously published [Citation8]. Regional hyperthermia was performed by the use of an annular phased array applicator with eight pairs of microwave antennas surrounding the patient’s abdomen to focus the heating field to the abdominal tumor (Pyrexar Company, Salt Lake City, Utah) without increase of systemic temperature as controlled routinely during treatment. Regional hyperthermia was applied in accordance with the safety and quality guidelines of the European Society for Hyperthermic Oncology [Citation9].
Figure 1. Results of diagnostic imaging throughout the disease course. (A) Whole body metabolic F-18 fluorodeoxyglucose (FDG) PET (maximum intensity projection, left) and axial CT, PET-CT, and PET (right, from top to bottom) of a cervical and an abdominal cross-section imaging are shown, corresponding to the timeline showing therapy and disease status. Red circles of the whole body PET indicate the bone metastasis of the right humerus and red circles of the PET on the cervical cross-section show the metabolic activity of the left lymphadenopathy which is also marked by white and green arrows of the CT and PET-CT. The abdominal cross-section shows the abdominal tumor mass with high metabolic activity. Panel A (left) represents the status two months before start of treatment with regional hyperthermia and low-dose chemotherapy. Of note is the high metabolic activity of multiple bone lesions (e.g., scapula, vertebral column, right humerus, pelvis, sternum, and os sacrum). Panel B shows images 1 month after DLI, when the response to DLI had not occurred, with apparent continued worsening disease at all three sites, showing progression of the abdominal tumor, the appearance of a new bone lesion at the right extremity, and the increased size of the lymphadenopathy with increased metabolic activity before entering treatment. Panel C shows images 12 weeks after two treatment cycles. The heat-targeted abdominal tumor mass showed a partial response with lower metabolic activity. Furthermore, disease response outside of the hyperthermia field was seen with only minor remaining activity detectable at the right humerus (red circle) and at the involved left lymph node (CT, white arrow and PET-CT, green arrow). Panel D shows images after nine treatment cycles with complete response of the abdominal tumor and of distant metastases. Rest of focal activity corresponds to an implanted stent. Panel E illustrates 2 months after end of the 11th cycle the recurrence of local and distant disease at multiple sites. Enlargements are shown for Panel B (12/2010) at recurrent progressive disease and D (08/2011) at complete remission after regional hyperthermia plus low-dose chemotherapy. (B) Schematic drawing of the treatment course: The numbers (blue) indicate the number of each cycle of low-dose chemotherapy combined with regional hyperthermia. The date of imaging and disease status is given by the letters A, B, C, D, and E.
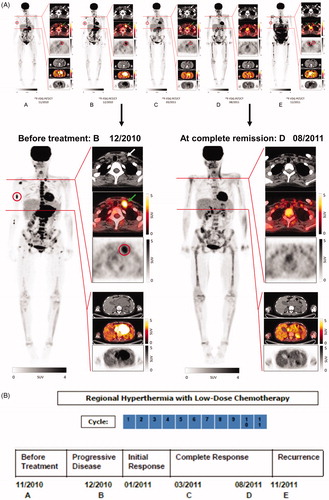
For the first cycle, the patient received ifosfamide (1.5 g/m2), carboplatin (100 mg/m2) and etoposide (150 mg/m2) on day 1 and day 3 (50% reduced dose of the ICE regimen) combined with regional hyperthermia (60 min) on day 1 and day 3. On day 6, the patient developed severe, general skin erythema (to the face, trunk, and proximal parts of both extremities) which was controlled by steroids. Within three weeks of the first treatment cycle, the patient’s performance improved dramatically with arrest of ascites fluid formation and complete pain relief, which allowed the patient to cease pain medication. Because the unexpected rapid improvement of the patient’s performance was accompanied by severe skin reaction at a site outside the heated area, immune monitoring was initiated after the first cycle. In February 2011, after the second cycle of regional hyperthermia with chemotherapy (ifosfamide (0.75 g/m2), carboplatin (50 mg/m2), and etoposide (75 mg/m2) on day 1 and day 3 (25% reduced-dose of the ICE regimen), skin erythema occurred again and a skin biopsy was taken from the thigh outside the hyperthermia field. The FDG PET-CT follow-up scan of March 2011 showed shrinkage of the abdominal tumor and lower metabolic activity of all metastases. The previously palpable left cervical nodule was no longer detectable (, Panel C). In June 2011, another dose of 1 × 10⁶ CD3+/kg DLI was applied without any GvHD reaction. The FDG PET-CT of August 2011 (, Panel D) documented no metabolic activity of the abdominal tumor and no evidence of cervical lymph node involvement and bone lesions. During the 3- to 4-week intervals between the 5th and the 11th treatment cycle of regional hyperthermia combined with low-dose chemotherapy, the patient was fully active, played golf and traveled abroad (ECOG 0). In November 2011, disease recurrence became clinically evident and the FDG PET-CT confirmed relapse of an abdominal tumor with metastases (, Panel E). In December 2011, the patient died with chemo-refractory disease. In total, the patient received 22 regional hyperthermia treatments with 11 low-dose chemotherapy cycles. The dose intensity (mg/m2/week) over the time-period was 634.9 for ifosfamide, 42.3 for carboplatin, and 63.5 for etoposide, respectively.
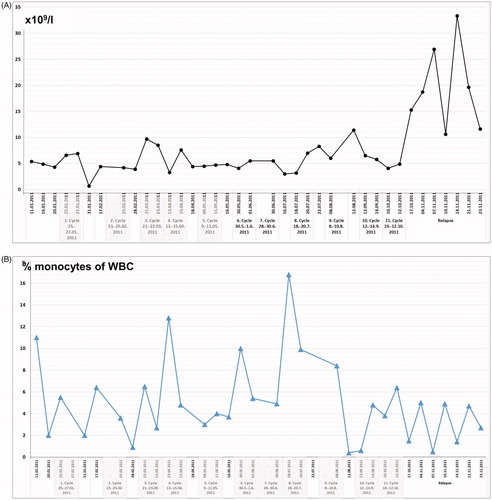
On presentation in January 2011, routine laboratory analysis revealed white blood cell counts of 5 × 10⁹/l before start of treatment, remaining in the range between 3 × 10⁹/l and 11 × 109/l over the course of the 11 treatment cycles. A steep increase was noticed at the time of relapse due to septic complications (range 12 × 109/l to 33 × 109/l) (). The percentage of monocytes was 11% before start of treatment and showed peak levels before the fourth cycle (12%) and the eighth cycle (17%) with a decline (range 0.5–5%) at the time of relapse ().
Figure 2. (A) White blood cell (WBC) counts (number × 109/l) and (B) monocytes given as percentage (%) of WBC counts, of peripheral blood samples taken before start of regional hyperthermia with low-dose chemotherapy, from 1st to 11th treatment cycles, and during the time of relapse.
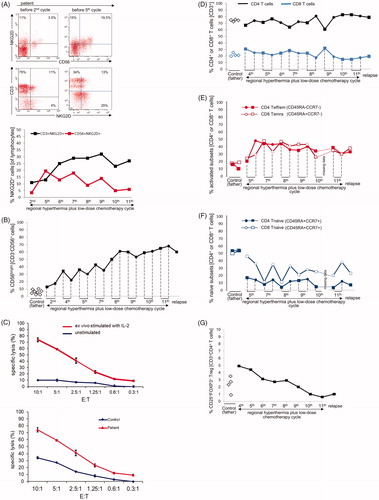
NK cells expressing the activating receptor NKG2D (CD56+NKG2D+) increased sharply during the time of initial response (5.6-fold increase between second and fifth treatment cycle) and thereafter started to decline. T cells expressing NKG2D (CD3+NKG2D+) showed a steady increase (2.9-fold) between treatment cycle 2 and 9 with a peak at the time of complete response (). Among patient NK cells, the CD56bright NK cell subsets increased significantly in parallel with local tumor shrinkage and regression of metastases, representing more than half of all NK cells and the frequency remained elevated until the 11th cycle, after which a decline was observed concurrent with disease relapse (). The CD56brightCD16+ and CD56brightCD16- NK cell subsets showed similar dynamics (Supplementary Figure S3). To determine the lytic potential of the NK cells, ex vivo unstimulated and IL-2-stimulated PBMCs of the patient were tested against K562 target cells. Cytotoxic activity was deficient but could be restored by ex vivo stimulation with IL-2 and was higher in the patient compared to the father who served as a healthy control (). Within the T cell compartment, the frequencies of CD4+ and CD8+ T cells in patient PBMCs were similar to those of the father () and remained so at relapse. Accordingly, the CD4+/CD8+ ratio was also similar to control (not shown). The frequencies of terminally differentiated (Temra) cytotoxic CD8+ (CD45RA+CCR7-) T cells and effector/memory CD4+ (CD45RA−CCR7−) T cells increased by a factor of more than 2 () with a reciprocal marked decline in the numbers of naïve CD8+ and CD4+ (CD45RA+CCR7+) T cells. This proportional change remained stable until the 11th cycle and at relapse without replenishment of the naive T cell repertoire (). Among CD4+ T cells, regulatory T cells (CD25+FOXP3+) of the patient were initially elevated but declined significantly during treatment () and remained at low levels at relapse.
Figure 3. Changes of NKG2D expression on NK and T cells, CD3-CD56bright NK cells, lytic NK cell activity, and frequency of T cell subsets during regional hyperthermia and low-dose chemotherapy. PBMCs were collected at different time points during the disease course and used to measure lytic activity and to define cell subset composition by flow cytometry. Respective measurements were also performed with blood samples of the father (control). (A) Increase in frequencies of NKG2D-expressing cells in patient lymphocytes between the second and fifth treatment cycle. Depicted are CD56/NKG2D and CD3/NKG2D dot plots of lymphocytes (gated as alive, single, small cells in PBMCs). Numbers in the respective quadrants refer to the percentage positively stained cells. In the CD56/NKG2D dot plot, the upper right quadrants are CD56+NKG2D+ cells, which correspond to NKG2D+ NK cells (3.5% and 19.5%, respectively). Lower right quadrants are CD56+ NKG2D− cells. The lower left quadrants are NKG2D−CD56− lymphocytes (B cells and NKG2D− T cells). In the CD3/NKG2D dot plot, the upper right quadrant corresponds to the CD3+NKG2D+ T cells, which are 11% (second treatment cycle) and 13% (fifth treatment cycle). The quadrants were set according to isotype control stainings. The dynamics of NKG2D expression on NK cells (CD56+NKG2D+) and T cells (CD3+NKG2D+) is shown in the bottom graph. The values at each treatment cycle are the percentages of CD3+NKG2D+ and CD56+NKG2D+ cells among gated live lymphocytes. (B) Increase in frequency of CD3-CD56bright NK cells in the patient’s PBMCs before (closed squares) and after (closed circles) the 2nd, 4th, 5th, 7th, 8th, 9th, 10th, and 11th treatment cycles and at relapse (4th November 2011) in comparison to PBMCs of the father at different time points (open diamonds). The values are the percentages of all CD56bright NK cells within the NK cell population (without discrimination according to CD16 expression), gated as CD3−CD56+ lymphocytes. The increase of CD3−CD56bright NK cells over the disease course was statistically significant (p = 0.031) considering the values measured before each treatment cycle. For details concerning the flow cytometry and statistics see Supplementary Appendix. (C) Upper panel: lytic activity of ex vivo IL-2-stimulated (red) and unstimulated (blue) PBMCs of the patient (before the fourth treatment cycle) against K562 cells at effector (PBMC) to target (K562) ratios of 10:1 to 0.3:1, as determined by a standard 4-h Europium assay. Lower panel: Lytic activity of ex vivo IL-2-stimulated PBMCs of the patient (before the fourth treatment cycle, red) and the father (control, blue) against K562 cells at effector (PBMC) to target (K562) ratios of 10:1 to 0.3:1, as determined by a standard 4-h Europium assay. Mean values of triplicates are shown in the experiment. The specific lysis is calculated according to the equation: (experimental release – spontaneous release)/(maximum release – spontaneous release) x 100. For technical details see Supplementary Appendix. (D) CD4+ and CD8+ T cell frequencies in PBMCs taken before (closed squares) and after (closed circles) the 4th, 5th, 7th, 8th, 9th, 10th, and 11th treatment cycles and at relapse (4th November 2011) in comparison to PBMCs of the father (control) at different time points (open diamonds). The frequencies were determined by flow cytometry after gating on live, single CD3+ T cells. For technical details see Supplementary Appendix. (E) Change in frequencies of CD4+ T effector/memory (Teff/em) and terminally differentiated CD8+ T cells (Temra) and (F) Change in frequency of naive CD4+ and CD8+ T cells (CD45RA+CCR7+) in patient PBMCs before (squares) and after (circles) the 5th, 7th, 8th, 9th, 10th and 11th treatment cycles, and at relapse (4th November 2011) compared to father (control). PCMCs were stained with antibodies to CD3, CD4, CD8 CD45RA and CCR7. The CD3+ T cells were selected and subdivided for CD4+ and CD8+ T cells, which were then subcategorized according to the markers CD45RA and CCR7 in naïve (CD45RA+CCR7+), effector/memory (Teff/em, CD45RA−CCR7−), central memory (Tcm, CD45RA−CCR7+) and terminally differentiated cytotoxic T cells (Temra, CD45RA+CCR7−) (for details see Supplementary Appendix). Temra are mostly found in the CD8+ T cell population and represent those with a cytotoxic differentiation status. (G) Decline in frequencies of CD25+FOXP3+ regulatory T cells (Treg cells) during treatment course, including the time point at relapse. PBMCs were stained with antibodies to detect CD3, CD4, CD25 and FOXP3, the later following cell permeabilization. The frequency of CD25+FOXP3+ Treg cells was determined among the CD4+ T cells by gating on live CD3+CD4+ lymphocytes. Depicted are the percentages of CD25+FOXP3+ Treg of the patient PBMCs harvested before the indicated treatment cycle (black squares) and the father’s PBMCs at different time points. The decline overs disease course was statistically significant (p = 0.031). For technical details regarding flow cytometry and statistics see Supplementary Appendix.
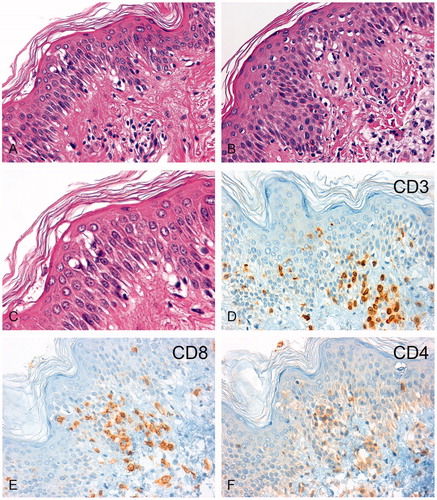
The two skin biopsies taken at the time of severe skin reactions after application of regional hyperthermia showed an intraepithelial lymphocytic infiltration dominated by CD3+/CD8+ T cells with a regular network of dendritic cells (). Skin-infiltrating CD56- or granzyme B-positive NK cells were not detected by immunohistochemistry in the skin biopsies (data not shown).
Figure 4. Immunohistochemical analysis of lymphocytic infiltrates in the skin biopsies. H&E sections of the skin biopsy taken in February 2011 (A, 200-fold) and November 2011 (B, 200-fold) are shown. After regional hyperthermia concurrent with the skin erythema, a chronic interface dermatitis with focal epithelial lymphocytic infiltrates was found in both biopsies. The magnified image (C, 630-fold) revealed epidermal spongiosis, vacuolization of basal cell layers, and dyskeratotic keratinocytes with few apoptotic bodies. The immunohistochemistry showed an infiltration by CD3+ T-lymphocytes (D) which consisted predominately of CD8+ cytotoxic T lymphocytes (E) and fewer CD4+ T helper cells (F).
Discussion and conclusions
Regional hyperthermia added to chemotherapy has gained increasing attention as a promising treatment for high-risk soft tissue sarcoma [Citation10]. Regional hyperthermia affects a range of cellular targets and processes, including anti-cancer immunity which might explain consistent prolonged benefits [Citation11]. In a preclinical model, it was reported that magnet-mediated hyperthermia alone could exert a strong abscopal effect against distant non-treated tumors, and could stimulate significant endogenous immune responses in sarcoma-bearing rats, by improving the CD4+/CD8+ T cell ratio [Citation12].
The results presented in this manuscript describe for the first time a clinical report of a systemic effect by regional hyperthermia combined with low-dose chemotherapy associated with stress-induced immune activation. The patient described in this case report had received prior chemotherapy followed by h-SCT and DLI, which resulted in complete tumor remission and full donor chimerism. After 17 months, in November 2010, tumor recurred at multiple sites and was refractory to treatment, including DLI given in December 2010. Thus, when admitted to our hospital one month after DLI, response to DLI had not occurred, with apparent continued worsening of disease at all three sites, progression of the abdominal tumor, appearance of a new bone lesion at the right extremity, and increased size of the lymphadenopathy with increased metabolic activity (, Panel B). Thus, her own immune cells and those of the DLI donor, as well as chemical treatments, had failed to control disease. While the previous stem cell transplantation (17 months before tumor relapse) had enabled disease control for several months, the allogeneic immune system obviously was no longer active against the tumor, hence relapse and progressive disease occurred at the time of new admittance. Importantly, the most recently applied DLI (given December 2010) could not restart an antitumor process.
After two cycles of regional hyperthermia with low-dose chemotherapy, the heat-targeted abdominal tumor mass showed a partial response with lower metabolic activity (, Panel C) and disease response outside of the hyperthermia field was seen, with only minor remaining activity detectable at the right humerus and at the involved left lymph node. This systemic effect already seen after 3 months was followed by complete remission 5 months later after nine cycles of regional hyperthermia with low-dose chemotherapy (, Panel D).
Thus, disease progression at admission and disease resistance to DLI (December 2010) was overcome by combined treatment with regional hyperthermia and chemotherapy. The patient developed local and systemic clinical responses and metastases regressed which were not targets of regional hyperthermia. The disease regression observed at distant sites is a strong indication that systemic effects were induced by hyperthermia, similar to reports of abscopal effects caused by radiation [Citation13]. During the application of regional hyperthermia, the tumor area reaches temperature around 41.8 °C, but the systemic body temperature remained at 37 °C. An increase of temperatures at the bone or cervical lymph node metastases was unlikely. Yet, we cannot rule out that blood of the heated abdominal region had warmed neighboring (nonheated) tissues.
It is also unlikely that the remarkable systemic response of the patient was due to low-dose chemotherapy alone, since such a rapid onset of the response as observed in this patient was not seen previously, neither in cases receiving high-dose ICE alone in chemo-sensitive patients, nor in chemo-pretreated patients receiving ICE combined with regional hyperthermia as salvage treatment [Citation8,Citation14]. In the case presented here, much lower doses and dose intensity of the ICE regimen were used because of the poor clinical condition of the patient (ECOG 3). Besides their direct cytotoxic effects, chemotherapeutic agents can stimulate immune responses either by inducing immunogenic cell death or by engaging immune effector mechanisms [Citation15]. We speculate that the dose-reduced regimen of chemotherapy including ifosfamide contributed to the observed decline of regulatory T cells. Restoration of effector T cells as well as cytolytic activity of NK cells has been observed when this immunosuppressive T cell subset was depleted by cyclophosphamide [Citation16]. Whether the reduced numbers of regulatory T cells contributed to the restoration of allo-reactive T cells and the cytolytic activity of NK cells, as well as the described induction of primed effector/memory T cells, remains an open issue. The applied dose of 90 mg/m2 of ifosfamide per day is within the range of metronomic chemotherapy to cause such effects. Metronomic chemotherapy involves the frequent administration of conventional chemotherapeutic agents at low dose. The intention of conventional therapy is to treat cancer directly by inhibiting or killing rapidly dividing tumor cells whereas metronomic chemotherapy is administered with the aim of achieving cancer control by evoking immune-stimulatory properties.
Immunologic changes were observed in the blood, which included an increase of CD56bright NK cells and T cells expressing the activating NKG2D receptor. This suggests that heat-stress delivered essential signals for expansion and reactivation of these immune cells via the NKG2D receptor [Citation17]. Evidence for such a scenario is seen in preclinical studies where NKG2D ligands, like HSP70 and MICA/B, are up-regulated upon stress conditions [Citation18]. Regulation of MICA/B through heat-stress is in agreement with the knowledge that the promotor regions of MIC genes contain heat-shock elements similar to those found in the human HSP70 promotor [Citation19]. Furthermore, HSP70 expressed on tumor cells has been identified to serve as a recognition structure for ex vivo activated human NK cells expressing NKG2D [Citation20].
In addition, the patient showed increases of primed effector CD8+ and effector/memory CD4+ T cells early after treatment initiation indicating that activation of T cells also occurred. Indeed, the patient showed skewed differentiation of CD8+ and CD4+ T cells with high frequencies of effector CD8+ and memory CD4+ T cells concomitant with a deficiency of naive T cells, in particular in the CD4+ T cell compartment.
The observed skin erythema can be considered as an additional sign of systemic immune activation. Time wise, the skin erythema occurred directly after regional hyperthermia. In contrast to the repeated observations of skin reactions following regional hyperthermia combined with low-dose chemotherapy, neither of the two DLI applications were associated with typical clinical signs of GvH/GvT or any changes in immune findings. The lymphocytic infiltrates of cytotoxic T cells observed in the skin that resembled an acute GvHD reaction might be interpreted as a clinical biomarker for an ongoing T cell activation.
Because of the known history of h-SCT performed 17 months earlier, surface expression of killer cell immunoglobulin receptors (KIR) was analyzed on the patient’s NK cells. Both patient and donor had an activating KIR haplotype B, which has been shown to positively influence outcomes in leukemias by reducing the risk of relapse [Citation21]. We assume that the KIR haplotype B may be also beneficial in solid tumors. Moreover, according to the receptor-ligand mismatch, we could detect potentially alloreactive donor-derived NK cells in the patient post-transplant. Those cells expressed only the CD158b receptor (KIR1DL2/KIRDL3) but not CD158a (KIR2DL1) or CD158e (KIR3DL1) receptors. Since the patient had HLA-C alleles belonging to the Cw2 group, which are no cognate ligands for the CD158b receptor, the NK cell subset should not be inhibited. Thus, part of the heat-stress induced immunity could be mediated by NK cells with the potential for allo-reactivity [Citation22]. Indeed, sporadic cases of pediatric malignancy have been treated using h-SCT alone or followed by DLI with the aim of exerting a graft-vs-tumor effect [Citation23,Citation24]. In contrast, our patient had disease progression after DLI when she was considered to receive regional hyperthermia combined with low-dose chemotherapy. Thus, the NK cells of this patient were obviously inactive or exhausted at this stage of disease. This is consistent with our previous results in chemo-pretreated patients with high-risk soft tissue sarcoma who showed downregulation of NKG2D-expressing NK cells accompanied with decreased cytotoxic activity [Citation25]. Treatment with regional hyperthermia may have functionally activated patient NK cells and CD56bright NK cells, which increased continuously with each treatment cycle. These cells may have also contributed to an antitumor response. Supportive of an NK-associated mechanism of antitumor response is the observation that the patient’s tumor cells aberrantly expressed CD56, also known as neural cell adhesion molecule-1 (NCAM-1). Aberrant CD56 expression is a common finding for rhabdomyosarcoma, including ARMS [Citation26], and a recent study indicates an association between tumor-cell expression of CD56 and sensitivity to NK-cell-mediated killing in breast cancer [Citation27].
Soluble MIC, shredded by tumor cells, is capable of binding the NKG2D receptor on NK and T cells and, in consequence, the receptor is internalized and no longer present for T and NK cell activation [Citation28,Citation29]. Therefore, ligand shedding by tumor cells is a powerful way to overcome NKG2D-mediated immune surveillance which might explain why treatment eventually failed the patient.
An alternative reason for final treatment failure could be the accumulation of activated effector and memory T cells without simultaneous replenishment of the naive T cell repertoire which occurred concurrent with control of disease. Indeed, an unlimited consumption of naive T cells can lead to loss of immune control, a situation that is observed in persistent infection [Citation30]. The reduced frequencies of naïve CD4+ and CD8+ T cells could be a direct result of ifosfamide administration even at low-dose, which has been shown to block T cell proliferation and their functional activity whereas NK cells were not substantially affected [Citation31]. To avoid the unlimited consumption of naïve T cells, it might be reasonable to use DLI during the treatment of regional hyperthermia and chemotherapy in the setting of future trials. DLI has been already shown to efficiently reverse CD8+ T cell exhaustion [Citation32]. The observed higher frequencies of monocytes before start of treatment, the peak levels at the time of response, and the decline at the time of relapse are in line with a recent study identifying the number of classical monocytes in the peripheral blood as a potential biomarker for response to anti-PD-1 immunotherapy [Citation33]. Despite ongoing immune activation in the blood, solid tumors can build up local immune evasion mechanisms that inhibit T and NK cell activity through the induction of immune inhibitory pathway, such PD-1/PD-L1 [Citation34], or prevent immune cells from infiltrating the tumor milieu [Citation35].
In summary, we present a clinical case study of a patient at end stage of disease where the immune system had failed to control disease progression. The observed systemic effect with disease regression at distant sites associated with restoration of NK cell activity and priming of T cells are suggestive for stress-related immune-effects induced by local hyperthermia treatment combined with low-dose chemotherapy in this patient. A schematic diagram illustrates the hypothetical mechanisms of action based on published preclinical reports and the results as discussed (). An ongoing phase II randomized clinical trial is prospectively validating the potential of regional hyperthermia combined with chemotherapy to induce immunity against distant metastases [Citation36].
Figure 5. (A) Working hypothesis of (heat) stress-induced immune activation. CD56bright NK cells expressing the NKG2D activating receptor ![]()
![Figure 5. (A) Working hypothesis of (heat) stress-induced immune activation. CD56bright NK cells expressing the NKG2D activating receptor Display full size interact with MICA/B Display full size and HSP70 Display full size that are co-induced on tumor cells by regional hyperthermia. Activated CD56bright NK cells have the capacity to lyse tumor cells directly [Citation18,Citation20,Citation37–39]. CD56bright NK cells secret IFN-γ and thereby promote the activation of CD4+ helper T cells. CD4+ helper T cells recognize tumor peptides Display full size presented by MHC class II molecules on DCs and thereby can stimulate the CTL response of CD4+ effector/memory T cells (modified from Ref. [Citation7]). Alternatively, HSP70-chaperoned tumor peptides (HSP70-peptide complexesDisplay full size) released from the dying tumor (immunogenic cell death through hyperthermia) are taken up by DCs. Cross-presentation of peptides by MHC class I molecules on DCs then stimulate the response of CD8+ cytotoxic T cells [Citation37,Citation38]. Low-dose chemotherapy is able to kill Treg cells, thereby, blocking the immunosuppressive effects of Treg cells on the CTL response [Citation16]. (B) Despite the setting of HLA haplotype-mismatched HSCT, where NK cells are not inhibited by KIR/HLA class I interactions, tumor cell killing does not occur if the tumor cells lack activating ligands (MICA, HSP70) for the NK cell-expressed activating receptor NKG2D and if Tregs are present (modified from Refs. [Citation7,Citation22]). The capacity of allogeneic cytotoxicity of NK cells can be restored by hyperthermia which is known to induce MICA/B and HSP70 expression on the tumor cells. This provides the signals for the NKG2D activating receptor expressed on NK cells [Citation18]. Low-dose chemotherapy is able to kill Treg cells, thereby blocking the immunosuppressive effects of Treg cells on the allogeneic NK activity [Citation16]. Abbreviations: CTL: cytotoxic T cell; DC: dendritic cell; HLA: human leukocyte antigen; HSP: heat shock protein; HSCT: hematopoietic stem cell transplantation; IFN-γ: interferon gamma; KIR: killer immunoglobulin-like receptor; MIC or MIC: MHC class I chain-related protein family; MHC: major histocompatibility complex; NK: natural killer; NKG2D: natural killer group 2D; Treg: regulatory T cells.](/cms/asset/5682cb13-5c95-4a97-b2fd-2cde546d0bda/ihyt_a_1709666_f0005_c.jpg)
Ethical approval
After presentation, the treatment was approved by our Institutional Board Review Committee. The legal guardian (father) had signed informed consent.
Authors’ contributions
R.I., C.S. designed the study treatment. R.I. wrote the manuscript. C.S., L.L., O.S., I. v L., S.B. investigated the patient. R.I., G.M., E.N. supervised and managed the data generation. G.M. and E.N. analyzed NK cell and T cell data. J.E., H.D., B.M., performed and analyzed flow cytometry data. M. v B., D.S., L.L., R.H., P.L. contributed to the analysis and interpretation of the data. J.N., T.K. performed the analysis of the skin biopsies. K.S., M.B. performed the analysis of the final needle tumor aspirate. C.R., performed and evaluated the FDG-PET imaging. U.M. performed statistical analysis.
Supplemental Material
Download PDF (560.6 KB)Acknowledgments
The authors are indebted to the parents of the patient who supported their treatment approach throughout despite the final dismal outcome.
Disclosure statement
The authors declare that they have no competing interests.
Data availability
All data generated or analyzed during the current study are available from the corresponding author on reasonable request.
Additional information
Funding
Related Research Data
References
- Sorensen PH, Lynch JC, Qualman SJ, et al. PAX3-FKHR and PAX7-FKHR gene fusions are prognostic indicators in alveolar rhabdomyosarcoma: a report from the children's oncology group. J Clin Oncol. 2002;20:2672–2679.
- Issels RD, Lindner LH, Verweij J, et al. Neo-adjuvant chemotherapy alone or with regional hyperthermia for localised high-risk soft-tissue sarcoma: a randomised phase 3 multicentre study. Lancet Oncol. 2010;11:561–570.
- Issels RD, Lindner LH, Verweij J, et al. Effect of neoadjuvant chemotherapy plus regional hyperthermia on long-term outcomes among patients with localized high-risk soft tissue sarcoma: the EORTC 62961-ESHO 95 randomized clinical trial. JAMA Oncol. 2018;4:483–492.
- Iannello A, Thompson TW, Ardolino M, et al. Immunosurveillance and immunotherapy of tumors by innate immune cells. Curr Opin Immunol. 2016;38:52–58.
- Frey B, Weiss EM, Rubner Y, et al. Old and new facts about hyperthermia-induced modulations of the immune system. Int J Hypertherm. 2012;28:528–542.
- Chan CJ, Smyth MJ, Martinet L. Molecular mechanisms of natural killer cell activation in response to cellular stress. Cell Death Differ. 2014;21:5–14.
- Becknell B, Caligiuri MA. Natural killer cells in innate immunity and cancer. J Immunother. 2008;31:685–692.
- Fiegl M, Schlemmer M, Wendtner CM, et al. Ifosfamide, carboplatin and etoposide (ICE) as second-line regimen alone and in combination with regional hyperthermia is active in chemo-pre-treated advanced soft tissue sarcoma of adults. Int J Hypertherm. 2004;20:661–670.
- Bruggmoser G, Bauchowitz S, Canters R, et al. Guideline for the clinical application, documentation and analysis of clinical studies for regional deep hyperthermia: quality management in regional deep hyperthermia. Strahlenther Onkol. 2012;188:198–211.
- Dewhirst MW, Kirsch D. Technological advances, biologic rationales, and the associated success of chemotherapy with hyperthermia in improved outcomes in patients with sarcoma. JAMA Oncol. 2018;4:493–494.
- Killock D. Sarcoma: local hyperthermia improves survival. Nat Rev Clin Oncol. 2018;15:266
- Wang H, Zhang L, Shi Y, et al. Abscopal antitumor immune effects of magnet-mediated hyperthermia at a high therapeutic temperature on Walker-256 carcinosarcomas in rats. Oncol Lett. 2014;7:764–770.
- Formenti SC, Demaria S. Combining radiotherapy and cancer immunotherapy: a paradigm shift. J Natl Cancer Inst. 2013;105:256–265.
- Schlemmer M, Wendtner CM, Falk M, et al. Efficacy of consolidation high-dose chemotherapy with ifosfamide, carboplatin and etoposide (HD-ICE) followed by autologous peripheral blood stem cell rescue in chemosensitive patients with metastatic soft tissue sarcomas. Oncology. 2006;71:32–39.
- Galluzzi L, Senovilla L, Zitvogel L, et al. The secret ally: immunostimulation by anticancer drugs. Nat Rev Drug Discov. 2012;11:215–233.
- Ghiringhelli F, Menard C, Puig PE, et al. Metronomic cyclophosphamide regimen selectively depletes CD4 + CD25+ regulatory T cells and restores T and NK effector functions in end stage cancer patients. Cancer Immunol Immunother. 2007;56:641–648.
- Schmiedel D, Mandelboim O. NKG2D ligands-critical targets for cancer immune escape and therapy. Front Immunol. 2018;9:2040.
- Elsner L, Muppala V, Gehrmann M, et al. The heat shock protein HSP70 promotes mouse NK cell activity against tumors that express inducible NKG2D ligands. J Immunol. 2007;179:5523–5533.
- Venkataraman GM, Suciu D, Groh V, et al. Promoter region architecture and transcriptional regulation of the genes for the MHC class I-related chain A and B ligands of NKG2D. J Immunol. 2007;178:961–969.
- Multhoff G, Botzler C, Jennen L, et al. Heat shock protein 72 on tumor cells: a recognition structure for natural killer cells. J Immunol. 1997;158:4341–4350.
- Lang P, Greil J, Bader P, et al. Long-term outcome after haploidentical stem cell transplantation in children. Blood Cells Mol Dis. 2004;33:281–287.
- Mancusi A, Ruggeri L, Urbani E, et al. Haploidentical hematopoietic transplantation from KIR ligand-mismatched donors with activating KIRs reduces nonrelapse mortality. Blood. 2015;125:3173–3182.
- Perez-Martinez A, Leung W, Munoz E, et al. KIR-HLA receptor-ligand mismatch associated with a graft-versus-tumor effect in haploidentical stem cell transplantation for pediatric metastatic solid tumors. Pediatr Blood Cancer. 2009;53:120–124.
- Schober SJ, von Luettichau I, Wawer A, et al. Donor lymphocyte infusions in adolescents and young adults for control of advanced pediatric sarcoma. Oncotarget 2018;9:22741–22748.
- Bucklein V, Adunka T, Mendler AN, et al. Progressive natural killer cell dysfunction associated with alterations in subset proportions and receptor expression in soft-tissue sarcoma patients. Oncoimmunology 2016;5:e1178421.
- Bahrami A, Gown AM, Baird GS, et al. Aberrant expression of epithelial and neuroendocrine markers in alveolar rhabdomyosarcoma: a potentially serious diagnostic pitfall. Mod Pathol. 2008;21:795–806.
- Taouk G, Hussein O, Zekak M, et al. CD56 expression in breast cancer induces sensitivity to natural killer-mediated cytotoxicity by enhancing the formation of cytotoxic immunological synapse. Sci Rep. 2019;9:8756.
- Groh V, Wu J, Yee C, et al. Tumour-derived soluble MIC ligands impair expression of NKG2D and T-cell activation. Nature. 2002;419:734–738.
- Coudert JD, Scarpellino L, Gros F, et al. Sustained NKG2D engagement induces cross-tolerance of multiple distinct NK cell activation pathways. Blood. 2008;111:3571–3578.
- Nikolich-Zugich J. Ageing and life-long maintenance of T-cell subsets in the face of latent persistent infections. Nat Rev Immunol. 2008;8:512–522.
- Multhoff G, Meier T, Botzler C, et al. Differential effects of ifosfamide on the capacity of cytotoxic T lymphocytes and natural killer cells to lyse their target cells correlate with intracellular glutathione levels. Blood. 1995;85:2124–2131.
- Bachireddy P, Hainz U, Rooney M, et al. Reversal of in situ T-cell exhaustion during effective human antileukemia responses to donor lymphocyte infusion. Blood. 2014;123:1412–1421.
- Krieg C, Nowicka M, Guglietta S, et al. High-dimensional single-cell analysis predicts response to anti-PD-1 immunotherapy. Nat Med. 2018;24:144–153.
- Baumeister SH, Freeman GJ, Dranoff G, et al. Coinhibitory Pathways in Immunotherapy for cancer. Annu Rev Immunol. 2016;34:539–573.
- Joyce JA, Fearon DT. T cell exclusion, immune privilege, and the tumor microenvironment. Science. 2015;348:74–80.
- Available from: https://clinicaltrials.gov/ct2/show/NCT02359474
- Wagner JA, Rosario M, Romee R, et al. CD56bright NK cells exhibit potent antitumor responses following IL-15 priming. J Clin Invest. 2017;127:4042–4058.
- Noessner E, Gastpar R, Milani V, et al. Tumor-derived heat shock protein 70 peptide complexes are cross-presented by human dendritic cells. J Immunol. 2002;169:5424–5432.
- Chen T, Guo J, Han C, et al. Heat shock protein 70, released from heat-stressed tumor cells, initiates antitumor immunity by inducing tumor cell chemokine production and activating dendritic cells via TLR4 pathway. J Immunol. 2009;182:1449–1459.