
 ?Mathematical formulae have been encoded as MathML and are displayed in this HTML version using MathJax in order to improve their display. Uncheck the box to turn MathJax off. This feature requires Javascript. Click on a formula to zoom.
Abstract
Purpose
Environmental hyperthermia exerts detrimental effect on attention performance that might increase the probability of accidents for high risk occupation. Previously, we reported aberrant activations and selective attention deficits under task performing during hyperthermia. However, whether resting-state baseline during hyperthermia would contribute to the reported selective attention deficits remains unclear.
Materials and methods
Here, we investigated the resting-state activity within two attention subsystems named dorsal attention network (DAN) and ventral attention network (VAN) using the conjoint analysis of functional connectivity (FC) and regional cerebral blood flow (CBF). Blood oxygenation level dependent (BOLD) and 3 D arterial spin labeling data were obtained from 25 healthy male participants under two simulated thermal conditions: normothermic (25 °C for 1 h) and hyperthermic condition (50 °C for 1 h).
Results
Paired comparisons on the FC and CBF showed decreased activity in the bilateral frontal eye field (FEF) and intraparietal sulcus (IPS) in the DAN but increased activity in the ventral frontal cortex (VFC) in the VAN. The CBF-FC correlation analysis further confirmed decreased CBF-FC coupling in the bilateral FEF in the DAN and increased coupling in the VFC in the VAN. Additionally, the left IPS and FEF in the DAN showed altered CBF per unit functional connectivity in the CBF/FC ratio analysis. Multiple regression analysis revealed that the selectively altered performances were predicted by alterations of the multiple metrics within the DAN and VAN.
Conclusions
These findings suggested that altered resting-state brain activity within the attention networks might provide potential neural basis of the selective deficits for different cognitive-demand attention tasks under hyperthermia.
Introduction
Attention is an important cognitive function which enables our brain to react quickly to objective information and subjective consciousness [Citation1]. In order to maximize the efficiency of attention resources, more salient information should be preferentially processed according to the priority of external and internal events [Citation2,Citation3]. Attention network responds to those events through two subsystems named dorsal attention network (DAN) and ventral attention network (VAN). The DAN reflects top-down attention modulation and is controlled by cognitive factors, such as subjective expectation and goals. The VAN reflects bottom-up stimulus-driven attention corresponding to the sensory stimulation [Citation4–6]. The attention network is always detecting and processing external environmental events, which, in turn, could also reshape the attention activity of human brain. Previous findings showed that the activity of attention network varies across time, task and cognitive states [Citation7–9], subsequently resulting in varied attention performance, with an emerging picture of the attention as a dynamic system that flexibly adapts to the changing internal and external environment. However, it remains unclear how the attention varies with our daily living environment, such as the temperature of the environment.
Environmental hyperthermia is known as a limiting factor for physiological and cognitive performance in occupational occasions. Previous behavioral studies showed decreased vigilance during hyperthermia. Increased body temperature, even mild warming in the skin, could affect the brain arousal regulation and vigilance task performance [Citation10–12]. Hyperthermia exerts its effect on human behavioral performance by draining attention resources [Citation13]. It can enhance mental fatigue and inhibit the regional cerebral blood flow (CBF) compensation in dorsolateral prefrontal cortex while performing a sustained attention task which required constant attention focus [Citation13,Citation14]. This would increase the probability of accidents for high risk occupation such as firefighters. However, the brain activity underlying attention performance during hyperthermia has not been well illustrated. Recently, behavioral studies using visuospatial attention network test revealed selective attention deficits, specifically, impaired efficiency of resolving conflict of visual target but preserved alerting and orienting performance to salient and unattended stimulus [Citation15]. Liu [Citation16] found that aberrant brain activations in attention-related regions such as superior frontal gyrus, inferior parietal lobule, dorsolateral prefrontal cortex (DLPFC) were associated with specific attention performances. However, impaired attention performance may not be only due to changes in task-related brain activation during task performing, as previously reported brain baselines may be affected by hyperthermia, such as increased brain fatigue, even if cognitive tasks were not performed [Citation17,Citation18]. There was growing evidence showing that brain activity during resting-state could predict the performance in attention task [Citation7,Citation19–21]. However, whether resting-state baseline within attention networks during hyperthermia would contribute to the reported selective attention deficits remains to be elucidated.
In current study, we explored the effects of environmental hyperthermia on the resting-state functional connectivity (FC) pattern within the attention network using group independent component analysis (ICA). According to neural coupling theory, stronger functional connected brain regions tend to show higher spontaneous activity with larger metabolic demand, resulting in higher blood flow [Citation22,Citation23]. We also investigated cerebral blood flow (CBF), CBF-FC correlation and CBF/FC ratio within attention network to characterize the coupling between the vascular response and neural activity. To further identify the prediction of the resting-state baseline on attention performance, we performed multiple regression analysis between neuroimaging data and behavioral attention performance. We hypothesized that human brain could reorganize the resting-state activity within the attention networks to respond to systematic changes of environmental hyperthermia, and the reorganized resting-state activity could contribute to the previously reported selective attention deficits.
Materials and methods
Participants recruitment and experiment protocol
Participants: The data of resting-state BOLD-fMRI were collected together with the data of 3 D arterial spin labeling (ASL) in our previous study [Citation24]. Twenty healthy young male students (23.4 ± 1.8 years, aging from 21 to 26 years) were recruited. These participants had no history of any brain injury, psychiatric disorders and had written the informed consents. The experiment protocol in accordance with the Declaration of Helsinki was approved by the IRB of Third Military Medical University. In order to improve the small size of previous study, we recruited another 10 students with similar demographic characteristics into the current study. The experimental process remains the same. As a result, a total of 30 participants underwent the study.
Experiment protocol: The effects of passive hyperthermia on human cognitive and physiological performances had been investigated in many previous studies [Citation25–31]. However, there has been no unified protocol for the study of human physiological and psychological alterations in high temperature environment. Therefore, the experiment procedure used in this study, as well as our other studies [Citation14,Citation16,Citation24,Citation32,Citation33], was designed according to the protocols from the previous studies [Citation25–31], especially, those studies on brain cognition during hyperthermia [Citation30,Citation31,Citation34]. The experiment was performed 5:00 p.m.∼8:00 p.m. Each participant underwent the experiment at the same time of day for each thermal condition. Since the time of the experiment is closer to the dinner time, all the participants were provided with a standard dinner at 4:30 p.m. in case hunger in the experiment caused possible changes in brain activity. After dinner, the participants can rest until 5:30, during which time they were told the precautions that could result in differences of brain activity in the experiment. At 5:30 p.m., the experiment began.
All the participants underwent two thermal conditions in a counter-balanced order with a seven-day interval in an environmental chamber: a hyperthermia condition (HT, with heat exposure to 50 °C and 60% relative humidity for 40 min) and a normothermic condition (NT, with heat exposure to 25 °C and 60% relative humidity for 40 min). After heat exposure in the chamber, the participants were asked to wear a thermal-lab suit which covers the whole body. Then they were taken to the MRI room. After they lay down, the pipe in the suit was connected to a warm water container in which the temperature of water was designated at 50 °C for HT and 25 °C for NT. The scanning took about 20 min. During the resting-state scanning, all participants were instructed to relax and keep eyes closed without thinking of anything in particular or falling asleep.
Physiological parameters measuring: Using the same approach as our previous studies [Citation14,Citation24,Citation32], in the environmental chamber we measured the physiological parameters intermittently once every 5 min using a portable multi-parameter monitor (PM-9000, Mindray Co., Ltd), including rectal temperature, heart rate, respiration rate and blood pressure in this study. Due to unavailability of the monitor equipment in the MRI room, physiological parameters, including rectal temperature, blood pressure, were not measured during scanning. Heart rate and respiration rate were still included in the measurement using a built-in ECG leads and breathing belt of the MRI scanner.
Resting-state functional connectivity within attention network
The resting-state BOLD-fMRI data were collected using a GE MR750 3.0 T scanner (General Electric, Milwaukee, WI). The parameters of functional images were set as follows: TR = 2000 ms, TE = 30 ms, flip angle = 90°, number of slices = 33, matrix = 64 × 64, field of view = 24 × 24 cm2 and thickness/gap = 4/0 mm, lasting 6 min 40 s, and 200 functional volumes were obtained. And high resolution structural T1-weighted images were collected as follows: 132 slices, TR = 8.2 ms, TE = 3.2 ms, slice thickness = 1.0 mm, FOV = 24 × 24 cm2 and flip angle =12°.
The data preprocessing was performed by using the Data Processing Assistant for Resting-State fMRI (DPARSF v4.4, http://rfmri.org/DPARSF) [Citation35] and Resting-State fMRI Data Analysis Toolkit v1.8 (REST, http://www.restfmri.net/) [Citation36]. The functional raw images were preprocessed in series of steps, including format conversion, slice timing, realign estimation, spatially coregistration to structural images, normalization into the standard Montreal Neurological Institute space, resampling into a 3 mm × 3 mm × 3 mm voxel size and smoothing with a 6 mm full-width-at-half maximum Gaussian kernel. Then band filtering (0.01–0.1 Hz) and linear detrend were performed. Several sources of spurious variance including signal from white matter, cerebrospinal fluid and head motion, as well as global mean signal were removed via linear regression. To minimum the influences of physiological factors on the signal, we also regressed out the physiological factors including rectal temperature, heart rate and respiration rate. Of note, we used a volume censoring technique (‘scrubbing’) [Citation37] to eliminate the potential impact of sudden motions or moderate motions on the functional connectivity. After preprocessing, data from 5 participants in the previous pool of 20 were discarded due to discomfort report or under the exclusion criteria with displacement greater than 1.5 mm or rotation greater than 1.5°. The data of totally 25 participants (the remaining 15 participants of previously recruited [Citation24] and the newly recruited 10 participants) were involved into following analysis.
Learning that functional organizations of human attention are still present without external events [Citation5], we used group ICA to study the functional connection of the resting-state attention network in this study. The group ICA was performed by using the fMRI Toolbox Gift (http://icatb.sourceforge.net/). This involves two rounds of principal component analysis of data dimension reduction, ICA separation and back reconstruction. The imaging data of both conditions were all loaded into the toolbox for these processing steps. For the extraction of the DAN/VAN in one component as much as possible, we chose to export 40 ICs (1/5 the number of time points) based on the empirical index in previous studies [Citation38–40], instead of automatic estimation in selecting the optimal number of independent components (ICs). The ICA maps were extracted based on imaging data during both conditions, rather than separately for each condition. After separation, the DAN and VAN templates were used to select the ‘best fit’ component based on a set of spherical areas with a radius of 5 mm specified by Fox, Corbetta [Citation5], specifically, including the right frontal eye field (FEF) [24, −13, 51] and right intraparietal sulcus (IPS) [27, −58, 49], left FEF [−25, −12, 55] and left IPS [−22, −68, 46], right temporal parietal junction (TPJ) [53, −48, 20] and right ventral frontal cortex (VFC) [1, 18, 37] (Talairach coordinates). Detailed coordination can be seen in additional materials from Fox, Corbetta [Citation5] (http://www.pnas.org/content/103/26/10046/suppl/DC1). We used a template-matching procedure to subtract the average z score of voxels falling within the template minus that outside the template and selecting the components in which the differences (goodness-of-fit) were the greatest, designated as DAN and VAN for each group. The z transformed functional connectivity maps during each condition were entered into one sample t test to obtain significantly connected DAN and VAN. The voxel level threshold was set using false discovery rate correction (FDR) with q = 0.05. To further eliminate scattered false positive voxels, the cluster size threshold (109 voxels for DAN, and 91 voxels for VAN) was determined by 5000 times Monte Carlo simulations with the program 3dClustSim in AFNI (https://afni.nimh.nih.gov/pub/dist/doc/program_help/3dClustSim.html). The group-averaged DAN and VAN maps were saved as masks for the next analysis. Between-condition differences were obtained using paired t test on the z transformed functional connectivity. The voxel threshold was set using FDR correction with q = 0.05, and the cluster size thresholds with 73 voxels for DAN and 51 voxels for VAN were determined by Monte Carlo simulations using the 3dClustSim.
CBF-FC correlation and CBF/FC ratio analysis
The CBF images were acquired with a 3 D pseudo-continuous ASL sequence with the parameters as follows: TR = 4632 ms, TE = 10.5 ms, slice thickness = 4 mm, field of view = 24 × 24 cm2, post-labeling delay = 1525 ms, and each spiral arm included 512 sampling points in k-space and a total of 8 arms were acquired. The CBF images underwent series of preprocessing steps including normalization into the standard Montreal Neurological Institute space, resampling into a 3 mm × 3 mm × 3 mm voxel size and smoothing with a 6 mm full-width-at-half maximum Gaussian kernel, removing signal of white matter and cerebrospinal fluid. The preprocessed CBF data were involved into paired t test within the DAN and VAN masks defined above (FDR correction on the voxel level with q = 0.05, and cluster size larger than 89 voxels for DAN and 82 voxels for VAN determined by Monte Carlo simulations using the 3dClustSim).
To calculate the CBF-FC correlation, we extracted the CBF and FC values of each voxel within the DAN and VAN for each subject. To improve normality, before the extraction, both CBF and FC maps were normalized into z maps by substracting the mean values and dividing by the standard deviation (SD) of the global values within the DAN and VAN. This helps to normalize the CBF and FC to the same order of magnitude, and they could be averaged and compared across participants [Citation41]. We performed CBF-FC correlation analysis in two ways: a ROI-wise manner and a voxel-wise manner.
In the ROI-wise manner, we performed Pearson correlation between the CBF and FC values within a ROI. The ROI was defined by a cluster with significant differences in the CBF and FC group-comparisons. In this study, we obtained six ROIs by integrating the brain clusters with significant differences in the CBF and FC group-comparisons above as ROIs (). Pearson correlation analysis was performed between the CBF and FC values across the voxels within each ROI, then a correlation r value was generated in each ROI for each participant. And we can compare the r values of the participants between both thermal conditions using a paired t-test.
Considering that calculation of CBF-FC correlation in this manner might decrease the specificity of the CBF-FC correlation within the ROI, we further performed Pearson correlation analysis on the CBF and FC values of each voxel across the participants in a voxel by voxel manner. Therefore, a correlation r value was generated across the participants for each thermal condition, and a correlation r image would be generated by combining the r value of all the voxels. From the correlation r images of both thermal conditions, the spatial distribution and number of the survived voxels with significant CBF-FC correlation were obtained (p < 0.01 in voxel level, and cluster size larger than 42 voxels for DAN and 25 voxels for VAN determined by Monte Carlo simulations using the 3dClustSim).
Besides the CBF-FC correlation, we further performed the conjoint analysis using CBF/FC ratio which could facilitate revealing the relationship between neural activity and blood supply [Citation41]. The metric CBF/FC ratio refers to the amount of blood supply per unit of functional connectivity. Original CBF and FC values without z-transformation were used to calculate the CBF/FC ratio. Between-condition differences were tested using a paired t test (FDR correction on the voxel level with q = 0.05, and cluster size larger than 57 voxels for DAN and 64 voxels for VAN determined by Monte Carlo simulations using the 3dClustSim).
Attention network test and neurobehavioral correlation analysis
To further identify the potential contribution of the resting-state attention activity to previously reported attention performance, we further asked all the participants to perform an attention network test (ANT) after fMRI scanning. In the modified ANT task proposed by Fan [Citation42], three cue conditions (center cue, spatial cue and no cue) and two target types (congruent and incongruent) were presented to test the performance of alerting, orienting and executive control to visual stimulus. Once each trial began, the participant needed to stare at a cross in the screen center. Then one of the three cue conditions would occur with duration of 200 ms. After an interval of 300–11,800 ms (including three 300 ms intervals, as well as 550, 800, 1050, 1550, 2300, 3300, 4800, 6550, and 11,800 ms, approximated an exponential distribution with a mean interval of 2800 ms), the target would be presented 1.06° above or below the cross. The target was designed by a row of five arrows. The participants needed to press the corresponding button for the direction of the middle arrow as quickly as they can. The target would disappear once the participants responded or after 2000 ms with no response. The duration between the onset of one target and next trial varied systematically from 2500 to 13,500 ms (a set of 12 discrete times, including 2500, 3000, 3250, 3500, 4000, 4250, 4750, 5000, 5250, 7500, 9500, and 13,500 ms, with a mean of 5500 ms). The whole task consisted of thirty-six trials which divided into six runs. The three conditions and two target types were allocated into each run in a counterbalanced manner. The efficiency of alerting, orienting and executive control was estimated by the reaction time (RT) across different cue and target as follows:
The detailed information about the task paradigm can be seen in our previous studies [Citation15,Citation16] or study by Fan, McCandliss [Citation42].
In order to further elucidate the contributions of location-specific neuroimaging alterations to attention behavior, we performed multivariate linear regression analyses of functional data in different selected ROIs within the attention network to behavioral performances. We extracted the neuroimaging data using anatomical ROIs rather than functional group-differed clusters, which were more likely to make the mistake of ‘voodoo correlation’. Totally six spherical anatomical ROIs (r = 10 mm) were selected based on the study by Fox, Corbetta [Citation5]. Detailed information about the coordinates can be seen in the ICA analysis above. The neuroimaging metrics, including FC, CBF, CBF/FC ratio (since the CBF-FC correlation was calculated on the group level rather than individual level, it was not included here), within these ROIs were extracted, respectively. And all the metrics of the ROIs were further involved into the multivariate linear regression analyses together. Regressors were the extracted neuroimaging metrics from the selected six ROIs. And dependent variables were the reaction time of alerting, orienting and executive control, which were included into the regression analysis, respectively. In this way, we could elucidate the contributions of the specific neuroimaging parameters to each aspect of the attention behavior.
Results
Physiological changes
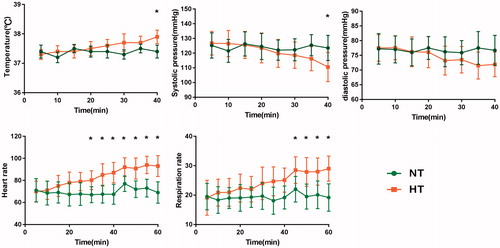
Consistent with our previous studies [Citation14,Citation32], hyperthermia induced significantly physiological changes over exposure time. All the parameters in NT condition showed normal and stable throughout the measurement. The parameters in HT condition progressively changed with the duration of heat exposure, as depicted in the . Specifically, the rectal temperature, heart rate and respiration rate were progressively elevated during the stage of heating. While the mean blood pressure significantly decreased progressively. Considering that the physiological changes during hyperthermia were previously reported in our studies [Citation14,Citation24,Citation32], we will not go into details in the results here.
Figure 1. Physiological parameters measuring including rectal temperature, systolic pressure, diastolic pressure, heart rate, and respiration rate in the environmental chamber and MRI scanning.
Resting-state functional connectivity pattern within DAN and VAN
Within-group t test showed typical and visually similar DANs and VANs under both thermal conditions (). Specifically, bilateral IPS and FEF areas were significantly involved within the DANs, right lateralized TPJ and VFC areas were significantly correlated within the VANs. Between-condition comparisons showed different hyperthermia-altered patterns in both networks (). In the DAN, functional connectivity was significantly decreased in IPS and FEF areas, especially, in the left hemisphere (). On the contrary, hyperthermia induced increased functional connectivity in the right VFC of the VAN ().
Figure 2. Spatial FC patterns within both attention networks. (a-b) Within-group t maps of the DAN under HT and NT conditions. (c-d) Within-group t maps of the VAN under HT and NT conditions.
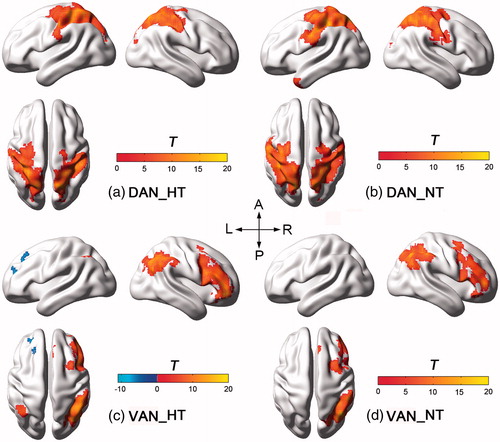
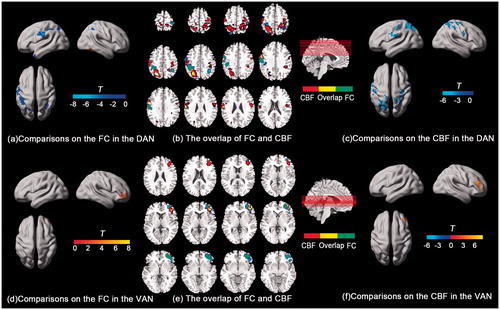
Figure 3. Between-condition comparisons on the FC and CBF in the DAN and VAN. The t map of the FC (a) and CBF (c) in the DAN, and the overlapped regions between them (b). The t map of the FC (d) and CBF (f) in the VAN, and the overlapped regions between them (e).
Resting-state CBF alterations within both networks under different thermal conditions
In this study, the results of CBF were consistent with our previous study [Citation32], and more granular results were uncovered under correction within smaller attention network rather than in the whole brain previously (). Paired t test within the DAN on CBF images showed that an overall decreased CBF pattern during HT vs. NT comparison, located in the bilateral IPS and FEF areas (). In contrast, the CBF in the VAN showed an elevated pattern during HT condition, specifically located in the right VFC (). Of note, significantly CBF-differed regions were partially overlapped with the FC changes above, specifically, the left IPS area and precentral gyrus in the DAN (), and the right VFC area in the VAN ().
Resting-state CBF- FC correlation and CBF/FC ratio within both networks
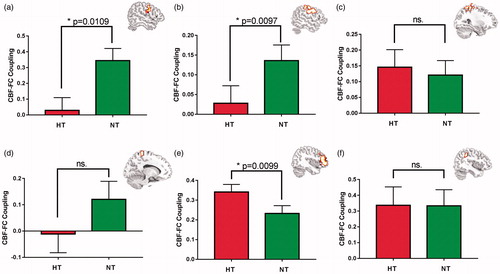
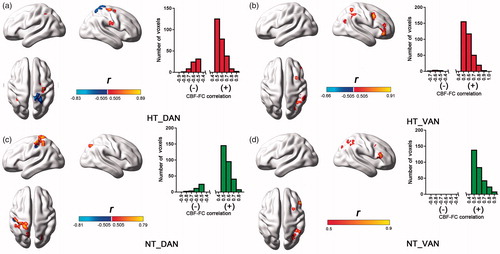
The CBF-FC correlation analysis was performed in a ROI-wise manner by using integrated group-differed clusters in FC and CBF comparisons. In total, four DAN ROIs, including right and left precentral gyrus and superior/middle frontal gyrus around the FEF area (), and right and left postcentral gyrus, inferior/superior parietal lobule around the IPS area () were selected. And two VAN ROIs, including right ventral middle and inferior frontal gyrus and right inferior parietal lobule and supramarginal gyrus () were selected for comparison. The CBF-FC correlation comparisons revealed significant decreased CBF-FC correlation in the bilateral FEF areas () and preserved CBF-FC correlation in the IPS areas () in the DAN during HT vs. NT comparison. Instead, the CBF-FC correlation in the VAN showed an increased pattern in the VFC area () and maintained in the TPJ area () during HT condition. In short, the CBF-FC correlation showed opposite changing trend in the DAN and VAN during HT condition.
Figure 4. Between-condition comparisons on the CBF-FC correlations within the selected ROIs. (a) Decreased CBF-FC correlation in the right FEF area in the DAN. (b) Decreased CBF-FC correlation in the left FEF area in the DAN.(c) Maintained CBF-FC correlation in the left postcentral gyrus, and superior/inferior parietal lobule in the DAN.(d) Maintained CBF-FC correlation in the right postcentral gyrus in the DAN. (e) Increased CBF-FC correlation in the right VFC area in the VAN. (d) Maintained CBF-FC correlation in the right TPJ area in the VAN.
Unlike the CBF-FC correlation analysis in the ROI-wise manner, analysis in the voxel-wise manner could reveal the distribution and the number of voxels with significant CBF-FC coupling in the DAN and VAN (). The CBF-FC correlation showed two completely different patterns in the DAN between both thermal conditions. During HT condition, significantly negative CBF-FC correlation could be seen in the right postcentral gyrus and superior parietal lobule. Besides, only a small amount of voxel showed significantly positive CBF-FC correlation in right precentral gyrus. However, in the NT condition, the CBF-FC correlation presented positive pattern and mainly located in the left parietal lobe, including postcentral gyrus, superior parietal lobule and inferior parietal lobule. Different from the DAN, the VAN showed similar CBF-FC correlation between both thermal conditions, specifically, positive correlation located in right VFC and TPJ areas.
Figure 5. Spatial distributions and the number of voxels with significant CBF-FC correlations (p < 0.01, two-tailed). The left histograms represented the number of voxels with negative and positive correlations. (a) Significant negative CBF-FC correlation in the right postcentral gyrus and superior parietal lobule, positive one in right precentral gyrus, within the DAN under HT condition. (c) Positive CBF-FC correlation in the left parietal lobe, including postcentral gyrus, superior parietal lobule and inferior parietal lobule, within the DAN under NT condition. (b)/(d) Positive correlation located in right VFC and TPJ areas within the VAN under HT and NT conditions.
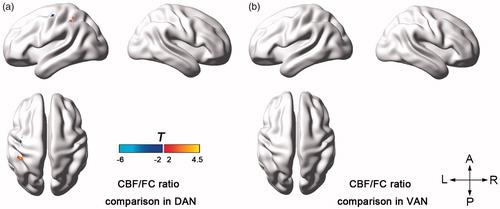
Group comparison on the CBF/FC ratio also showed diverse patterns between both networks (). During the HT condition for the DAN, increased CBF/FC ratio was found in the left inferior parietal lobule around the IPS area, but decreased one was found in the precentral and postcentral gyrus. In the VAN, hyperthermia did not cause significant CBF/ratio changes.
Figure 6. Between-condition t maps of the CBF/FC ratio within the DAN (a) and VAN (b).
Neurobehavioral correlation analysis
In current study, we replicated our previous findings of selective attention deficits with impaired executive control performance (t(24)=4.001, p = 0.001) but preserved alerting (t(24)=1.335, p = 0.194) and orienting (t(24)=1.917, p = 0.067) performances under hyperthermia [Citation15,Citation16]. The multivariate regression analyses revealed that location-specific functional activity contributed to the three attentional performances. Specifically, longer executive control reaction time was mainly predicted by lower functional activity (including FC, CBF, CBF/FC ratio) in bilateral FEF and IPS, and longer alerting reaction time was significantly contributed by increased FC and CBF/FC ratio in the right VFC and lowered CBF in the right FEF and TPJ. The orienting seemed to be poorly related to functional activity but FC in the left IPS. Detailed information can be seen in the .
Table 1. Multivariate linear regression analyses of contributions of neuroimaging metrics in six ROIs to attention performances.
Discussion
The present study revealed previously unrecognized resting-state functional activity within attention network during hyperthermic condition using the conjoint analysis of FC and regional CBF. The multiple metrics (FC, CBF, CBF-FC correlation and CBF/FC ratio) demonstrated reorganized resting-state activity within the attention networks in response to environmental hyperthermia with decreased activity in the DAN but increased one in the VAN. Multivariate regression analysis showed that location-specific resting-state multiple metrics contributed to the selectively-altered attention performances. The present study indicated that previously reported behavioral selective attention deficits might be partly due to the abnormality of the resting-state baseline during hyperthermia.
Previous studies have provided evidence for two separated frontoparietal networks which carried out different attention functions [Citation5,Citation6]. The DAN reflects a goal-directed voluntary orienting after advance cue information is typically provided, as well as executive control for conflict processing for target and goal [Citation5]. The VAN usually shows increased activity upon detecting salient target which appears unexpectedly stimulus-driven [Citation5]. The present study investigated resting-state activity within both attention networks using FC and CBF, respectively. Both metrics showed similar changing patterns within the networks during hyperthermia. The DAN showed decreased FC and CBF during hyperthermia, while the VAN showed increased ones. This finding indicated that deteriorated DAN showed not only within-network disconnection but also low metabolic activity. And the neurobehavioral regression analysis supported that hyperthermia-induced low activity in the DAN can lead to longer reaction time in executive control. Previous behavioral studies demonstrated that hyperthermia stress exerts its detrimental effect on performance by competing for and draining attentional resources, thereby leaving less resource to maintain attention task [Citation13,Citation43]. Since then, Hocking [Citation44] further confirmed behavioral impaired vigilance and evidence with altered brain electrical activity in occipito-parietal regions. Recently our previous attention task-related fMRI study showed enhanced activation in DLPFC and inferior parietal lobule which was correlated with aberrant executive control performance [Citation16]. Surprisingly, the previous study showed increased task-related brain activity in response to hyperthermia [Citation16], which was not consistent with the current decreased resting-state brain activity. This might indicate that the inhibition of hyperthermia on attention network was due to the underlying decrease of resting state activity in the human brain. To meet the demand for normal attention performance, the attention network needs to reorganize its function by brain activity enhancement during task performing in response to the decreased underlying resting-state activity. Deteriorated resting-state activity in attention network may determine the subsequent task performance. Supporting this, Lim, Wu [Citation21] also found that resting-state CBF in right middle frontal gyrus before task performing was predictive of individual performance in a following sustained attention task. The exact relationship between resting-state and task-related activity still awaits further study.
Of note, unlike the DAN, the VAN showed increased FC and CBF in the face of hyperthermia. DAN and VAN are two collaborative and interactive networks to complete a normal attention task [Citation45]. Once the DAN was suppressed by hyperthermia, the compensatory mechanism can increase activity in VAN and this might be the neurological basis for partially preserved behavioral attention performance. The behavioral results in the current and previous studies showed longer reaction time of executive control, but no significant influences on alerting and orienting. This may be due to the brain having a corresponding compensation to stimulation-related VAN. Previously, Maximal Adaptability Model theory assumed that human attention performances were progressively drained as the level of hyperthermia stress increases [Citation46]. Initially, the remaining attention resources were used effectively by individuals through adaptive strategies, such as attention focus, until the compensatory strategy fails. Heat stress forced individuals to allocate attention resources to assess and respond to stimulus-related threats, thereby reducing the ability to process cognitive information related to tasks [Citation47]. This suggested that bottom-up attention tasks might be more susceptible to high temperature environments, while the task of low demand for cognition might not be easily affected. The redistributed resting-state activity within attention networks during hyperthermia found in the present study might provide potential neural basis of the priority adjustment for different cognitive-demand attention tasks.
In addition to FC and CBF separately analyzed, the CBF-FC correlation and CBF/FC which reflected neurovascular coupling were also investigated. Normally, regional CBF, as a metric of brain metabolism, is physiologically tightly-coupled with functional brain activity according to the neurovascular coupling hypothesis [Citation48]. The brain can modulate the FC and CBF accordingly in response to the tasks that will be faced. Tightly coupled CBF-FC relationship is preserved and does not depend on whether the brain is resting or performing an active task. In the current study, we found CBF-FC decoupling in the bilateral FEF in the DAN (specifically, decreased CBF-FC correlation in bilateral FEF and decreased CBF/FC ratio in left FEF) and CBF-FC excessive correlation in right VFC in the VAN. This result indicated that hyperthermia caused tightly coupled CBF-FC correlation to loosen up. A possible explanation might be hyperthermia-induced abnormal microvascular compliance which altered the demanded regional blood supply for brain activity. Hyperthermia-induced hyperventilation would increase the arterial carbon dioxide partial pressure which is an important sensitive factor for cerebral vascular compliance [Citation28,Citation29,Citation34]. In this case, blood perfusion to the brain would change, but neural activity does not change accordingly. Using ultrasound Doppler techniques, previous studies found that the compliance of major arteries in the brain increases at high temperatures, such as the middle cerebral artery, resulting in reduced blood velocity into the brain [Citation28,Citation49]. However, the microvascular response or regional cerebral metabolism to the hyperthermia might be complicated and lack of sufficient research. Nunneley [Citation50] identified location-specific regional cerebral metabolism under hyperthermia with increased one in hypothalamus, thalamus, corpus callosum, cingulate gyrus, and cerebellum, decreased one in caudate, putamen, insula, and posterior cingulum. In our results, the metric CBF/FC ratio could provide additional information for the relative changes between CBF and FC. Unlike the decreased FC and CBF, the CBF/FC ratio increased in the left inferior parietal lobule around the IPS area. We further extracted the ROI-wise CBF and FC in the left IPS. And relatively less CBF decrease but more FC decrease was found during hyperthermia. In this case, the CBF/FCS ratio may widen the differences during hyperthermia to identify abnormal areas that were hardly discovered using CBF or FCS analysis under the same statistical threshold. On the other hand, several regions with significantly differed CBF or FC showed no significant differences on the CBF/FC ratio, such as the right FEF/IPS in the DAN and the right VFC in the VAN. These findings indicated that the three metrics of CBF, FC and CBF/FC ratio can provide complementary information, and conjoint analysis is more conducive to revealing the functional changes during hyperthermia.
The present study has some limitation to be mentioned. First, whole body under hyperthermia would cause multiple systematic influences on human body, which potentially affect the fMRI signal, such as heart rate, respiration rate, cerebral blood flow, blood pressure, etc. These physiological changes were described in detail in our previous study [Citation32]. Although we controlled these factors through regression and band-pass filtering (0.01–0.1 Hz), it was difficult to completely eliminate the effects of these physiological variables on brain functional images (e.g. probable cerebral vascular compliance alteration mentioned above). Second, participants underwent heat exposure in two ways. Different heat transfer modes between the environmental chamber and a thermal-suit would result in different physiological parameter changes, as well as subjective thermosensation. Wearing a water-perfused suit in current study, as well as previous studies [Citation28,Citation29,Citation34], could not completely simulate the real hot environment. However, this method is irreplaceable in MRI scanning experiments. Therefore, we tried to shorten the time of wearing the suit by heat exposure in the environmental chamber before MRI scanning. Additionally, there is another issue about the setting of hyperthermia intensity in this study. Difference in the intensity of hyperthermia (combinations of temperature and exposure duration) would cause different types of cognitive abilities to decline [Citation43]. So far, there has been no unified protocol for the study of human brain cognition in high temperature environment, so the setting of hyperthermic intensity in this study, as well as our other studies [Citation24,Citation32], is set by reference to previous studies [Citation25,Citation27,Citation51]. Further studies on the brain activity during gradient hyperthermia could be more conducive to the interpretation of this problem.
In conclusion, the present study revealed previously unrecognized altered resting-state brain activity within the attention networks during hyperthermia with decreased activity in the DAN but increased one in the VAN. The location-specific altered resting-state multiple metrics contributed to the selectively-altered attention performances, indicating that previously reported behavioral attention deficits might be partly due to the abnormality of the resting-state baseline during hyperthermia. The reorganized attention activity might provide potential neural basis of the selective deficits for different cognitive-demand attention tasks during hyperthermia.
Disclosure statement
No potential conflict of interest was reported by the author(s).
Additional information
Funding
References
- Posner MI, Petersen SE. The attention system of the human brain. Annu Rev Neurosci. 1990;13(1):25–42.
- Posner MI, Snyder CR, Davidson BJ. Attention and the detection of signals. J Exp Psychol. 1980;109(2):160–174.
- Dosher BA, Lu ZL. Mechanisms of perceptual attention in precuing of location. Vision Res. 2000;40(10–12):1269–1292.
- Posner MI. Imaging attention networks. NeuroImage. 2012;61(2):450–456.
- Fox MD, Corbetta M, Snyder AZ, et al. Spontaneous neuronal activity distinguishes human dorsal and ventral attention systems. Proc Natl Acad Sci USA. 2006;103(26):10046–10051.
- Corbetta M, Shulman GL. Control of goal-directed and stimulus-driven attention in the brain. Nat Rev Neurosci. 2002;3(3):201–215.
- Fong AHC, Yoo K, Rosenberg MD, et al. Dynamic functional connectivity during task performance and rest predicts individual differences in attention across studies. NeuroImage. 2019;188:14–25.
- Weber R, Alicea B, Huskey R, et al. Network dynamics of attention during a naturalistic behavioral paradigm. Front Hum Neurosci. 2018;12:182.
- Salmela V, Salo E, Salmi J, et al. Spatiotemporal dynamics of attention networks revealed by representational similarity analysis of EEG and fMRI. Cereb Cortex. 2018;28(2):549–560.
- Romeijn N, Van Someren E. Correlated fluctuations of daytime skin temperature and vigilance. J Biol Rhythms. 2011;26(1):68–77.
- Ramautar JR, Romeijn N, Gomez-Herrero G, et al. Coupling of infraslow fluctuations in autonomic and central vigilance markers: skin temperature, EEG beta power and ERP P300 latency. Int J Psychophysiol. 2013;89(2):158–164.
- Raymann RJ, Van Someren EJ. Time-on-task impairment of psychomotor vigilance is affected by mild skin warming and changes with aging and insomnia. Sleep. 2007;30(1):96–103.
- Hancock PA. Sustained attention under thermal stress. Psychol Bull. 1986;99(2):263–281.
- Qian S, Li M, Li G, et al. Environmental heat stress enhances mental fatigue during sustained attention task performing: evidence from an ASL perfusion study. Behav Brain Res. 2015;280:6–15.
- Sun G, Yang X, Jiang QJ, et al. Hyperthermia impairs the executive function using the Attention Network Test. Int J Hyperthermia. 2012;28(7):621–626.
- Liu K, Sun G, Li B, et al. The impact of passive hyperthermia on human attention networks: an fMRI study. Behav Brain Res. 2013;243C:220–230.
- Nybo L. Hyperthermia and fatigue. J Appl Physiol. 2008;104(3):871–878.
- Nielsen B, Hyldig T, Bidstrup F, et al. Brain activity and fatigue during prolonged exercise in the heat. Pflugers Arch. 2001;442(1):41–48.
- Reineberg AE, Andrews-Hanna JR, Depue BE, et al. Resting-state networks predict individual differences in common and specific aspects of executive function. NeuroImage. 2015;104:69–78.
- Connolly J, McNulty JP, Boran L, et al. Identification of resting state networks involved in executive function. Brain Connect. 2016;6(5):365–374.
- Lim J, Wu WC, Wang J, et al. Imaging brain fatigue from sustained mental workload: an ASL perfusion study of the time-on-task effect. NeuroImage. 2010;49(4):3426–3435.
- Buxton RB, Frank LR. A model for the coupling between cerebral blood flow and oxygen metabolism during neural stimulation. J Cereb Blood Flow Metab. 1997;17(1):64–72.
- Liang X, Zou Q, He Y, et al. Coupling of functional connectivity and regional cerebral blood flow reveals a physiological basis for network hubs of the human brain. Proc Natl Acad Sci USA. 2013;110(5):1929–1934.
- Song X, Qian S, Liu K, et al. Resting-state BOLD oscillation frequency predicts vigilance task performance at both normal and high environmental temperatures. Brain Struct Funct. 2017;222(9):4065–4077.
- Brothers RM, Wingo JE, Hubing KA, et al. The effects of reduced end-tidal carbon dioxide tension on cerebral blood flow during heat stress. J Physiol. 2009;587(15):3921–3927.
- Crandall CG, Shibasaki M, Wilson TE. Insufficient cutaneous vasoconstriction leading up to and during syncopal symptoms in the heat stressed human. Am J Physiol Heart Circ Physiol. 2010;299(4):H1168–H73.
- Crandall CG, Wilson TE, Marving J, et al. Effects of passive heating on central blood volume and ventricular dimensions in humans. J Physiol (Lond). 2008;586(1):293–301.
- Fujii N, Ichinose M, Honda Y, et al. Changes in arterial blood pressure elicited by severe passive heating at rest is associated with hyperthermia-induced hyperventilation in humans. Eur J Appl Physiol. 2013;113(1):51–62.
- Ross EZ, Cotter JD, Wilson L, et al. Cerebrovascular and corticomotor function during progressive passive hyperthermia in humans. J Appl Physiol. 2012;112(5):748–758.
- Racinais S, Gaoua N, Grantham J. Hyperthermia impairs short-term memory and peripheral motor drive transmission. J Physiol. 2008;586(19):4751–4762.
- Gaoua N, Racinais S, Grantham J, et al. Alterations in cognitive performance during passive hyperthermia are task dependent. Int J Hyperthermia. 2011;27(1):1–9.
- Qian S, Jiang Q, Liu K, et al. Effects of short-term environmental hyperthermia on patterns of cerebral blood flow. Physiol Behav. 2014;128C:99–107.
- Sun G, Qian S, Jiang Q, et al. Hyperthermia-induced disruption of functional connectivity in the human brain network. PloS One. 2013;8(4):e61157.
- Nelson MD, Haykowsky MJ, Stickland MK, et al. Reductions in cerebral blood flow during passive heat stress in humans: partitioning the mechanisms. J Physiol. 2011;589(16):4053–4064.
- Chao-Gan Y, Yu-Feng Z. DPARSF: a MATLAB Toolbox for “Pipeline” data analysis of resting-state fMRI”. Front Syst Neurosci. 2010;4:13.
- Song XW, Dong ZY, Long XY, et al. REST: a toolkit for resting-state functional magnetic resonance imaging data processing. PLoS One. 2011;6(9):e25031.
- Power JD, Barnes KA, Snyder AZ, et al. Spurious but systematic correlations in functional connectivity MRI networks arise from subject motion. NeuroImage. 2012;59(3):2142–2154.
- Zhang Z, Zheng H, Liang K, et al. Functional degeneration in dorsal and ventral attention systems in amnestic mild cognitive impairment and Alzheimer’s disease: an fMRI study. Neurosci Lett. 2014;585C:160–165.
- Liao W, Mantini D, Zhang Z, et al. Evaluating the effective connectivity of resting state networks using conditional Granger causality. Biol Cybern. 2010;102(1):57–69.
- Zhang Z, Lu G, Zhong Y, et al. Impaired attention network in temporal lobe epilepsy: a resting FMRI study. Neurosci Lett. 2009;458(3):97–101.
- Zhu J, Zhuo C, Xu L, et al. Altered coupling between resting-state cerebral blood flow and functional connectivity in schizophrenia. Schizophr Bull. 2017;43(6):1363–1374.
- Fan J, McCandliss BD, Fossella J, et al. The activation of attentional networks. NeuroImage. 2005;26(2):471–479.
- Hancock PA, Vasmatzidis I. Effects of heat stress on cognitive performance: the current state of knowledge. Int J Hyperthermia. 2003;19(3):355–372.
- Hocking C, Silberstein RB, Lau WM, et al. Evaluation of cognitive performance in the heat by functional brain imaging and psychometric testing. Comp Biochem Physiol, Part A Mol Integr Physiol. 2001;128(4):719–734.
- Vossel S, Geng JJ, Fink GR. Dorsal and ventral attention systems: distinct neural circuits but collaborative roles. Neuroscientist. 2014;20(2):150–159.
- Hancock PA, Warm JS. A dynamic model of stress and sustained attention. Hum Factors. 1989;31(5):519–537.
- Hancock PA, Ross JM, Szalma JL. A meta-analysis of performance response under thermal stressors. Hum Factors. 2007;49(5):851–877.
- Kuschinsky W. Coupling of function, metabolism, and blood flow in the brain. 1991;14(3):163–168.
- Wilson TE, Cui J, Zhang R, et al. Heat stress reduces cerebral blood velocity and markedly impairs orthostatic tolerance in humans. Am J Physiol Regul Integr Comp Physiol. 2006;291(5):R1443–8.
- Nunneley SA, Martin CC, Slauson JW, et al. Changes in regional cerebral metabolism during systemic hyperthermia in humans. J Appl Physiol. 2002;92(2):846–851.
- Fujii N, Honda Y, Hayashi K, et al. Effects of chemoreflexes on hyperthermic hyperventilation and cerebral blood velocity in resting heated humans. Exp Physiol. 2008;93(8):994–1001.