
 ?Mathematical formulae have been encoded as MathML and are displayed in this HTML version using MathJax in order to improve their display. Uncheck the box to turn MathJax off. This feature requires Javascript. Click on a formula to zoom.
Abstract
Purpose
To develop and characterize a tissue-mimicking phantom that enables the direct comparison of magnetic resonance (MR) and ultrasound (US) imaging techniques useful for monitoring high-intensity focused ultrasound (HIFU) treatments. With no additions, gelatin phantoms produce little if any scattering required for US imaging. This study characterizes the MR and US image characteristics as a function of psyllium husk concentration, which was added to increase US scattering.
Methods
Gelatin phantoms were constructed with varying concentrations of psyllium husk. The effects of psyllium husk concentration on US B-mode and MR imaging were evaluated at nine different concentrations. T1, T2, and T2* MR maps were acquired. Acoustic properties (attenuation and speed of sound) were measured at frequencies of 0.6, 1.0, 1.8, and 3.0 MHz using a through-transmission technique. Phantom elastic properties were evaluated for both time and temperature dependence.
Results
Ultrasound image echogenicity increased with increasing psyllium husk concentration while quality of gradient-recalled echo MR images decreased with increasing concentration. For all phantoms, the measured speed of sound ranged between 1567–1569 m/s and the attenuation ranged between 0.42–0.44 dB/(cm·MHz). Measured T1 ranged from 974–1051 ms. The T2 and T2* values ranged from 97–108 ms and 48–88 ms, respectively, with both showing a decreasing trend with increased psyllium husk concentration. Phantom stiffness, measured using US shear-wave speed measurements, increased with age and decreased with increasing temperature.
Conclusions
The presented dual-use tissue-mimicking phantom is easy to manufacture and can be used to compare and evaluate US-guided and MR-guided HIFU imaging protocols.
Introduction
High-intensity focused ultrasound (HIFU) can non-invasively deliver localized acoustic energy to deep-seated regions of the body [Citation1]. The associated mechanical and thermal effects have been used to treat a variety of ailments such as essential tremor [Citation2], uterine fibroids [Citation3], prostate cancer [Citation4], desmoid tumors [Citation5], and pain associated with bone metastases [Citation6]. The HIFU device is frequently paired with magnetic resonance (MR) or ultrasound (US) imaging systems, so that imaging can be used for treatment planning, monitoring, and endpoint assessment [Citation7,Citation8]. MR imaging has become the clinical standard for guiding many HIFU treatments because of its excellent soft tissue contrast and ability to measure temperature change [Citation9] during the treatment. Thermal dose [Citation10] calculated from temperature change maps can be used independently or in conjunction with post-treatment contrast-enhanced imaging to evaluate the volume of the treated tissue. MR acoustic radiation force imaging (MR-ARFI) techniques [Citation11–13] and MR-based elastography measurements [Citation14–16] could also prove useful for HIFU treatment monitoring by providing additional information about the mechanical state of the tissue before, during, and after treatment.
There is also considerable interest in US-guided HIFU because of the lower cost, when compared to MR-guidance, and wide availability of US imaging systems [Citation8,Citation17,Citation18]. While US thermal imaging techniques are less mature than MR-based approaches [Citation18], recent studies using ultrasound-based shear-wave elastography (SWE) measurements have shown that temperature induced changes in the mechanical properties of tissues can be detected during and after tissue heating [Citation19–22]. SWE techniques are a promising tool for US-guided HIFU treatments and could help enable a lower cost treatment monitoring alternative for certain HIFU therapies that are currently being performed under MR-guidance.
Realistic tissue mimicking phantoms are essential for the rapid testing, development, and validation of new MR and US imaging techniques for guiding HIFU therapies. A dual-use phantom optimized for both imaging modalities would enable the direct comparison of US and MR imaging techniques. Being able to perform US and MR imaging experiments in the same phantom ensures that the HIFU induced heating properties of the phantom (i.e. acoustic absorption) and the mechanical properties of the phantom (i.e. shear modulus) are the same in both imaging studies. The purpose of this capability is twofold: (1) it would allow new US-based imaging metrics for HIFU treatment monitoring to be compared to the MR thermometry metrics which are used clinically to monitor many HIFU therapies; (2) it would enable the evaluation and the direct comparison of US and MR based elastography techniques for HIFU treatment monitoring.
A number of HIFU specific tissue-mimicking phantoms made from polyacrylamide hydrogel [Citation23], gellan gum [Citation24], and ballistic gelatin [Citation25] have been developed and characterized. While these phantoms were designed to have acoustic properties (speed of sound and attenuation) that match those of human tissues, they are often only tailored for one specific imaging modality. For example, the gelatin phantom by Farrer et al. [Citation25] is useful for evaluating many aspects of MR-guided HIFU therapies. However, the ultrasound scattering properties of the phantom material are not representative of actual tissues—B-mode imaging of these phantoms is not possible due to the extremely low amount of back-scattering. US-specific phantom recipes often introduce glass beads [Citation26], graphite [Citation27], or psyllium husk [Citation28] in order to create scatterers necessary for realistic B-mode imaging. However, if the introduced impurities have a magnetic susceptibility that is significantly different from that of the phantom material, significant MR signal loss and image degradation can occur due to phase dispersion and T2* decay caused by this susceptibility mismatch. The ideal phantom for comparing and evaluating US and MR imaging techniques would use a scattering agent that has minimal impact on the MR image.
In this work, we present and characterize a simple cost-effective ballistic gelatin phantom that can be used for both US and MR imaging. Psyllium husk was chosen as the scattering agent because it did not induce significant susceptibility artifacts in MR magnitude and phase images. US and MR properties were measured to evaluate the effect of the added psyllium husk. Elastic properties as a function of phantom temperature and age were also evaluated. We demonstrate that high-resolution MR imaging and advanced US imaging techniques such as US shear-wave speed imaging can be performed on this gelatin/psyllium husk phantom. This dual-use phantom enables the direct comparison of MR and US imaging techniques. The ability to compare imaging modalities in a HIFU phantom could prove useful in the development and validation of US-only HIFU-guided therapies as well as the development and comparison of US and MR elastography approaches for guiding HIFU therapies.
Materials and methods
Phantom construction
Nine cylindrical phantoms (70 mm length × 57 mm diameter) were made by adding psyllium husk to the ballistic phantom recipe of Farrer et al. [Citation25]. To create each phantom, a mixture of 50% by-volume evaporated milk (Nestle Carnation Evaporated Milk: Vitamin D Added) and 50% by-volume degassed deionized water was used (see for complete phantom ingredient list).
Table 1. Phantom ingredients.
First, a slurry was made by mixing 33.3 g of 250-bloom ballistic gelatin powder (Vyse Gelatin Co., Schiller Park, IL, USA), 1 g of DOWACIL 75 preservative (Dow, Midland, MI, USA), and a specific amount (see below) of psyllium husk powder (Nutricost, Vineyard, UT, USA) with 67.5 ml of degassed deionized water. The preservative DOWICIL was used to prevent phantom spoiling and enabled evaluation of the phantom properties over a longer time period than would have been possible in a phantom constructed without the DOWICIL preservative. Each phantom contained a different amount of psyllium husk: 0.15, 0.3, 0.6, 0.9, 1.5, 2.1, 3.0, 3.9, and 4.8 g, which corresponds to 0.5, 1, 2, 3, 5, 7, 10, 13, and 16 g/L, respectively, where the g/L represents the grams of psyllium husk relative to the total solvent volume (i.e. 300 ml of water and evaporated milk). The psyllium husk was added to increase US scattering while minimizing any alteration of the magnetic properties of the phantom material. Psyllium husk grain size was controlled using #100 and #60 mesh sieves. Only grains passing through the #60 mesh and unable to pass through the #100 mesh were used, ensuring that the approximate psyllium husk grain size was between 150 and 250 µm. Ten drops (∼0.5 ml) of defoamer solution (Vyse Gelatin Co., Schiller Park, IL, USA) were added to the slurry to reduce the formation of bubbles. In a separate container, 82.5 ml of degassed deionized water was mixed with 150 ml of evaporated milk. The evaporated milk/water mixture was heated to 80 °C and then combined with the gelatin/psyllium slurry. This mixture was stirred until the gelatin was fully dissolved.
The mixture was then placed into a vacuum chamber to remove any air that was introduced in the mixing process. The mixture was periodically stirred while it cooled to 40–45 °C. Except for when the mixture was stirred, it remained in the vacuum chamber. This process took approximately 15 min. The mixture was then poured into a cylindrical plexiglass phantom holder, which was placed back into the vacuum chamber for 1 min to remove any potential air that was introduced in the pouring process. The phantom holder was topped off, sealed with a stopper cork and cooled in a refrigerator with the cylindrical axis oriented horizontally. For the first 20 min of cooling, phantoms were slowly rotated about their cylindrical axis to help ensure that a uniform distribution of the psyllium husk was maintained during initial gelatin solidification.
Phantom characterization: Acoustic properties
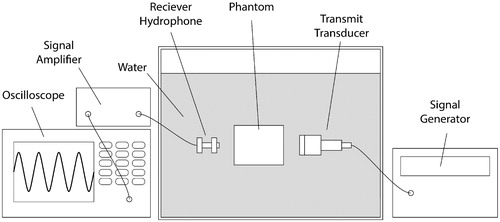
Using the setup depicted in , the speed of sound and attenuation coefficient were measured for each phantom using the through-transmission technique [Citation25,Citation29,Citation30]. Phantom temperature was maintained between 20.6 °C and 20.8 °C during measurement. Measurements were performed at transmit frequencies of 0.6, 1.0, 1.8, and 3.0 MHz and were repeated three times for each phantom. Water-only samples were interspersed with the phantom measurements to give a substitution reference for each measurement. Also, between each measurement set, the phantom was rotated around its cylindrical axis by 120° to control for any measurement variability due to the initial positioning of the phantom in the through-transmission setup. A single attenuation slope value for each phantom was calculated using the following acoustic attenuation model: where
is the frequency in MHz,
is the linear attenuation in dB/cm at frequency
is the attenuation slope in dB/(cm × MHz), and
is the frequency-dependent exponent. Attenuation measurements at the four transmission frequencies were fit to this model using a linear least squares fit to calculate the attenuation slope where
was assumed. The choice of
resulted in R-squared values greater than 0.99 in all phantoms, suggesting that the equation with
can accurately model attenuation in psyllium husk gelatin phantoms for transmit frequencies between 0.6 and 3.0 MHz. The attenuation slope is reported for all attenuation measurements. The average speed of sound was computed by averaging all twelve measurements (4 frequencies and 3 phantom rotation positions at each frequency). All acoustic measurements were performed 2 days after phantoms were constructed.
Figure 1. Schematic of through-transmission experimental setup. The signal generator sends a five-cycle burst to the transmit transducer. The generated acoustic wave travels through the phantom or a water-only reference sample, and the oscilloscope records the remaining transmitted signal after amplification. The use of a broadband transmit transducer (V314, Panametrics-NDT, Waltham, MA, USA) enables the acoustic properties to be measured at transmit carrier frequencies of 0.6, 1.0, 1.8, and 3.0 MHz.
Phantom characterization: Elastic properties
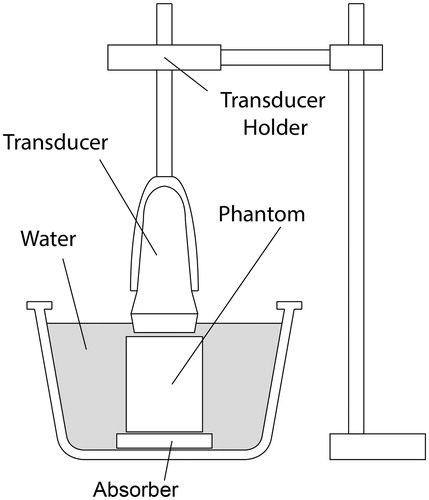
To evaluate the elastic properties of each phantom, 2 D ultrasound shear-wave speed maps were acquired using the Virtual Touch Tissue Imaging and Quantification (VTIQ) function on a Siemens Acuson S2000 US imaging system (Erlangen, Germany). All imaging was performed using the Siemens 9L4 linear transducer array. is a schematic of the experimental setup. Each phantom was immersed in degassed water. An absorber disk (Aptflex F48, Precision Acoustics, Dorchester, UK, 1-cm thick and 7-cm diameter) was placed underneath the phantom to prevent acoustic reflections from the bottom of the phantom and water tank. A custom-built transducer mount held the transducer in position directly above the phantom and allowed for accurate and repeatable positioning of the transducer for different phantom samples and rotations about the phantoms cylindrical axis. A small gap of approximately 1 mm was left between the transducer and the phantom in order to ensure the phantom was not compressed by the transducer.
Figure 2. Schematic of the setup used to perform repeatable ultrasound B-mode imaging and shear-wave speed measurements.
For all imaging, the focal depth of the ultrasound was positioned 1 cm below the face of the transducer. For each phantom, 12 shear-wave speed maps were acquired. Between each measurement the phantom was rotated by 30° about its cylindrical axis. The rotation allowed an average shear-wave speed value over the volume of the homogeneous phantom to be calculated. This measurement protocol was repeated for all nine phantoms. For all measurements in all phantoms, the same imaging parameters were used. For each phantom, the shear-wave speed data for each of twelve measurements within a 10 × 10 voxel region of interest were averaged to compute the average shear-wave speed for each phantom.
To evaluate how the phantom shear-wave speed varies with temperature, the measurement described above was repeated in each phantom at three different temperatures. Phantoms were submerged in a temperature controlled water bath of 21, 25, or 29 °C. Phantoms were allowed to equilibrate with the water bath temperature for more than one hour before US shear-wave speed measurements were acquired. Temperatures ranging from room temperature (i.e. ∼21 °C) to 29 °C were chosen to elucidate the relationship between phantom temperate and stiffness for temperatures below the gelatin melting point.
The relationship between the phantom age and shear-wave speed was also measured in the 10 g/L psyllium husk phantom. After being constructed, the 10 g/L phantom was stored in a refrigerator. At regular intervals over the course of 44 days, the phantom was warmed to 21 °C and shear-wave speed measurements were obtained. These data were evaluated to assess the dependence of phantom stiffness (obtained from shear-wave speed) on phantom age.
Phantom characterization: MR properties
Two days after phantoms were constructed, T1, T2, and T2* relaxation rates were measured at a field strength of 3 Tesla (Trio, Siemens Medical Solutions, Erlangen, Germany) using a custom-built single-channel RF receive-only loop coil. Phantoms were at room temperature (∼21 °C) for all measurements. T1 mapping was performed using a 2 D inversion recovery turbo spin echo sequence with the following scan parameters: resolution 1 × 1×5 mm, TE/TR = 8.2/5000 ms, bandwidth = 751 Hz/pixel, turbo factor = 11, TI = {50, 400, 750, 1100, 1450, 2150, 2500 ms}. T2 mapping was performed using a 2 D turbo spin echo sequence with the following scan parameters: resolution 1 × 1×5 mm, 20 contrasts with TEs between 13.1 and 262 ms, TR = 400 ms, bandwidth = 751 Hz/pixel. For T2 mapping, fitted exponential decay was calculated using the even echoes. T2* mapping was performed using a 3 D gradient-recalled echo sequence with the following scan parameters: resolution 1 × 1×3 mm, 12 equally spaced TEs between 3.96 and 62.92 ms, TR = 68 ms, bandwidth = 750 Hz/pixel, flip angle = 30°. All MR images were reconstructed offline and curve fitting was performed using the lsqnonlin function in MATLAB (Mathworks, Natick, MA) to calculate T1, T2 and T2* relaxation. All T1, T2, T2* values reported are the average values computed from a 14 × 14 pixel ROI about the phantom center.
MR-ARFI images of one phantom (7 g/L psyllium husk) were acquired at 3 Tesla (PrismaFit, Siemens Medical Solutions) using a custom-built receive coil. Acoustic radiation force (ARF) displacements were created using a 256-element phased-array ultrasound transducer (Imasonic, Besançon, France, and Image Guided Therapy, Bordeaux, France; frequency = 1 MHz, focal spot full width at half maximum = 2 × 2×8 mm). ARF displacements were precisely timed with motion encoding gradients (MEG) and were interleaved on the TR level using a method described previously [Citation31]. A focused ultrasound impulse of 58 acoustic watts was supplied for 10 ms to generate the ARF displacement. MR imaging was performed using a segmented echo planar imaging (EPI) protocol with the following scan parameters: TE/TR = 34/150 ms, acquisition matrix = 64 × 70 x 12, resolution 1.25 × 1.25 × 2 mm, echo train length = 7, flip angle = 30°, bandwidth = 752 Hz/pixel, MEG amplitude = 30 mT/m, MEG duration = 10 ms, MEG slew rate = 100 T/m/s. ARF displacements were calculated using a previously described method [Citation31]. MR-ARFI raw data were reconstructed offline and were zero-fill interpolated to a voxel spacing of 0.625 × 0.625 × 0.5 mm.
Results
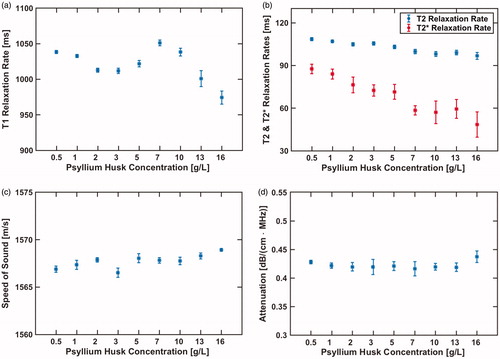
The measured acoustic and MR properties as a function of psyllium husk concentration are plotted in . T2 and T2* relaxation rates decrease with increasing psyllium husk concentration. T2 decreases from 108 ms to 97 ms while T2* decreases from 88 ms to 48 ms. The psyllium husk concentration had a minimal impact on the measured T1 relaxation, speed of sound, and attenuation coefficient.
Figure 3. Measured MR (a and b) and acoustic properties (c and d) for nine different psyllium husk concentrations. Error bars in T1, T2, and T2* relaxation rates (a and b) denote the measurement standard deviation over the 15 × 15 pixel ROI from which the average values were calculated. Error bars in the acoustic property measurements (c and d) denote the standard deviation of the three repeated measurements.
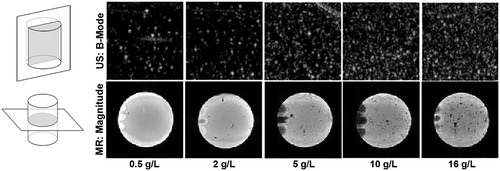
US B-mode and MR gradient echo magnitude images for several psyllium husk concentrations are depicted in . The number of speckles in the US images increase with increasing psyllium husk concentration. The signal intensity of the MR images decreases with increasing psyllium husk concentration. The 16-g/L MR image shows a considerable number of randomly distributed voids in the long-echo time (TE = 25.4 ms) gradient echo image, which are likely due to regions of clumped psyllium husk or trapped air.
Figure 4. US B-mode images and GRE MR magnitude images (TE = 25.4 ms) are depicted for five different psyllium husk concentrations. The schematic line drawings on the left depict the orientation of the imaging planes for the US and MR images relative to the phantom cylinder. The rubber cork stopper used to seal the phantom likely caused the enhanced or decreased image intensity seen on the left side of the MR magnitude images.
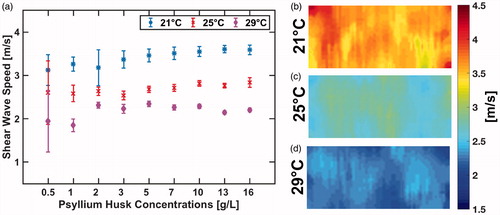
depicts the shear-wave speed as a function of psyllium husk concentration at three different phantom temperatures. The standard deviation of the mean shear-wave speed (denoted by error bars in ) was much higher for the low psyllium husk concentration phantoms. This standard deviation decreases up until approximately the 10 g/L concentration level, and phantoms with higher concentrations do not see a significant decrease in standard deviation of the shear-wave speed measurement. This reduced measurement variability for phantoms with higher psyllium husk concentration is likely due to the fact that the increased number of scatters improves the speckle tracking algorithm used to calculate the speed of the propagating shear wave. The phantom shear-wave speed increases with increased psyllium husk concentration. A linear least squares fit to that data measured for each temperature yields a slope of 0.029, 0.017, and 0.011 m/s/(g/L) for the measurements at 21 °C, 25 °C, and 29 °C, respectively. The corresponding R-squared values for the best-fit line are 0.79, 0.83, and 0.12.
Figure 5. Measured mean shear-wave speed as a function of psyllium husk concentration is shown in (a). US shear-wave speed maps at three different phantom temperatures for the 10 g/L phantom are shown in (b–d).
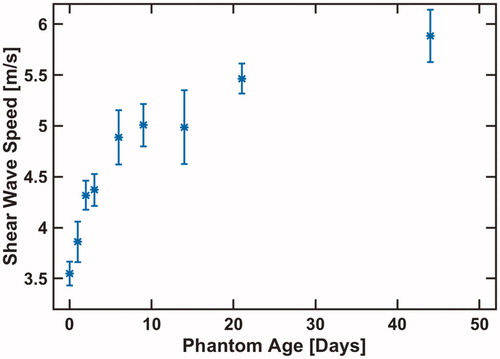
The phantom shear-wave speed with respect to phantom age is plotted in . The average shear-wave speed increased by 2.3 m/s over the course of 44 days. Phantom temperature and age had no apparent effect on the standard deviation of the shear-wave speed measurement.
Figure 6. Measured shear-wave speed as a function of phantom age for 10-g/L psyllium husk phantom.
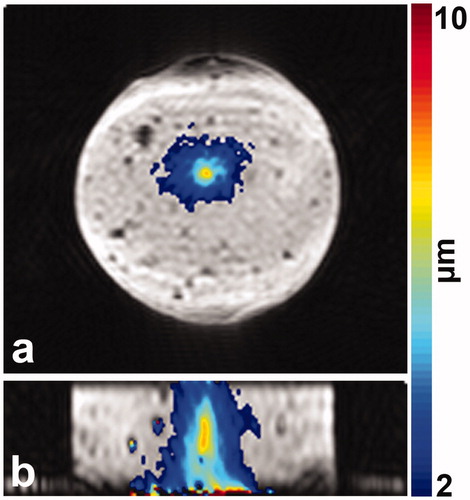
The MR-ARFI displacement measurement performed in the 7-g/L psyllium husk phantom is depicted in . The peak measured ARFI displacement at the HIFU focal spot is 7.6 µm. The MR-ARFI and US shear-wave speed measurements demonstrate that imaging methods sensitive to tissue mechanical properties can be made on this dual-use psyllium husk phantom.
Figure 7. 3 D MR-ARFI displacement maps in coronal (a) and sagittal (b) plane are depicted as a color overlay on the segmented EPI magnitude image.
Discussion
In this study, the acoustic, MR, and elastic properties of gelatin phantoms with varying concentrations of psyllium husk were characterized. For all psyllium husk concentrations, the measured speed of sound and attenuation values were close to the target values of 1540 m/s and 0.5 dB/(cm·MHz), respectively, which were the target values used to develop the gelatin phantom recipe by Farrer et al. [Citation25]. The measured linear attenuation coefficients of all psyllium husk phantoms were all less than the 0.5 dB/(cm·MHz) target, but differed from this value by no more than 16%. The small amount of added psyllium husk, while sufficient to introduce back scatters needed for B-mode imaging, had a negligible impact on the acoustic attenuation. If desired, the phantom attenuation could be further increased to more closely match the 0.5 dB/(cm·MHz) target by modifying the recipe. Since evaporated milk is a key absorber of acoustic energy [Citation25,Citation26], increasing the percent volume of evaporated milk, and reducing the water by an equal volume would increase the acoustic attenuation. The phantom speed of sound measurement differed from the target value by no more than 2%. For all psyllium husk concentrations, the measured phantom T1 and T2 relaxation rates were within the range of values typically measured in brain gray matter at 3 T [Citation32]. For certain applications, mimicking tissue types with shorter T1 and T2 may be desired. For these circumstances, relaxation rates can be shortened by adding copper sulfate, a technique that is frequently used in the construction of homogeneous MR imaging phantoms. Of the MR relaxation rates, T2* was most significantly affected by the psyllium husk concentration—higher psyllium husk concentration resulted in shorter T2*. Higher psyllium husks concentration also correlated with an increased number of low-signal intensity voids in the long-echo time GRE MR images. These voids were likely due to clumping of psyllium husk or the potential for increased trapped air at higher psyllium husk concentrations.
While the MR T2* relaxation rate decreased with increasing psyllium husk concentration, visible scatterers in US B-mode imaging increased with increasing psyllium husk concentration. The US images of demonstrate that the addition of psyllium husk to the gelatin phantom resulted in scattering that was visualized with ultrasound B-mode imaging. The standard deviation of the US shear-wave speed measurement decreased with higher psyllium husk concentrations, suggesting that higher psyllium husk concentrations are essential for improved US elastography. However, for psyllium husk concentrations beyond 10 g/L there was no noticeable reduction in the standard deviation of the shear-wave speed measurement. Although MR T2* relaxation decreased with increasing psyllium husk concentration, T2* was still reasonably long in phantoms with psyllium husk content up to 16 g/L. If T2* is too short, this can be problematic for testing a variety of MR-ARFI and MR temperature mapping protocols which frequently utilize long-echo time GRE imaging protocols.
One key application of this psyllium husk phantom would be for comparative evaluation of MR and US elastography and ARFI imaging approaches. Both MR-ARFI and MR-elastography utilize phase contrast imaging approaches to re-construct ARFI displacement or elasticity maps from MR phase images. To demonstrate that these phase-based measurements can still be performed in a phantom containing psyllium husk, an MR-ARFI measurement was performed in the 7-g/L psyllium husk phantom using a long-echo time (TE = 34 ms) imaging protocol. shows that even for this long echo time acquisition, the ARFI displacement in 3 D can be readily visualized.
Because phantom stiffness depends significantly on temperature and age, as shown in and , respectively, these two factors must be controlled when using gelatin phantoms to evaluate various elastography approaches. Since the phantom stiffness changes most dramatically in the first ten days after construction, for certain studies it may be useful to wait ten days for the stiffness to stabilize before performing experiments. Corresponding measurements should be performed as closely in time as possible with the sample at the same temperature. This time-constraint may be limiting for certain applications if comparative experiments cannot be scheduled back-to-back on the same day. In this phantom characterization study, 250-bloom gelatin was used for all phantoms. However, 175-bloom and 125-bloom gelatin is available and can be used as a substitute for the 250-bloom phantom if lower shear stiffness (i.e. slower shear-wave speed) phantoms are desired for a particular application.
Conclusion
This work presents a tissue-mimicking phantom that is easy to construct and can be used for both US- and MR-guided HIFU imaging studies. The recipe allows for modification of the psyllium husk concentration to achieve various levels of US echogenicity and MR image quality. Acoustic, MR, and elastic properties of the phantoms at different psyllium husk concentrations were characterized and enable informed decisions on which operating point to select. For our use cases, the 7-g/L or 10-g/L concentrations provided adequate US and MR image characteristics for both imaging modalities. In future studies this phantom will be used to compare and evaluate advanced US and MR imaging techniques that may be useful for HIFU treatment monitoring.
Disclosure statement
No potential conflict of interest was reported by the author(s).
Additional information
Funding
References
- Hynynen K, Jones RM. Image-guided ultrasound phased arrays are a disruptive technology for non-invasive therapy. Phys Med Biol. 2016;61(17):R206–R248.
- Elias WJ, Lipsman N, Onda WG, et al. A randomized trial of focused ultrasound thalamotomy for essential tremor. N Engl J Med. 2016;375(8):730–739.
- Stewart EA, Rabinovici J, Tempany CMC, et al. Clinical outcomes of focused ultrasound surgery for the treatment of uterine fibroids. Fertil Steril. 2006;85(1):22–29.
- Blana A, Walter B, Rogenhofer S, et al. High-intensity focused ultrasound for the treatment of localized prostate cancer: 5-year experience. Urology. 2004;63(2):297–300.
- Ghanouni P, Dobrotwir A, Bazzocchi A, et al. Magnetic resonance-guided focused ultrasound treatment of extra-abdominal desmoid tumors: a retrospective multicenter study. Eur Radiol. 2017;27(2):732–740.
- Liberman B, Gianfelice D, Inbar Y, et al. Pain palliation in patients with bone metastases using MR-guided focused ultrasound surgery: a multicenter study. Ann Surg Oncol. 2009;16(1):140–146.
- Hynynen K. MRIgHIFU: a tool for image-guided therapeutics. J Magn Reson Imaging. 2011;34(3):482–493.
- Ebbini ES, Ter Haar G. Ultrasound-guided therapeutic focused ultrasound: current status and future directions. Int J Hyperth. 2015;31(2):77–89.
- Odéen H, Parker DL. Magnetic resonance thermometry and its biological applications – physical principles and practical considerations. Prog Nucl Magn Reson Spectrosc. 2019;110:34–61.
- Sapareto SA, Dewey WC. Thermal dose determination in cancer therapy. Int J Radiat Oncol Biol Phys. 1984;10(6):787–800.
- McDannold N, Maier SE. Magnetic resonance acoustic radiation force imaging. Med Phys. 2008;35(8):3748–3758.
- Odéen H, de Bever J, Hofstetter LW, et al. Multiple-point magnetic resonance acoustic radiation force imaging. Magn Reson Med. 2019;81(2):1104–1117.
- Vappou J, Bour P, Marquet F, et al. MR-ARFI-based method for the quantitative measurement of tissue elasticity: application for monitoring HIFU therapy. Phys Med Biol. 2018;63(9):95018.
- Muthupillai R, Lomas DJ, Rossman PJ, et al. Magnetic resonance elastography by direct visualization of propagating acoustic strain waves. Science. 1995;269(5232):1854–1857.
- Wu T, Felmlee JP, Greenleaf JF, et al. Assessment of thermal tissue ablation with MR elastography. Magn Reson Med. 2001;45(1):80–87.
- Hofstetter LW, Odéen H, Bolster BD, et al. Efficient shear wave elastography using transient acoustic radiation force excitations and MR displacement encoding. Magn Reson Med. 2019;81(5):3153–3167.
- Vaezy S, Shi X, Martin RW, et al. Real-time visualization of high-intensity focused ultrasound treatment using ultrasound imaging. Ultrasound Med Biol. 2001;27(1):33–42.
- Lewis MA, Staruch RM, Chopra R. Thermometry and ablation monitoring with ultrasound. Int J Hyperth. 2015;31(2):163–181.
- Sapin-de Brosses E, Gennisson JL, Pernot M, et al. Temperature dependence of the shear modulus of soft tissues assessed by ultrasound. Phys Med Biol. 2010;55(6):1701–1718.
- Sapin-de Brosses E, Pernot M, Tanter M. The link between tissue elasticity and thermal dose in vivo. Phys Med Biol. 2011;56(24):7755–7765.
- Arnal B, Pernot M, Tanter M. Monitoring of thermal therapy based on shear modulus changes: I. shear wave thermometry. IEEE Trans Ultrason, Ferroelect, Freq Contr. 2011;58(2):369–378.
- Arnal B, Pernot M, Tanter M. Monitoring of thermal therapy based on shear modulus changes: II. Shear wave imaging of thermal lesions. IEEE Trans Ultrason, Ferroelect, Freq Contr. 2011;58(8):1603–1611.
- Lafon C, Zderic V, Noble ML, et al. Gel phantom for use in high-intensity focused ultrasound dosimetry. Ultrasound Med Biol. 2005;31(10):1383–1389.
- King RL, Liu Y, Maruvada S, et al. Development and characterization of a tissue-mimicking material for high-intensity focused ultrasound. IEEE Trans Ultrason Ferroelectr Freq Control. 2011;58(7):1397–1405.
- Farrer AI, Odéen H, de Bever J, et al. Characterization and evaluation of tissue-mimicking gelatin phantoms for use with MRgFUS. J Ther Ultrasound. 2015;3(1):9.
- Madsen EL, Frank GR, Dong F. Liquid or solid ultrasonically tissue-mimicking materials with very low scatter. Ultrasound Med Biol. 1998;24(4):535–542.
- Madsen EL, Zagzebski JA, Macdonald MC, et al. Ultrasound focal lesion detectability phantoms. Med Phys. 1991;18(6):1171–1180.
- Bude RO, Adler RS. An easily made, low-cost, tissue-like ultrasound phantom material. J Clin Ultrasound. 1995;23(4):271–273.
- Kak AC, Dines KA. Signal processing of broadband pulsed ultrasound: measurement of attenuation of soft biological tissues. IEEE Trans Biomed Eng. 1978;25(4):321–344.
- Le LH. An investigation of pulse-timing techniques for broadband ultrasonic velocity determination in cancellous bone: a simulation study. Phys Med Biol. 1998;43(8):2295–2308.
- de Bever JT, Odéen H, Hofstetter LW, et al. Simultaneous MR thermometry and acoustic radiation force imaging using interleaved acquisition. Magn Reson Med. 2018;79:1515–1524.
- Bojorquez JZ, Bricq S, Acquitter C, et al. What are normal relaxation times of tissues at 3 T? Magn Reson Imaging. 2017;35:69–80.