
Abstract
Purpose
To explore the typical magnetic resonance imaging (MRI) pattern of osteoblastoma (OB) after radiofrequency ablation (RFA) treatment and to identify signs indicating treatment success or relapse.
Materials and methods
Forty-four follow-up MRI examinations of 15 patients with OB who had undergone 19 RFA procedures were analyzed retrospectively. An early follow-up group (1–4 months after RFA) and a late follow-up group (8–131 months after RFA) were established. The groups were further subdivided according to treatment success. Images were analyzed for the presence of central nidus enhancement (CNE), peripheral nidus enhancement (PNE), perifocal bone marrow edema (PBME) and fatty nidus conversion (FNC).
Results
The early follow-up MRI image from every patient in the treatment success group exhibited a target-like appearance with negative CNE and positive PNE or PBME. PNE and PBME were observed in 93% and 71% of the early follow-up images, respectively. A target-like appearance was observed in 25% of the late follow-up images, and PNE and PBME were each observed in 20% of these images. FNC was not observed in the early follow-up images, but was seen in 55% of the late follow-up images. All three MRI images of the patients exhibiting clinical recurrence demonstrated strong CNE, PNE and extensive PMBE, which was in contrast to the images of the patients exhibiting treatment success.
Conclusion
A target-like appearance of OB in early follow-up MRI examination indicates treatment success. PNE and PBME typically reduce over time and can lead to FNC in successfully treated patients. CNE recurrence, PNE and extensive PBME are signs of relapse.
Introduction
Osteoblastoma (OB) is a rare osteoid-producing primary bone tumor that was initially described as ‘giant osteoid osteoma’ in the literature. This was because OBs histologically resemble osteoid osteomas (OOs), but are larger in size [Citation1,Citation2]. OB typically appears in the second and third decades of life, and is usually morphologically characterized by a central nidus surrounded by a sclerotic area [Citation3,Citation4].
Despite having histological similarities, OBs are known to be four times less frequent than OOs. Based on histological studies, 15 mm is the cutoff value used to distinguish between OOs and OBs, the latter being larger than 15 mm [Citation3]. Compared to OOs, OBs display a more expansive growth pattern, are more frequently located in the spine and present with less characteristic imaging features and symptoms [Citation5]. OBs have a more variable clinical presentation, while OOs typically present with excessive nocturnal bone pain that is sensitive to nonsteroidal anti-inflammatory drugs (NSAIDs) [Citation2].
Long-term NSAID treatment, especially in younger patients, should be avoided due to associated side effects. Open surgical resection of the nidus is currently considered as the gold standard for definitive treatment of OB, despite the reported recurrence rates [Citation3,Citation5].
However, recent publications have indicated that computed tomography (CT)-guided radiofrequency ablation (RFA) is a safe and minimally invasive procedure exhibiting high clinical success rates in the treatment of OBs [Citation6–9]. Moreover, RFA exhibits similar treatment success rates to surgery and is less invasive, cheaper, and requires a shorter hospital stay [Citation8]. However, these are early findings, and the study cohorts and the assessment methods differed. In their study, Arrigoni et al. [Citation6] included only spinal OB cases and focused on follow-up CT examinations, identifying bone remodeling and sclerosis of the nidus as signs of successfully treated OBs. The other studies included mixed cohorts of OO and OB cases, but did not focus on OB alone or systematically assessed the magnetic resonance imaging (MRI) morphology of OB [Citation7–9].
To date, no study has systematically assessed the imaging patterns of OB following RFA using MRI. Moreover, the MRI criteria that indicate treatment success, relapse or incomplete ablation have not yet been defined. Given that OB patients often exhibit unspecific clinical manifestations, clinical evaluations are of limited value, follow-up imaging may be a valuable means to assess treatment success. Also, as currently, there is only limited knowledge on the effect of RFA on OB. Moreover, in this generally young cohort of patients, MRI may be beneficial over CT for follow-up imaging because of the absence of radiation exposure. Additionally, signs of tumor activity, bone marrow edema and tumor contrast enhancement, all of which indicate relapse, may be detected more reliably using MRI.
Therefore, the purpose of our study was to retrospectively evaluate the MRI morphology of OB after RFA treatment and to identify signs that indicate treatment success or relapse.
Material and methods
Ethical policy and inclusion and exclusion criteria
A waiver of consent was granted by the local review board, and the study complied with the Declaration of Helsinki in its present form. OB diagnosis and suitability for CT-guided RFA were confirmed via an individual case discussion by an interdisciplinary board consisting of at least one senior musculoskeletal radiologist, a senior orthopedic surgeon subspecialized in tumor orthopedics, and, in spinal cases, a senior spine surgeon.
The following inclusion criteria for the study were applied: (1) clinical presentation to the interdisciplinary board of our institution, (2) verification of a nidus measuring at least 15 mm using thin-sliced CT, (3) bone pain related to the anatomic region corresponding to the OB, (4) CT-guided RFA performed at our institution and (5) the existence of at least one follow-up contrast-enhanced MRI examination performed after RFA. The following exclusion criteria were applied: (1) the diagnosis of aggressive OB, which is considered to be a different histological entity and is typically treated via surgical resection [Citation4], (2) radiological suspicion of malignancy, (3) the absence of symptoms and (4) technical contraindications for RFA. A permeative growth pattern, ill-defined margins, cortical interruption and the presence of an associated soft-tissue mass were defined as signs of an aggressive OB and malignancy. In this study, we did not include patients who underwent surgery for OB.
Patient population
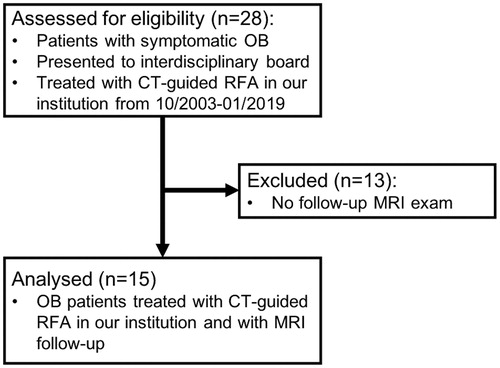
A total of 28 patients with symptomatic OB met the clinical inclusion criteria (1)–(3) and were treated with CT-guided RFA at our institution between October 2003 and January 2019. Thirteen patients were excluded from the study as no follow-up contrast-enhanced MRI examination was available to be analyzed. Therefore, the final study cohort consisted of 15 patients who underwent a total of 19 CT-guided RFA procedures ().
Figure 1. Flow diagram of the study cohort.
All patients underwent routine pre-procedural screening that included a medical history assessment, a physical examination and basic laboratory tests. OB diagnosis was confirmed based on clinical bone pain related to the corresponding anatomic region and the presence of a radiolucent bone lesion surrounded by a sclerosing rim, measuring at least 15 mm using multi-detector CT. MRI, and, in selected cases, scintigraphic bone scans were considered to support the diagnosis. In four cases, an additional biopsy was performed to substantiate OB diagnosis. Previous reports have stated that OB can be diagnosed without a biopsy being performed when the morphology is suggestive of this tumor type and signs of aggressiveness are absent [Citation9]. Therefore, the other 11 OB diagnoses were based on typical clinical findings and imaging patterns.
RFA procedure
All RFA procedures were performed by three senior musculoskeletal radiologists with experience of 9–14 years in musculoskeletal interventional procedures. All RFA procedures were performed via CT-guidance and with the patient under general anesthesia. The technique used was similar to that described in previous reports on OB and OO [Citation8]. Access to the OB nidus was made with a coaxial bone biopsy set (Bonopty®; AprioMed, Uppsala, Sweden). The length of the ablation electrode (Cool-tip™; Valleylab, Tyco Healthcare Group LP, Boulder, CO, USA) was 1.0 cm. The number of needle positions used was dependent on the diameter of the OB and the anatomical conditions. On average, RFA was performed at 2.4 needle positions (median = 2; range = 1–6; ). Each ablation was performed for a total of 400 s at a temperature of 90 °C. Technical success was defined as (1) placement of the active tip within the nidus, (2) safe and effective placement of protective measures and (3) ablation performed according to the planned ablation protocol [Citation8]. Thermal protection via an epidural air injection was performed in one case in which there was no cortical coverage of the OB toward the spinal nerve roots. This technique was performed as described previously in the literature [Citation9,Citation10].
Table 1. Data overview of the study group.
Follow-up MRI examination and analysis
As there was no standard follow-up regime defined from previous studies, we recommended that all patients underwent a short-term (approximately 3 months after RFA) and long-term (approximately 12 months after RFA) follow-up examination. At these follow-ups, clinical examinations were performed by orthopedic tumor surgeons, and contrast-enhanced MRI examinations were performed in the radiology department to assess treatment success and potential relapse. However, this regimen was not strictly followed by all patients, and we defined the short-term follow-up period as 1–4 months after RFA and the long-term follow-up period as ≥8 months after RFA. It is likely that most patients were asymptomatic after the RFA procedure, which may underlie the poor patient follow-up visit attendance observed in this study. This phenomenon has already been described in a previous follow-up study of patients with OOs [Citation11].
In this study, OB treatment was considered to be successful when all of the following criteria were met: (1) technical success of the RFA procedure, (2) absence of pain symptoms at the anatomical region corresponding to the OB at the clinical follow-up exams and (3) no evidence of tumor recurrence in the follow-up MRI exams.
Of the 44 post-RFA MRI follow-up exams analyzed in this study, 36 were performed in our department using a single 3T-MRI scanner (Magnetom Verio, Siemens Healthineers, Erlangen, Germany) according to a uniform protocol. MRI follow-up exams performed at external institutions were included if they contained T1-, T2-weighted and contrast-enhanced images acquired in at least two spatial planes. The MRI protocol used in our department for OB examinations is shown in .
Table 2. MRI protocol for osteoblastoma examinations in our department.
Follow-up MRI exams were analyzed using a standardized approach by a senior musculoskeletal radiologist with 14 years of experience in interventional musculoskeletal procedures (CR). MRI exams were screened for four distinct morphological patterns of the ablated OB nidus that were adapted from a previous study on MRI follow-up patterns of OOs treated with RFA [Citation11]: (1) relative contrast enhancement of the central part of the OB nidus (CNE) compared to adjacent normal non-pathological bone marrow; (2) relative contrast enhancement of the peripheral part/rim of the OB nidus (PNE) compared to adjacent normal non-pathological bone marrow; (3) perifocal bone marrow edema (PBME), defined by a region of relatively high signal intensity on T2-weighted images around the OB nidus compared to normal non-pathological bone marrow and (4) fatty conversion of the nidus (FNC), defined by T1- and T2-weighted isointensity compared to adjacent non-pathological bone marrow. shows graphical illustrations of the four patterns.
Figure 2. Graphical illustration of the imaging patterns of osteoblastoma after ablation. The linear black and gray pattern represents edema or enhancement. The white signal represents normal bone marrow signal. CNE: central nidus enhancement; PNE: peripheral nidus enhancement; PBME: perifocal bone marrow edema; FNC: fatty nidus conversion.
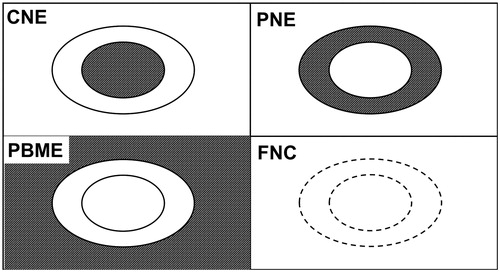
Additionally, we defined a negative CNE and positive PNE or PBME as a ‘target-like appearance’ pattern.
Descriptive statistics (mean, median, frequency and percentage) are provided where appropriate. Data analysis and evaluation were performed with Microsoft Excel, version 16 (Microsoft, Redmond, WA, USA).
Results
contains individual patient data. Mean patient age was 20.2 years old (range: 3–48 years). Four patients (27%) were female, and 11 were male (73%). Four OBs were located in the tibia, three in the femur and two in the scapula, humerus and hip. One was located in the spine and the sacrum. Six of the 15 (40%) OBs exhibited direct joint contact. Mean OB size, measured at the largest diameter was 17.1 mm (range: 15–23 mm). All 15 (100%) OBs showed central nidus mineralization. Eleven of the 15 (73%) OBs were ellipsoid in shape, and four (27%) were spherical in shape. All of the lesions exhibited a radiological appearance that was in line with OB. Hence, none of the OBs exhibited an aggressive or infiltrating pattern. RFA was performed at 2.4 needle positions on average (range: 1–6). Overall, the MRI follow-up period ranged from 1 to 131 months after RFA, and the mean interval between MRI exams was 9.4 months.
All 15 patients included in this study were treated successfully with RFA. A total of 19 RFA procedures were performed on these 15 patients, and all were technically successful. However, two patients had local recurrence twice and had to undergo two further RFA procedures. To explore the typical appearance of OBs successfully treated with RFA and recurrences, a non-recurrence and a recurrence subgroup were defined. The non-recurrence subgroup included all follow-up MRI exams performed after successful RFA treatment, while the recurrence group included all follow-up MRI exams at the time of recurrence. The mean time ranges of the follow-up MRIs after RFA were 20.1 months for the non-recurrence subgroup and 21.3 months for the recurrence subgroup.
In the non-recurrence subgroup, a total of 14 early follow-up MRIs of 13 patients and 20 late follow-up MRIs of 10 patients were available for analysis. None of the early or late follow-up exams showed CNE (). However, PNE was seen in 13 of the 14 (93%) early follow-up exams and only four of the 20 (20%) late follow-up exams. Moreover, major differences were also observed with respect to PBME, which was seen in 10 of the 14 (71%) early follow-up exams and only four of the 20 (20%) late follow-up studies. None of the early follow-up MRI exams showed FNC. In contrast, FNC was observed in 11 of the 20 (55%) late follow-up studies. All 14 (100%) early follow-up MRI studies showed negative CNE and positive PNE or PBME, representing a target-like appearance ( and ). This target-like appearance was seen in five of the 20 (25%) late follow-up MRI studies.
Figure 3. Images of an 8-year-old female with a successfully treated osteoblastoma of the left acetabulum. (a) Axial T1-weighted fat-saturated contrast-enhanced image taken at the time of diagnosis showing strong enhancement of the nidus (thick arrow) with extensive perifocal edema. (b) Axial reformation of the CT scan taken during the RFA procedure showing the needle tip in the nidus. (c–e) Follow-up axial T1-weighted fat-saturated contrast-enhanced images taken at 4, 9 and 21 months post-RFA. (c, d) A target-like appearance (thin arrows) is seen after 4 and 9 months. (e) Disappearance of the peripheral nidus enhancement and perifocal edema after 21 months. (f, g) Follow-up coronal T1-weighted images taken at 4 and 21 months post-RFA showing fatty conversion of the nidus (arrowheads) over this period. RFA: radiofrequency ablation.
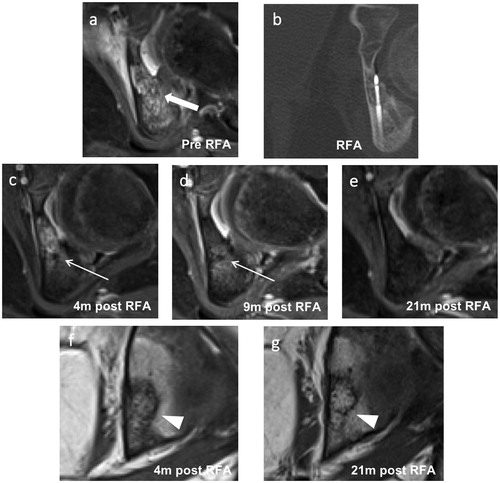
Figure 4. Images of a 10-year-old male with a successfully treated osteoblastoma of the right sacrum. (a) Axial short tau inversion recovery image taken before RFA showing a hyperintense nidus (thick arrow) with extensive perifocal edema. (b) Axial reformation of the CT scan taken during the RFA procedure showing the RFA needle tip in the nidus and an epidural needle for thermal protection. (c, d) Follow-up axial T1-weighted fat-saturated contrast-enhanced images taken at 1 and 16 months post-RFA. (c) A typical post-RFA pattern of a target-like appearance (thin arrow) is seen after 1 month. (e) Disappearance of the peripheral nidus enhancement (arrowhead) and perifocal edema after 16 months. (f) Follow-up coronal T1-weighted images of the same MRI as in (e) taken 16 months after RFA showing fatty conversion of the nidus (arrowhead). RFA: radiofrequency ablation.
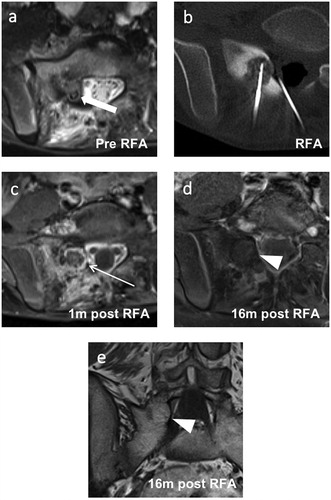
Table 3. Morphological follow-up MRI pattern of successfully treated osteoblastoma patients.
To identify differences in the follow-up MRI patterns of local OB recurrence and non-recurrence, MRI exams of patients from the time of clinical recurrence were analyzed in the second ‘recurrence’ subgroup. Two patients underwent a total of three RFA procedures before treatment was successful. For both of these patients, local recurrence was noted after the first and second RFA procedures. The mean time to recurrence after the last RFA was 18.8 months (). For three of these four cases, a follow-up MRI exam from the time of local recurrence was available (). These MRI exams were conducted 5, 26 and 33 months (mean: 21.3 months) after the last RFA procedure. In all three exams, CNE, PNE and PBME were observed (). In contrast, FNC was not observed in any of these three MRI exams.
Figure 5. Images of a 16-year-old male with a recurrent osteoblastoma of the right humerus. (a) Coronal reformation of a CT scan performed at the time of diagnosis. (b) Axial T2-weighted fat-saturated image taken at the time of the second clinical recurrence showing extensive perifocal bone marrow edema and the former drilling channel (thick arrow) located cranially and laterally to the recurrent active nidus. (c) Coronal T1-weighted fat-saturated contrast-enhanced image of the same exam as in (b) showing strong contrast enhancement of the central nidus (arrowhead). (d) Coronal reformation of a CT scan performed at the time of the second recurrence showing an active centrally mineralized nidus (arrowhead) in the cranial segment of the initial osteoblastoma. (e, f) Coronal and axial T1-weighted fat-saturated contrast-enhanced images taken 3 months after the third RFA. A typical target-like appearance is seen with a non-enhanced central nidus surrounded by an enhanced peripheral nidus (thin arrows). Only a small degree of perifocal bone marrow edema is visible. RFA: radiofrequency ablation.
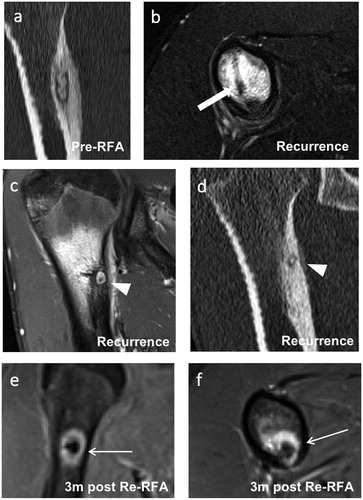
Table 4. Morphological follow-up MRI pattern at the time of clinical osteoblastoma recurrence after RFA.
Discussion
Due to its high success rates, safety and minimal invasiveness, RFA is currently considered the gold standard for treating OO. In recent years, RFA has been further developed. This has led to the indication that RFA can be used to treat OB with similar outcome rates to surgery with the benefit of being a minimally invasive procedure [Citation6–9]. Therefore, early studies have proposed RFA as a first-line treatment in many OB cases after interdisciplinary discussion. However, an imaging follow-up regimen that assesses treatment success and signs of relapse has not yet been developed. In this study, we investigated the short-term and long-term MRI patterns of OB in 15 patients.
The rationale to screen for the morphological patterns CNE, PNE, PBME and FNC was derived from previous findings on the MRI follow-up patterns of OOs treated with RFA. Lee et al. [Citation11] described a typical target-like appearance, consisting of a T1- and T2-weighted hypointense, non-enhanced center surrounded by an enhanced margin 1–2 months after RFA. We adapted the definition and characterized the target-like appearance by negative CNE and positive PNE or PBME.
In this study, 100% of the MRI examinations included in the non-recurrence subgroup showed a typical target-like appearance at the early follow-up (1–4 months). This pattern was characterized by a negative CNE and positive PNE or PBME. PNE was observed in 93% of the early-follow up MRI images. Interestingly, PBME was observed in 71% of the early follow-up images, indicating that the absence of PBME may not be a reliable sign for predicting treatment success at an early stage. The aforementioned target-like appearance was observed in 25% of the late follow-up images (8–131 months). Furthermore, PNE and PBME were observed in 93% and 71% of the early follow-up images, respectively, but in only 20% of the late follow-up MRI images. CNE was not observed in any of the early or late follow-up MRI exams of successfully treated patients.
Based on our findings, a target-like pattern is a typical finding at the early phase of OB. PNE and PBME typically diminish over time, although exceptions occur, and the exact time point at which PNE and PBME disappear cannot be predicted. In contrast, CNE is not observed at any point in successfully treated OB. This observation partially contradicts the findings of Arrigoni et al., who investigated the use and the long-term follow imaging findings of RFA in patients with spinal OB. They conducted follow-up CT and MRI examinations at 6 months post-RFA and at the end of the follow-up period, and observed neither edema nor contrast enhancement in any of the cases at any of the examinations. However, in contrast to this study, no differentiation was made between CNE and PNE. Instead, they focused on follow-up CT patterns, identifying a bone remodeling process involving sclerosis of the nidus as a sign of successful treatment [Citation6]. However, given the radiation exposure associated with repeated CT scans in this young patient population, MRI may be a more advantageous follow-up tool. Hence, detailed knowledge of the MRI pattern of OB over time is crucial. In our study, complete absence of contrast enhancement and bone marrow edema was not observed in any of the patients at the early follow-up examination, and must therefore not be considered a sign of relapse or incomplete ablation. At this early phase, a target-like appearance is the typical pattern observed. Although PNE and PBME were reduced in the late follow-up images, persistence was observed in 20% of the successfully treated cases, so PNE and PBME should not be considered signs of treatment failure. Hence, this study demonstrated that OBs exhibit a spectrum of MRI patterns over time.
Our data suggest that a target-like appearance of the ablation area on early follow-up contrast-enhanced MRI is a strong indicator of successful treatment. Accordingly, the presence or absence of PBME should not be used as an outcome indicator. Similar morphological characteristics have been described for OOs, skeletal muscle, and liver lesions after RFA [Citation12–14]. Histopathological studies have revealed that for these entities, the non-enhanced central nidus corresponds to an area of coagulation necrosis. In contrast, the enhancing margin corresponds to a region of acute inflammation that is associated with edema, hyperemia, and hemorrhagic foci [Citation11,Citation13,Citation15].
In our study group, four RFA procedures in two different patients resulted in clinical recurrence. All three available MRI exams performed at the time of recurrence revealed a similar local pattern. In contrast to follow-up MRI studies of the non-recurrence subgroup, all three exams exhibited strong CNE. Moreover, PNE and extensive PBME were observed in all of these examinations. Therefore, only strong CNE combined with extensive edema and corresponding clinical symptoms indicate recurrence and nidus activity. Histopathologically, this may correspond to the reappearance of osteoid-producing tumor cells that induce an inflammatory process involving cyclooxygenase-2 overexpression and prostaglandin production, leading to hyperperfusion. This could explain the nidus enhancement, the surrounding bone marrow edema, and the new onset of pain [Citation16,Citation17].
An interesting finding of our study was the presence of FNC in 55% of the late follow-up studies, but not in any of the early follow-up studies. This may suggest that fatty nidus conversion is a sign of complete ablation and bone restoration, which does not occur until the late stages of OB. This sign has not been emphasized in previous studies investigating late-phase imaging patterns. When CT is used as a follow-up tool, increasing mineralization of the nidus is commonly observed during the late phase. Indeed, Arrigoni et al. [Citation6] observed a progressive bone remodeling process over time in the CT exams of successfully radiofrequency ablated OBs, advancing from sclerosis to complete restoration. Similar to our results in terms of FNC, only three of the eleven patients included in the study by Arrigoni et al. [Citation6] exhibited complete restoration of the treated bone segment at least 48 months after ablation on CT. Similarly, Cazzato et al. [Citation18] reported variable degrees of bone mineralization in follow-up CT exams performed 12 months after OB cryoablation. Therefore, FNC on MRI and increasing mineralization on CT may be signs of complete bone restoration visible on late follow-up images. A future study should be conducted to compare these MRI and CT patterns and investigate the degree of overlap or correspondence. Currently, the reason for the varying CT and MRI patterns seen in different patients at the late stage remains to be elucidated.
According to our results, specific MRI patterns were observed in case of recurrence. The MRI patterns observed in patients without clinical signs of recurrence differed, but were also characteristic. However, this did not change patient management or therapy. Therefore, follow-up imaging may not be routinely required, and we suggest that follow-up imaging is performed only in cases of persistent or recurrent pain or when complications are suspected. An early clinical follow-up 3 months after RFA seems a reasonable time point to first assess treatment success, followed by a second follow-up after 12 months. The combination of clinical symptoms and CNE surrounded by bone marrow edema may indicate that RFA needs to be performed again. The active nidus visible on contrast-enhanced MRI then becomes the new target for re-RFA treatment.
The study has several limitations. Firstly, this study included a relatively small number of patients, primarily due to the fact that OB is a very rare type of bone tumor. However, this study included the largest published number of patients with OB treated using RFA. A second limitation is that many patients did not comply with the recommended standard follow-up scheme, leading to heterogeneous follow-up MRI numbers and intervals between different patients. A reason for this may be that many patients were asymptomatic after RFA treatment, so did not consider any further visits necessary. Thirdly, this was a retrospective study. Prospective studies compromising fixed and homogenous follow-up intervals may further define the period during which imaging characteristics change between the early and late phases. As we solely focused on RFA, the characteristic imaging patterns we identified may not be transferable to other minimally invasive treatment methods such as laser ablation or cryoablation. Cryoablation may be of particular interest because of the visibility of the ice ball during the procedure. Furthermore, this technique can ablate sclerotic bone, and thus may be effective in heavily sclerotic OBs. In a recent study, Cazzato et al. [Citation18] showed that cryoablation was effective in OBs close to critical structures when protective measures were taken. In the aforementioned study, the authors did not observe any contrast enhancement in the treatment zone in six of the nine OB patients without clinical recurrence, while two patients exhibiting relapse showed contrast enhancement at the follow-up MRI examination. Therefore, a future study directly comparing the success, relapse rates and follow-up imaging findings of RFA and cryoablation is warranted.
Fourthly, MRI protocols varied between our department and external institutions. The final limiting factor is the lack of histological OB confirmation in most of the patients. However, we believe that in cases where the typical CT and MRI patterns are observed, OB can be diagnosed based on clinical symptoms and imaging findings. In such cases, histological confirmation may not be necessary [Citation9]. However, a biopsy should be performed in all unclear cases, including OBs exhibiting aggressive patterns, and when malignancy cannot be excluded. Moreover, the biological behavior and histopathological appearance of OB may influence the recurrence rate, which is an argument in favor of performing a biopsy [Citation8,Citation19].
Conclusion
In conclusion, MRI depicts characteristic patterns at follow-up. On the one hand, in patients with no recurrence, a target-like appearance is the typical pattern at early follow-up and CNE is invariably not seen at early and late follow-up. However, variable degrees of PNE and PBME, and FNC in 55% of the cases are seen at late follow-up. On the other hand, CNE is systematically detectable in patients with clinically evident residual/recurring OB, along with PNE and PBME.
Thus, these results may be helpful in cases with clinically doubtful OB residual/recurring tumor.
Acknowledgement
We acknowledge financial support by the Baden-Württemberg Ministry of Science, Research and the Arts and by Ruprecht-Karls-Universität Heidelberg.
Disclosure statement
No potential conflict of interest was reported by the author(s).
References
- Dahlin DC, Johnson EWJ. Giant osteoid osteoma. J Bone Joint Surg. 1954;36(3):559–572.
- Lucas DR. Osteoblastoma. Arch Pathol Lab Med. 2010;134(10):1460–1466.
- Atesok KI, Alman BA, Schemitsch EH, et al. Osteoid osteoma and osteoblastoma. J Am Acad Orthop Surg. 2011;19(11):678–689.
- Greenspan A. Benign bone-forming lesions: osteoma, osteoid osteoma, and osteoblastoma. Clinical, imaging, pathologic, and differential considerations. Skeletal Radiol. 1993;22(7):485–500.
- Berry M, Mankin H, Gebhardt M, et al. Osteoblastoma: a 30-year study of 99 cases. J Surg Oncol. 2008;98(3):179–183.
- Arrigoni F, Barile A, Zugaro L, et al. CT-guided radiofrequency ablation of spinal osteoblastoma: treatment and long-term follow-up. Int J Hyperth. 2018;34(3):321–327.
- Beyer T, van Rijswijk CSP, Villagrán JM, et al. European multicentre study on technical success and long-term clinical outcome of radiofrequency ablation for the treatment of spinal osteoid osteomas and osteoblastomas. Neuroradiology. 2019;61(8):935–942.
- Weber MA, Sprengel SD, Omlor GW, et al. Clinical long-term outcome, technical success, and cost analysis of radiofrequency ablation for the treatment of osteoblastomas and spinal osteoid osteomas in comparison to open surgical resection. Skeletal Radiol. 2015;44(7):981–993.
- Rehnitz C, Sprengel SD, Lehner B, et al. CT-guided radiofrequency ablation of osteoid osteoma and osteoblastoma: clinical success and long-term follow up in 77 patients. Eur J Radiol. 2012;81(11):3426–3434.
- Rybak LD, Gangi A, Buy X, et al. Thermal ablation of spinal osteoid osteomas close to neural elements: technical considerations. Am J Roentgenol. 2010;195:293–298.
- Lee MH, Ahn JM, Chung HW, et al. Osteoid osteoma treated with percutaneous radiofrequency ablation: MR imaging follow-up. Eur J Radiol. 2007;64(2):309–314.
- Boaz TL, Lewin JS, Chung Y, et al. MR monitoring of MR‐guided radiofrequency thermal ablation of normal liver in an animal model. J Magn Reson Imaging. 1998;8(1):64–69.
- Lazebnik RS, Breen MS, Fitzmaurice M, et al. Radio-frequency-induced thermal lesions: subacute magnetic resonance appearance and histological correlation. J Magn Reson Imaging. 2003;18(4):487–495.
- Nour SG, Aschoff AJ, Mitchell ICS, et al. MR imaging–guided radio-frequency thermal ablation of the lumbar vertebrae in porcine models. Radiology. 2002;224(2):452–462.
- Breen MS, Lazebnik RS, Fitzmaurice M, et al. Radiofrequency thermal ablation: correlation of hyperacute MR lesion images with tissue response. J Magn Reson Imaging. 2004;20(3):475–486.
- Mungo DV, Zhang X, O'Keefe RJ, et al. COX-1 and COX-2 expression in osteoid osteomas. J Orthop Res. 2002;20(1):159–162.
- Kawaguchi Y, Sato C, Hasegawa T, et al. Intraarticular osteoid osteoma associated with synovitis: a possible role of cyclooxygenase-2 expression by osteoblasts in the nidus. Mod Pathol. 2000;13(10):1086–1091.
- Cazzato RL, Auloge P, Dalili D, et al. Percutaneous image-guided cryoablation of osteoblastoma. Am J Roentgenol. 2019;213(5):1–6.
- de Oliveira C, de Camargo B, Pinto E, et al. Classical osteoblastoma, atypical osteoblastoma, and osteosarcoma. A comparative study based on clinical, histological, and biological parameters. Clinics. 2007;62(2):167–174.