
Abstract
Background and Objectives
Postoperative thromboembolism is a significant cause of prolonged recovery in patients undergoing cytoreductive surgery (CRS) and hyperthermic intraperitoneal chemotherapy (HIPEC). Thromboelastography (TEG) can detect hypercoagulable states and predict thromboembolic complications after surgery. This study assessed the impact of CRS and HIPEC on TEG values.
Methods
TEG parameters reaction time (R), kinetics time (K), angle (α), maximum amplitude (MA), and lysis percent at 60 min (LY60) were determined preoperatively, and at the end of CRS, during HIPEC, and at the end of the operation using blood samples from 15 HIPEC patients. Platelets, P-TT, and aPTT were also determined before and after CRS.
Results
A total of 75 samples were analyzed. During CRS, there was a significant reduction in the mean MA (3.06 mm, p = 0.001). The mean P-TT declined by 32% (p < 0.001) and mean platelets by 55 × 109/L (p < 0.001). During HIPEC, the mean R and K shortened by 1.04 min (p = 0.015) and 0.18 min (p = 0.018), respectively, whereas α increased by 2.48° (p = 0.005).
Conclusions
During CRS, both TEG and conventional laboratory tests indicated hypocoagulation. During HIPEC, however, the initiation of coagulation and the kinetics of thrombin formation were accelerated.
1. Introduction
Cytoreductive surgery (CRS) followed by hyperthermic intraperitoneal chemotherapy (HIPEC) has become an established treatment of peritoneal malignancies such as pseudomyxoma peritonei, abdominal mesothelioma and colon carcinoma with peritoneal carcinomatosis. Despite advances in surgery and anesthesiology, perioperative morbidity remains high (12 − 67.6%) while mortality has varied between 0 and 18% [Citation1–4].
Despite adequate mechanical and pharmacological prevention, postoperative thromboembolism remains a significant cause of prolonged recovery and hospital stay. The overall incidence of symptomatic thromboembolism (deep venous thrombosis, DVT or pulmonary embolism, PE) after major oncologic surgery is 2–5% [Citation5], while after HIPEC procedure it varies between 4 and 10% [Citation6]. There are only few studies where DVT was systematically screened by ultrasound or venography after oncologic surgery. In these studies, venous thrombosis was diagnosed in 8–13% of patients [Citation7–9]. Most of these thromboses were asymptomatic. None of these studies investigated HIPEC patients. In addition to active cancer, prolonged surgery and immobilization as well as an increase in body temperature during HIPEC all predispose patients to thromboembolic complications [Citation10–12].
Thromboelastography (TEG) measures the viscoelastic properties of blood from initiation of the coagulation process to fibrinolysis. Traditionally, TEG has been used to guide blood component therapy during major surgery and trauma [Citation13–15]. In addition, TEG has been demonstrated to be able to detect hypercoagulable states and predict thromboembolic complications after surgery [Citation6,Citation16,Citation17]. From TEG parameters short R (reaction time) and K (kinetics time), large α (angle), elevated MA (maximum amplitude) and low LY60 (percent lysis at 60 min, reduced lysis) are considered as signs of hypercoagulation [Citation6,Citation18,Citation19].
In this study, we assessed the impact of HIPEC on TEG values. According to our hypothesis, cytoreductive surgery followed by HIPEC modulates TEG values toward enhanced coagulation.
2. Material and methods
The inclusion criteria for the study were ASA I-II patients aged 18 − 85 years, who underwent cytoreductive surgery and HIPEC in Oulu University Hospital between 2015 and 2017. The study protocol was approved by the Ethical Committee of the Northern Osthrobothnia Hospital District (reference number 75/2014). Written informed consent was obtained from all subjects.
Antithrombotic treatment
On admission to the hospital 1 day before surgery, a Doppler ultrasound was performed to each patient to exclude existing deep venous thromboembolism. Enoxaparine 40 mg sc was given in the preoperative evening of the preoperative day and continued 6 h after surgery at an elevated dose of 40 mg x 2 sc 4 weeks after the operation. In addition, a sequential compression device was used for thrombosis prophylaxis during surgery and the postoperative period.
Anesthesia
An epidural catheter and a central venous catheter were inserted to each patient one day before surgery. An arterial cannula was inserted into the radial artery upon arrival to the OR. Thereafter, anesthesia was induced with propofol, remifentanil, and rocuronium and maintained with desflurane, remifentanil, and rocuronium. During HIPEC desflurane was exchanged to propofol infusion. The depth of anesthesia and muscle relaxation was guided by GE Healthcare Entropy and Neuromuscular transmission (NMT) monitoring devices, respectively. Arterial pressure, central venous pressure, stroke volume variation (LiDCO® monitoring device, LiDCo), oxygen saturation, end-tidal carbon dioxide, ECG, diuresis, esophageal temperature, and urinary bladder temperature were monitored throughout the procedure. Temperatures in the upper and lower stomach were also monitored during the HIPEC phase.
Intraoperative treatment
Techniques of cytoreductive surgery and peritonectomy procedures have been described elsewhere [Citation20]. During the operation, normothermia was maintained by using warm fluids, a thermal blanket and the Arctic Sun cooling/heating device (Bard Medical). To maintain fluid balance, balanced crystalloid Plasmalyte® (Baxter) was infused at a fixed rate of 100 mL/h. Blood loss was compensated by a balanced crystalloid solution (Plamalyte®), albumin (Albuman®, Sanguin), fresh frozen plasma (OctaplasLG®, Octapharma), and packed red blood cells as necessary. Prior to HIPEC the fluid balance was evaluated and to accelerate diuresis, 10 mg of intravenous furosemide was given to each patient.
After the cytoreductive stage (CRS) of the operation was completed, 43–44° C saline was infused into the intraperitoneal cavity by Terumo Pump System (Terumo Medical Corporation), or by Belmont Rapid Infuser (Belmont Instrument Corporation). After the intraabdominal temperature of minimum 41 °C was reached, Mitomycin C 50 mg/kg, divided into three proportions, was administered into the circumforaneous fluid in 30 min intervals. The duration of HIPEC was 90 min in each patient. During HIPEC the patients were actively cooled by Arctic Sun cooling device, cold fluid infusions and cooling packs around the upper body and head to prevent the rise of core body temperature above 37 °C. After HIPEC, surgery was completed by performing GI-tract anastomoses and ostomies when needed. Following abdominal closure, the patients were transferred to the intensive care unit (ICU).
Data collection
Patient characteristics including gender, age, height, weight, comorbidities, ASA risk classification score and peritoneal carcinosis index (PCI) were recorded. The amount of bleeding and intravenous fluids including blood products and were obtained.
The duration of CRS was determined from the incision to the administration of the cytostatic drug. The duration of the operation was determined from the incision to the end of the procedure. The duration of HIPEC was constant (90 min) and therefore the duration of the operation was dependent on the complexity of the surgery.
Blood sampling
For TEG analyses, samples were taken the day before operation (T1), after CRS (T2), after 40 min of HIPEC (T3), after 80 min of HIPEC (T4) and at the end of the procedure (T5). For preoperative sample collection we used 7 F 2 lumen Argon Hydrocath Assure catheter or 20 Gauge Terumo needles for venipuncture if a central venous line was not available. All intraoperative samples were collected from the central venous catheter [Citation21]. The samples were drawn into Vacutainer tubes containing 3.2% citrate. For quality assurance, two samples were analyzed at every time point to detect possible errors in sample preparation.
Arterial blood acid-base status, blood gases, and Hb was measured at time points T2-T5. The samples were taken via the arterial cannula simultaneously with blood sampling for the TEG analyses. From conventional laboratory testing, platelet count (B-Thromb, normal range 150–360 × 109/L), thromboplastin time (P-TT, normal range 70–130%)) and activated partial thromboplastin time (APTT, normal range 28–37 s) were determined at T1 and T2 (before and after CRS) and on demand (bleeding).
TEG analyses
The TEG analyses were performed according to manufacturer’s guidelines by a single trained study nurse or by the first author both experienced in TEG analytics. Citrated blood samples were stored at room temperature and analyzed 30 min after collection. The samples were recalcified before analyses and kaolin was used as an initiator in each test. Two computerized TEG® analyzers (TEG 5000 Thromboelastograph® Hemostasis System, Haemonetics Corporation, Niles, USA) with four separate channels were used. The TEG analyzers were calibrated and tested regularly.
The TEG values analyzed were reaction time (R, normal range 4–8 min), kinetics time (K, normal range 1–3 min), angle (α, normal range 55–78°), MA (normal range 51–69 mm) and LY60 (normal range 0–15%). R reflects the initiation of coagulation and is dependent on coagulation factors and affected by anticoagulants. K and α reflect the kinetics of thrombin formation and are also affected by anticoagulants. MA reflects the maximum strength of the clot and is affected by the amount and activity of thrombocytes and fibrinogen. LY60 measures the percent lysis based on the reduction of the area under the TEG tracing and represents the fibrinolytic process during the entire 60 min after MA is reached [Citation22]. For this study hypercoagulation was determined as a 1 min shortening in R or a 5 mm elevation in MA whereas hypocoagulation was determined as 1 min prolongation in R or 5 mm reduction in MA.
Data analysis and statistics
The data were analyzed using Statistical Package for the Social Sciences (SPSS) for Windows (IBM Corp., released 2016: IBM SPSS Statistics for Windows, Version 24 .0. Armonk, NY: IBM Corp) and SAS (version 9.4, SAS Institute Inc., Cary, NC, USA). Patients acted as their own controls, i.e., TEG values measured intraoperatively were compared to each individual`s own TEG values. Repeatedly measured data were analyzed using linear mixed model (LMM) using patients as random effects. If P-time (Ptime) was significant according to LMM, then a pairwise comparison between time points was performed. Mean differences with 95% confidence intervals (95% CI) are presented. To assess the correlation between continuous variables the Spearman´s correlation coefficient (rho) was calculated. A two-tailed p < 0.05 was considered statistically significant. Power analyses for the study population size could not be conducted due to the lack of previous studies on TEG values in HIPEC surgery. This was a convenience sample considering our surgical volume.
3. Results
Patients and clinical data
During the study period 25 patients, who gave the consent to participate, were scheduled for CRS and HIPEC. 10 patients, who did not receive HIPEC, were excluded, leaving 15 patients for the final analysis. Hypertension was the most common comorbidity. One patient had mild renal insufficiency as an adverse effect of earlier chemotherapy of lymphoma. Most of the patients were overweight or obese; one patient was slightly underweight with a BMI of 17.5. The demographic data of the patients are summarized in .
Table 1. Patient and operation characteristics.
Appendix was the most common origin of carcinoma (10/15). The majority (67%) of patients were having a PCI below 20 while one patient had a PCI of 0. This patient had undergone CRS 2 months earlier without HIPEC in another hospital but due to the histological classification (invasive mucinous appendiceal adenocarcinoma with peritoneal metastasis), HIPEC was performed.
Perioperative hemorrhage varied from 100 to 1900 mL and was associated with the stage of peritoneal carcinomatosis and organ manifestations (spleen, liver). On the day before surgery, the mean hemoglobin concentration was 131 g/l (SD 20.4). During the operation the mean hemoglobin concentration was 109 g/l (SD 18.7) at T2, 101 g/l (SD 16.0) at T3, 100 g/l (SD 13.5) at T4 and 105 g/l (SD 15.8) at T5. Five patients required RBC transfusion based on our transfusion limit of 80 g/l. None required platelets. Fresh frozen plasma was given to two patients. All blood products were given before the HIPEC phase, during CRS. Albumin (4%) was used to maintain normovolemia in 12 patients during CRS phase. None of the patients received either blood products or albumin during the HIPEC phase.
The mean pH was 7.4(SD 0.5) at each time point. The mean base excess (BE) was −2.5(SD 2.5) at T2, −4.0(SD 3.3) at T3, −4.5(SD 2.9) at T4 and −3.9(SD 2.2) at T5. None of the patients developed acidosis (pH < 7.2). However, 10 patients had BE below −2.5 during HIPEC.
5/15 patients were hyperthermic during HIPEC (core temp >38). The mean temperature in the upper stomach was 41.9 °C (40.8–43 °C) and in lower stomach 41.8 °C (40.8-42.8 °C). In one patient upper stomach temperature was not measured due to technical failure.
Altogether, 75 blood samples were analyzed. The main results of TEG and traditional coagulation assays are summarized in . presents the mean changes between time points. further describes the changes of R and MA.
Figure 1. (a) The individual changes of TEG parameters reaction time (R, min); (b) maximum amplitude (MA, mm). Dashed line represents the median values. (Ptime for the change over study period).
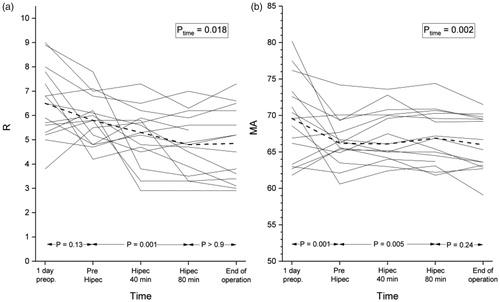
Table 2. Mean values with standard deviation (SD) and median of TEG parameters during the study period.
Table 3. Mean change of tests between time points with 95% confidence interval (95% CI).
CRS
Before the operation, R was reduced in one patient and elevated in two patients while MA was elevated in eight patients. Other TEG parameters were normal in all patients. In 5/15 patients, preoperative albumin level was below its lower limit of 36 g/l. There was no correlation between BMI and preoperative albumin level in this study population. Furthermore, there was no correlation between BMI or preoperative albumin and preoperative TEG values.
During CRS, there was a statistically significant reduction in MA. The mean change between T1 and T2 was 3.06 mm (p = 0.001). There was a strong correlation between bleeding and the reduction of MA (rho = 0.679, p = 0.008) and the volume of intravenous fluid administered and the reduction of MA (rho = 0.757, p = 0.002).
Using a 5 mm reduction in MA as a threshold value for hypocoagulation, five patients became hypocoagulative during CRS, and in two patients the reduction was more than 10 mm. These five patients had a high PCI (>17) and a long duration of CRS (>680 min). Four of these patients received packed red blood cells and one received fresh frozen plasma. The MA at the end of CRS was within normal range in all patients.
During CRS, the mean reduction in P-TT was 32.1% (p < 0.001) while in APTT there was no statistically significant change. The mean reduction in platelet count was 55.1 × 10⁹/L (p < 0.001) but none of the patients developed thrombocytopenia.
HIPEC
During HIPEC (T2-T4) there were statistically significant changes in R, K and α. The mean reduction in R was 1.04 min (p = 0.015). Using a 1 min shortening of R as a threshold value for hypercoagulation, 8/15 (53%) of the patients became hypercoagulative during HIPEC. There was no significant correlation between the reduction of R and core temperature, PCI, age, bleeding, volume of intravenous fluid infused or blood products given.
Recovery
During the recovery phase (from the end of HIPEC to the end of the operation, T4–T5), there were no significant changes in any TEG parameters.
Whole HIPEC procedure
From the preoperative day to the end of the procedure, there was a significant shortening in the median R (1.69 min, p = 0.002), an elevation in α (−3.13°, p = 0.019) and K (0.16 min, p = 0.047), and a reduction in MA (3.64 mm, p < 0.001) and LY60 (3.42%, p = 0.002) values.
4. Discussion
To the best of our knowledge, this is the first study reporting TEG values during HIPEC procedure. During CRS there was a minor reduction in MA. During HIPEC, however, we observed a shortening in R, reflecting enhanced initiation of coagulation, and a prolongation in K and an elevation in α, suggesting acceleration in the kinetics of thrombin formation. These changes were not normalized during the recovery phase. Considering the whole HIPEC procedure, there was also a reduction in LY60 indicating reduced lysis. Except for the reduction in MA during CRS, all these changes are known to be associated with enhanced coagulation [Citation6,Citation16,Citation17].
A recent study by Falcon et al. [Citation23] used thromboelastometry (ROTEM) to examine coagulation status during CRS and HIPEC with partly contradictory results compared to ours. During CRS, they observed a decrease in maximum clot firmness in FIBTEM test indicating decreased fibrinogen levels, and a prolongation of clotting time in EXTEM test suggesting declined clotting factor activity [Citation23]. Despite the minor decrease in the mean MA during CRS in our series, which positively correlated with the amount of bleeding and the volume of intravenous fluid infused, only five patients showed hypocoagulation when a 5 mm reduction in MA and a 1 min prolongation in R were used as threshold values. Furthermore, in none of these patients the TEG changes triggered the treatment threshold. During HIPEC there were no further changes in ROTEM parameters in the study of Falcon et al. [Citation23], while our findings indicate enhanced coagulation. We defined hypercoagulation as a 1 min shortening of R or a 5 mm elevation in MA. Using this definition, 8/15 patients became hypercoagulative during HIPEC. The hypercoagulative changes were not related to age, PCI, bleeding, infused fluid volume or increased core temperature.
There are several differences between the Falcon et al. and our studies which may explain the differences between the results. First, the primary location of the tumor varied. In our study the most common diagnose was mucinous tumor of appendix compared to ovarian cancer in the ROTEM study. In our patients the mean PCI was higher (16 vs 12). The duration of CRS was twice as long in our study (700 vs. 336 min). The chemotherapy used also varied between these two studies. Although we used mitomycin C in each patient, only 17% received mitomycin C in the ROTEM study while others received either cisplatin or paclitaxel. It is unclear, whether the reported temperature of 41.5 °C of intraperitoneal fluid was measured from the abdominal cavity or from the pump system. We measured the temperatures both from the upper and lower stomach during HIPEC and the temperatures varied between these two locations. However, it seems that in our study the temperatures were higher at least in some parts of the abdominal cavity. Furthermore, Falcon et al. do not report the volume of intravenously infused fluid or bleeding during CRS.
Regarding the conventional coagulation tests previous studies on HIPEC procedure have demonstrated hypocoagulation with possible development of DIC during surgery and the perioperative period [Citation24–27]. We used P-TT, APTT and platelet count as conventional testing for blood coagulation during CRS. We observed a significant reduction in P-TT but no change in APTT. Thrombocytopenia (platelets <100 × 109) was not detected in any patient. Two patients received fresh frozen plasma. All blood products were given during the CRS phase, several hours before the HIPEC phase.
We believe that the enhanced coagulation during the HIPEC phase is a relevant finding since there are several explanations for accelerated coagulation in HIPEC patients. First, previous studies have demonstrated that extended surgery itself causes hypercoagulative changes in TEG [Citation16,Citation28,Citation29]. In addition, a reduction of lysis has been demonstrated during prostate surgery [Citation30]. In the present study, however, we observed hypocoagulative changes during CRS which were plausibly associated with the higher volume of hemorrhage compared to traditional abdominal and urological surgery. Second, a rise in core temperature has been demonstrated to result in a reduction of R and an elevation of MA [Citation11,Citation12]. During HIPEC the temperature in abdominal cavity is typically raised to 41–42 °C facilitating the rise of core temperature up to 39 °C in some patients. In this study, R, K, and α were altered toward increased coagulation during HIPEC. However, we were not able to detect correlation between increased core temperature and TEG values. Third, hypovolemia has been speculated to enhance coagulation, at least in the presence of hyperthermia [Citation11]. In our study, volume status was carefully evaluated and normovolemia was maintained throughout the operation. Also, there was no change in pH during the operation.
The impact of mitomycin C on coagulation status has also been speculated [Citation31] Mitomycin C induces vascular endothelial cell injury which may result in activation of platelets and the clotting cascade [Citation31]. No studies are investigating the impact of mitomycin C on TEG parameters.
In this study, we used human albumin solution in 12 patients to maintain normovolemia. The role of albumin in terms of blood coagulation is controversial. In vitro, low albumin level increased ROTEM maximum clot firmness [Citation32]. On the other hand, extreme dilution with albumin is associated with coagulopathy in TEG [Citation33]. In vivo, the administration of albumin during major surgery had only a minor effect on TEG MA and blood loss and, importantly, no effect on TEG R time [Citation34].
Taken together, we suggest that the underlying mechanism of enhanced coagulation in this patient population is the high intraabdominal temperature during HIPEC combined with mitomycin C. This combination may facilitate local endothelial cell damage and inflammation in the abdominal cavity and activate blood coagulation. This is supported by a recent study, which showed significant increases in serum interleukin-6 (IL-6), procalcitonin and Ca-125 in peritoneal fluid during HIPEC procedure [Citation35]. Increased IL-6 expression is known to induce a prothrombotic state with inhibition of natural inhibitors of hemostasis. To current knowledge, inflammation and IL-6 expression are linked to thromboembolic complications [Citation36,Citation37].
Weaknesses
This study has some weaknesses. We acknowledge that this was only a preliminary pilot study, which limits the generalizability of our results. However, despite the small sample size we observed statistically significant changes in TEG parameters indicating hypercoagulation. We, therefore, believe that evaluating the clinical consequences of our findings in a larger cohort is warranted. In addition, the exact mechanism of the enhanced coagulation remains open. According to our results, a study comparing, for example, the effect of two cytostatic drugs on coagulation during HIPEC phase to show a 10% reduction (from 53 to 43%) in the proportion of patients with hypercoagulation with a power of 0.8 and an alpha of 0.05 would require 388 patients in each group, respectively.
According to our thrombosis prevention protocol, enoxaparine 40 mg sc was started in the preoperative evening after the T1 samples were collected. This may have some impact on the comparison of preoperative TEG values to perioperative values. However, there was a minimum of 16 h delay between enoxaparine administration and T2 samples, suggesting only a minor effect of enoxaparine to our results.
Albumin levels were not determined during the operation in this study. The effect of perioperative albumin administration to TEG values can be speculated. However, both albumin and blood products were given during CRS.
TEG as a method is highly dependent on manual processes. In this study, all samples were collected and analyzed by either a trained study nurse or the first author. We used only citrated venous samples and two samples were analyzed at each time point for quality control. TEG devices were calibrated and tested regularly.
5. Conclusions
During CRS both TEG and conventional laboratory tests indicate hypocoagulation. However, during HIPEC with mitomycin C and after the procedure TEG parameters demonstrate enhanced initiation of coagulation with accelerated kinetics of thrombin formation. Consequently, the patients undergoing HIPEC may have an elevated risk of thromboembolic events postoperatively. The clinical significance of our findings requires further investigation.
Acknowledgements
The authors appreciate the expertise of study nurse, Sinikka Sälkiö, in sample logistics and the TEG method.
Disclosure statement
No potential conflict of interest was reported by the author(s).
Additional information
Funding
References
- Kapoor S, Bassily-Marcus A, Alba Yunen R, et al. Critical care management and intensive care unit outcomes following cytoreductive surgery with hyperthermic intraperitoneal chemotherapy. WJCCM. 2017;6(2):116–123.
- Mehta SS, Gelli M, Agarwal D, et al. Complications of cytoreductive surgery and HIPEC in the treatment of peritoneal metastases. Indian J Surg Oncol. 2016;7(2):225–229.
- Mohamed F, Moran BJ. Morbidity and mortality with cytoreductive surgery and intraperitoneal chemotherapy: the importance of a learning curve. Cancer J. 2009;15(3):196–199.
- Wong EYT, Tan GHC, Chia CSL, et al. Morbidity and mortality of elderly patients following cytoreductive surgery and hyperthermic intraperitoneal chemotherapy (HIPEC). Asia Pac J Clin Oncol. 2018;14(2):e193–e202.
- Samama C, Boubli L, Coloby P, et al. Venous thromboembolism prophylaxis in patients undergoing abdominal or pelvic surgery for cancer – a real-world, prospective, observational french study: PRéOBS. Thromb Res. 2014;133(6):985–92.
- McCrath DJ, Cerboni E, Frumento RJ, et al. Thromboelastography maximum amplitude predicts postoperative thrombotic complications including myocardial infarction. Anesth Analg. 2005;100(6):1576–1583.
- Sugimachi K, Tajiri H, Kinjo N, et al. Incidence and predictors of deep venous thrombosis after abdominal oncologic surgery: prospective doppler ultrasound screening. J Surg Res. 2012;178(2):657–661.
- Rasmussen MS, Jørgensen LN, Wille-Jørgensen P. Prolonged thromboprophylaxis with low molecular weight heparin for abdominal or pelvic surgery. Cochrane Database Syst Rev. 2009;(1):CD004318.
- Kakkar VV, Balibrea JL, Martinez-Gonzalez J, et al. On Behalf Of The Canbesure Study Group. Extended prophylaxis with bemiparin for the prevention of venous thromboembolism after abdominal or pelvic surgery for cancer: the CANBESURE randomized study. J Thromb Haemost. 2010;8(6):1223–1229.
- Vukadinovic V, Chiou JD, Morris DL. Clinical features of pulmonary emboli in patients following cytoreductive surgery (peritonectomy) and hyperthermic intraperitoneal chemotherapy (hipec), a single centre experience. Eur J Surg Oncol. 2015;41(5):702–706.
- Meyer MAS, Ostrowski SR, Overgaard A, et al. Hypercoagulability in response to elevated body temperature and central hypovolemia. J Surg Res. 2013;185(2):e93–e100.
- Pivalizza EG, Koch SM, Mehlhorn U, et al. The effects of intentional hyperthermia on the thrombelastograph and the sonoclot analyser. Int J Hyperthermia. 1999;15(3):217–223.
- Da Luz LT, Nascimento B, Shankarakutty AK, et al. Effect of thromboelastography (TEG(R)) and rotational thromboelastometry (ROTEM(R)). Crit Care. 2014;18(5):518–014.
- Shore-Lesserson L, Manspeizer HE, DePerio M, et al. Thromboelastography-guided transfusion algorithm reduces transfusions in complex cardiac surgery. Anesth Analg. 1999;88(2):312–319.
- Westbrook AJ, Olsen J, Bailey M, et al. Protocol based on thromboelastograph (TEG) out-performs physician preference using laboratory coagulation tests to guide blood replacement during and after cardiac surgery: a pilot study. Heart Lung Circ. 2009;18(4):277–288.
- Kashuk JL, Moore EE, Sabel A, et al. Rapid thrombelastography (r-TEG) identifies hypercoagulability and predicts thromboembolic events in surgical patients. Surgery (USA). 2009;146(4):764–774.
- Toukh M, Siemens DR, Black A, et al. Thromboelastography identifies hypercoagulablilty and predicts thromboembolic complications in patients with prostate cancer. Thromb Res. 2014;133(1):88–95.
- Park MS, Martini WZ, Dubick MA, et al. Thromboelastography as a better indicator of hypercoagulable state after injury than prothrombin time or activated partial thromboplastin time. J Trauma Inj Infect Crit Care. 2009;67(2):266–275.
- Liu C, Guan Z, Xu Q, et al. Relation of thromboelastography parameters to conventional coagulation tests used to evaluate the hypercoagulable state of aged fracture patients. Medicine (Baltimore). 2016;95(24):e3934.
- Elias D, Di Pietrantonio D, Boulet T, et al. Natural history” of complete cytoreductive surgery with hyperthermic intraperitoneal chemotherapy. Eur J Surg Oncol. 2009;35(4):434–438.
- Tuovila M, Erkinaro T, Savolainen ER, et al. The impact of sample site and storage on thromboelastography values. Am J Hematol. 2017;92(8):E160–E162.
- Vig S, Chitolie A, Bevan DH, et al. Thromboelastography: a reliable test?. Blood Coagul Fibrinolysis. 2001;12(7):555–561.
- Falcon Arana L, Fuentes-Garcia D, Roca Calvo MJ, et al. Alterations in hemostasis during cytoreductive surgery and hyperthermic intraperitoneal chemotherapy in patients with peritoneal carcinomatosis. Cir Esp. 2015;93(8):496–501.
- Bell JC, Rylah BG, Chambers RW, et al. Perioperative management of patients undergoing cytoreductive surgery combined with heated intraperitoneal chemotherapy for peritoneal surface malignancy: a multi-institutional experience. Ann Surg Oncol. 2012;19(13):4244–4251.
- Preti V, Chang D, Sugarbaker PH. Pulmonary complications following cytoreductive surgery and perioperative chemotherapy in 147 consecutive patients. Gastroenterol Res Pract. 2012;2012:1–8.
- Sargant N, Roy A, Simpson S, et al. A protocol for management of blood loss in surgical treatment of peritoneal malignancy by cytoreductive surgery and hyperthermic intraperitoneal chemotherapy. Transfusion Med. 2016;26(2):118–122.
- Schmidt C, Creutzenberg M, Piso P, et al. Peri-operative anaesthetic management of cytoreductive surgery with hyperthermic intraperitoneal chemotherapy. Anaesthesia. 2008;63(4):389–395.
- Mahla E, Lang T, Vicenzi MN, et al. Thromboelastography for monitoring prolonged hypercoagulability after major abdominal surgery. Anesth Analg. 2001;92(3):572–577.
- Thorson CM, Van Haren RM, Ryan ML, et al. Pre-existing hypercoagulability in patients undergoing potentially curative cancer resection. Surgery. 2014;155(1):134–144.
- Ziegler S, Ortu A, Reale C, et al. Fibrinolysis or hypercoagulation during radical prostatectomy? an evaluation of thrombelastographic parameters and standard laboratory tests. Eur J Anaesthesiol. 2008;25(7):538–543.
- Nagaya S, Wada H, Oka K, et al. Hemostatic abnormalities and increased vascular endothelial cell markers in patients with red cell fragmentation syndrome induced by mitomycin C. Am J Hematol. 1995;50(4):237–243.
- Paar M, Rossmann C, Nusshold C, et al. Anticoagulant action of low, physiologic, and high albumin levels in whole blood. PLoS One. 2017;12(8):e0182997.
- Hammad Y, Elmoghazy W, El Ansari W, et al. Experimental effect of different dilutions of blood with human plasma protein fraction and large dose factor one on blood coagulation and chemistry in vitro. Indian J Anaesth. 2019;63(12):1015–1021.
- Rasmussen KC, Hojskov M, Johansson PI, et al. Impact of albumin on coagulation competence and hemorrhage during major surgery: a randomized controlled trial. Medicine (Baltimore). 2016;95(9):e2720.
- Coccolini F, Corbella D, Finazzi P, et al. Time course of cytokines, hemodynamic and metabolic parameters during hyperthermic intraperitoneal chemotherapy. Minerva Anestesiol. 2016;82(3):310–319.
- Jezovnik MK, Fareed J, Poredos P. Patients with a history of idiopathic deep venous thrombosis have long-term increased levels of inflammatory markers and markers of endothelial damage. Clin Appl Thromb Hemost. 2017;23(2):124–131.
- Vazquez-Garza E, Jerjes-Sanchez C, Navarrete A, et al. Venous thromboembolism: thrombosis, inflammation, and immunothrombosis for clinicians. J Thromb Thrombolysis. 2017;44(3):377–385.