
Abstract
Objectives
Contrast-enhanced computed tomography (CECT) is used to monitor technical success immediately after hepatic microwave ablation (MWA). However, it remains unclear, if CECT shows the exact extend of the thermal destruction zone, or if tissue changes such as peri-lesionary edema are depicted as well. The objective of this study was to correlate immediate post-interventional CECT with histological and macroscopic findings in hepatic MWA in porcine liver in vivo.
Methods
Eleven MWA were performed in porcine liver in vivo with a microwave generator (928 MHz; energy input 24 kJ). CECT was performed post-interventionally. Livers were explanted and ablations were bisected immediately after ablation. Samples were histologically analyzed after vital staining (NADH-diaphorase). Ablation zones were histologically and macroscopically outlined. We correlated histologic findings, macroscopic images and CECT.
Results
Three ablation zones were identified in histological and macroscopic findings. Only one ablation zone could be depicted in CECT. Close conformity was observed between histological and macroscopic findings. The ablation zone depicted in CECT overestimated the histological avital central zone and inner red zone (p < = .01). No differences were found between CECT and the histological outer red zone (p > .05).
Conclusions
Immediate post-interventional CECT overestimated the clinically relevant zone of complete cell ablation after MWA in porcine liver in vivo. This entails the risk of incomplete tumor ablation and could lead to tumor recurrence.
Introduction
The treatment of hepatic metastases of colorectal cancer represents a challenge in clinical practice. Less than 30% of patients with liver metastases are resectable at the time of diagnosis [Citation1]. While surgical resection is usually regarded as therapy of choice for colorectal liver metastases, tumor ablation has long been degraded to an alternative therapy option for non-resectable liver metastases. Nowadays, thermal tumor ablation, like hepatic microwave ablation (MWA), gains importance in the development of individualized therapeutic concepts [Citation1]. Contrary to surgical resection, a histopathologic proof of complete tumor control is not possible after MWA, since MWA is an in-situ ablation technique [Citation2]. Therapeutic success can only be assessed indirectly by imaging techniques. Technique efficacy, according to complete tumor ablation is usually performed at a prospectively defined time point (for example 24–48 h after ablation) to monitor complete tumor necrosis [Citation3]. However, an immediate adjustment of the ablation is not possible at that time anymore. Therefore, immediate post-interventional imaging is regularly used as a monitoring technique in clinical practice to verify that the targeted ablation volume was reached [Citation4]. Ultrasound (CEUS) and computed tomogragphy (CECT) are the most popular contrast enhanced imaging techniques to assess immediate post-interventional success [Citation3,Citation5,Citation6]. While CEUS is susceptible to vaporization, CECT is fast, widely available and reproducible and is therefore most often used to verify technical success immediately after MWA [Citation7,Citation8]. However, ablations appear homogenously hypodense in contrast enhanced CT-scans, since CT has relatively poor soft-tissue contrast [Citation9–12]. Histologically, MWA consists of two ablation zones, an inner ‘white zone’ and an outer ‘red zone’ [Citation3]. While a complete coagulation with loss of cell structure is observed in the white zone, damaged but partly vital cells do remain in the surrounding red zone. Therefore, the importance of the red zone is still discussed. While some studies include the red zone to the measurement of the ablation zone, others exclude it [Citation3]. In order to describe MWA correctly, both ablations zones, the white zone and the red zone, should be mentioned for an accurate description of an ablation zone [Citation3]. So far, it remains unclear, which ablation zone can be seen in CECT imaging immediately after ablation. This is especially important, since no statement about the extent of the critical red zone with incomplete coagulation can be made.
Objective
The objective of the current study was to correlate CECT with histology to assess, if immediate post-interventional CECT scans can accurately assess the irreversible destruction zone of hepatic microwave ablation. We hypothesize that there is a correlation between immediate post-interventional CECT and the clinically relevant white zone in MWA.
Material and methods
Animals and anesthesia
Eleven microwave ablations (MWA) were planned in female domestic pigs. Animals were purchased from a local farm and housed in the Department of Experimental Medicine (certified by ISO 9000 and ISO 8000) for at least 10 days before the experimental procedure. Animals were kept at room temperature between 15 and 24 °C. A regular day and night rhythm was obtained. The weight of the animals was 76.5 kg (67.0–88.4) and the age was 170 days (105–188). Animals were anesthetized by intramuscular (i.m.) injection of ketamine 10% (24.0 mg/kg, UrsotaminTM, Serumwerk Bernburg) and azaperone (180 mg/animal, StresnilTM, Janssen Animal Health). A separate i.m. injection of xylazine (2.7 mg/kg, RompunTM, Bayer Vital GmbH) and atropine (0.01 mg/kg, atropine sulfate B. Braun, 0.5 ml/ml, B. Braun) was given to stabilize anesthesia. Each animal received an additional i.m. injection of 2.0 μg/kg Fentanyl (Fentanyl 0.5 mg, Rotexmedica GmbH) for pain relief. A constant intravenous (i.v.) administration of ketamine and xylazine (8.4 ml/h, ratio ketamine/xylazine: 2.8:1) maintained the anesthesia. Electrolyte solution (Sterofundin, B. Braun Melsungen AG) and lactated Ringer’s solution (Fresenius Kabi Deutschland GmbH) were infused intravenously according to physiological requirements.
All in vivo experiments were approved by the office for health and social welfare (Landesamt für Gesundheit und Soziales, LAGeSo, Berlin, Germany, G0032/16). Principles of the European guidelines for laboratory animal welfare were fulfilled.
Microwave ablation
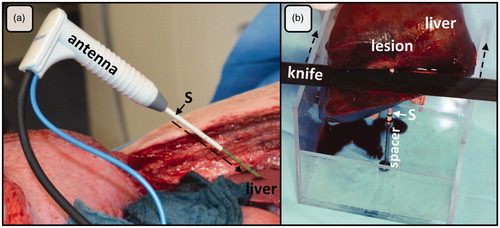
Microwave ablation was performed with a microwave generator equipped with a temperature and power feedback mode (MWI881, AveCure™, MedWaves Inc.). The generator used a dynamic frequency range in between 902 and 928 MHz. The ablation was automatically controlled by the preinstalled MW energy delivery protocol. The same protocol is used in clinical practice and is able to adapt the frequency to tissue permittivity changes during ablation. A 14-G microwave antenna with an active length of 40 mm (size: ‘large’, AveCure™, MedWaves Inc.) was used for the experiments. Ablation temperature is measured at the tip of the antenna during an ablation procedure and shown on the generator display in real time. A coaxial cable was used to connect the antenna to the generator. The target energy input for all ablations was 24 kJ. Applicators were positioned under visual and manual control within the liver on the opened abdominal cavity. Laparotomy was preferred in contrast to a transcutaneous approach to ensure an exact positioning of the antenna within the thin porcine liver. In particular, a malposition of the antenna between two hepatic lobes could be avoided by the open approach. A plastic sleeve was positioned along the antenna’s tract before withdrawing the antenna and performing post-interventional CT imaging. This plastic sleeve was used to reduce interfering artifacts in CECT and was subsequently used to identify the ablation center after liver removal (). Ablations were preferably performed as far as possible in the periphery of the liver to avoid major hepatic vessels.
Figure 1. (a) Open ablation via laparotomy along the right costal arch. A plastic sleeve (S), placed over the antenna (A) shaft, was used to mark the ablation. After MWA, the plastic sleeve was advanced (dashed arrow) into the liver tissue (L) exactly to the center of the ablation. (b) Ablations were cut at the tip and perpendicular to the plastic sleeve (S) with the help of a custom-made aiming device. This experimental setting ensured an exact and reproducible evaluation of ablations.
Contrast-enhanced computed tomography (CECT) imaging
CT scans were performed before and after each MWA with an 80-detector MDCT scanner (Aquilion PRIME, Canon Medical Systems) using a multi-phase protocol after intravenous contrast medium application (100 ml Imeron 400 MCT, Bracco Imaging Deutschland GmbH, Konstanz, Germany). The following parameters were used: Voltage 120 kV, maximum 400 mA, mean mAs 260; collimated layer thickness: 80 × 0.5 mm, 40 mm total detector width; 0.5 s rotation speed, pitch factor 0.813. CT scans were evaluated using the portalvenous phase with the highest contrast of liver tissue to ablation zone. Plastic sleeves antennas were removed before performing CECT and the plastic sleeves were advanced.
Ablation processing
Livers were explanted immediately after euthanasia of the animals with T61 (50 ml, Intervet Deutschland GmbH). Ablations were cut in half through the ablation center orthogonally to the antenna. A custom-made aiming device ensured a standardized and reproducible cutting process using the plastic sleeves as a guide (). A digital acquisition of the macro-morphological sectional image of the ablation was carried out with a digital camera (D5100, Nikon Corporation).
Samples were embedded in Tissue-Tek® O.C.T.™ Compound (Sakura Finetek Germany GmbH) and shock frozen in liquid nitrogen (−80 °C) for histological processing. Samples were cut with a cryostat (CryoStar™ NX70 Cryostat, ThermoFischer Scientific) in 8–10 μm thick cryosections. Cryosections were stained with a solution of reduced NADH (nicotinamide adenine dinucleotide) and NBTC (nitroblue tetrazolium chloride) to identify vital and non-vital cells [Citation13].
Macroscopic analysis
The macroscopic detection of ablation zones was based on common macro-morphological features [Citation3]. Different ablation zones were identified according to Gemeinhardt et al. [Citation14]:
White Zone (WZ):homogenous, beige gray area
Red Zone 1 (RZ1):rosy-gray area
Red Zone 2 (RZ2):light brown ‘transition zone’, which merges into native liver tissue
Histological analysis
Histological sections were evaluated according to the subsequent scheme. A qualitative analysis of the MWA zones was performed by a state-certified pathologist (R.K.) and was based on the following cellular characteristics:
Complete loss of cell structure,
Cell degeneration with remaining cell boundaries and loss of NADH diaphorase,
Cell structure present, partial maintenance of cell vitality,
Intercellular edema and reduced NADH diaphorase staining,
Hepatocellular separation,
Undamaged liver parenchyma.
A quantitative analysis was performed with an analysis software for histopathological images (Aperio GENIE Image Analysis Tool, Leica Biosystems Imaging Inc, DB Maarn, Netherlands). The software was trained to identify areas with similar histological patterns with respect to predefined cellular properties [Citation15]. Results are presented as color-coded maps of each histological section (). Ablation zones were identified for macroscopic and histologic findings in accordance by two in MWA experienced examiners (F.P. and B.G.).
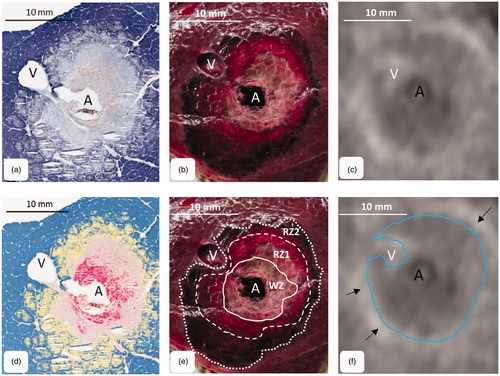
Figure 2. MWA were cut orthogonally to the antenna through the center of the ablation. The figure shows the corresponding cross sections: (a) histology (NADH-staining), (b) macroscopy and (c) CECT-imaging. (d) A chromatic visualization of the histological cross sections was performed with an image analysis software in order to identify different ablation zones. (e) three different ablation zones could be identified macroscopically (mWZ, mRZ1 and mRZ2). (f) A single MWA zone could be identified around the antenna (tissue with lower density compared to native liver tissue). A small hyperdense margin was seen around the ablations (arrows). A: antenna; V: hepatic vein.
CECT scan analysis
CECT scans were analyzed corresponding to the cutting plane of the ablations. The cutting plane of each ablation was identified by the tip of the plastic sleeve, which was clearly visible on CECT scans and was used to identify the cutting plane. A two-dimensional reconstruction of each ablation was performed orthogonally to the plastic sleeve. CECT was analyzed in consensus of above-mentioned examiners (F.P., B.G. and J.V.).
Statistical analysis
Eleven MWA were planned (effect size: 0.7, power: 0.8, α: 0.05 (two sided)). Minimum radius, maximum radius and ablation area were measured for histological sections, macroscopic images and CECT scans. Histological observations were flagged with ‘h’ (hWZ, hRZ1, hRZ2) and macroscopic observations with ‘m’ (mWZ, mRZ1, mRZ2). Radii were measured from the antenna to the ablation border for all ablation zones. The ablation areas (WZ, RZ 1 and RZ 2) were defined as the complete area situated within the borders of the corresponding ablation zone.
Statistical analysis was conducted with statistics software (SPSS Version 24, IBM Corp). Data are expressed as median (minimum–maximum). The Mann–Whitney U test was used for comparisons between two independent groups. The level of significance was 0.05 (two sided) for each statistical testing.
Results
Eleven microwave ablations were performed in seven female pigs. All ablations were manually stopped at an energy input of 24.0 kJ. The median ablation time was 13 min 32 s (12:34–16:35). The median maximum ablation temperature at the tip of the antenna was 103 °C (70–121).
Qualitative analysis
Three different ablation zones could be identified histologically in all samples. A zone of complete structural cell loss with avital cells was observed in the ablation center around the antenna (). This zone corresponded to the histological ‘white zone’ (hWZ). A fringe of cell degeneration with remaining cell boundaries, but loss of NADH diaphorase staining was seen around the white zone. This zone of mostly damaged but partially vital cells was called ‘red zone 1’ (hRZ1). A zone of hepatocellular separation, intercellular edema and reduced cell viability was situated around the red zone 1. This zone of lower cellular damage merged gradually into native liver tissue and was defined as histological ‘red zone 2’ (hRZ2).
The macroscopic ablation area showed zones of different coloration peripherally around the antenna (). A brownish carbonization zone was observed directly around the antenna. This zone was surrounded by a light white-gray coagulation zone, the mWZ. The mWZ was enclosed by a reddish-gray transition zone. A small, circular hemorrhagic fringe was seen between the red zone 1 and the native liver tissue. This hemorrhagic fringe enclosed the ablation completely. This transition zone belonged to mRZ2.
Antennas were removed after positioning a plastic sleeve within the ablation and before performing post-interventional CECT. Moderate interfering artifacts could be observed around the plastic sleeves in the CT scans. A single MWA zone could be identified around the antenna as tissue with lower density compared to native liver tissue (). A small hyperdense margin was seen around the ablations. This hyperdense margin gradually merged into native liver tissue. A visual differentiation between the three histologically described ablation zones was not possible.
Quantitative analysis
shows the results of the quantitative analysis. Only one value is listed for CT, since only one ablation zone could be identified in the CECT scans in the qualitative analysis. This zone was defined by the relatively sharp transition from the tissue with lower density to the hyperdense margin around the ablation zone. The hyperdense margin around the ablation was not included in the CECT measurement, since it gradually merged into native liver tissue. While differences between the ablation areas of hWZ, mWZ and CT, as well as between the hRZ1, mRZ1 and CT were measured, no difference could be demonstrated between hRZ2, mRZ2 and CT ().
Figure 3. Comparison of histological, macroscopic area and CECT. While CECT overestimated hWZ and hRZ1, CECT most likely correlated with hRZ2 (**p < = .01; n.s.: not significant).
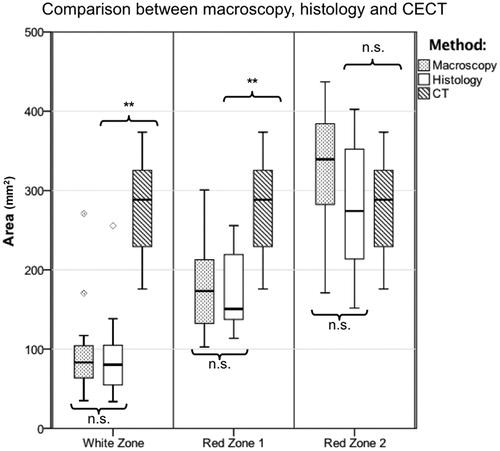
Table 1. Median (minimum–maximum) radii and ablation areas for histology, macroscopy and CT (n = 11 ablations).
Discussion
The aim of this study was to compare histological and macroscopic findings with immediate post-interventional CECT in hepatic MWA. Three ablation zones could be identified histologically and macroscopically (white zone: WZ, red zone 1: RZ1, red zone 2: RZ2). Only one single, hypodense, ablation zone could be depicted in CECT. Close conformity could be seen for macroscopic and histological findings. Therefore, an analysis of ablations, for example in experimental test settings, can be performed with macroscopic images. CECT overestimated the white zone, the zone of immediate complete cell death, by threefold (p < = .01), while the histological red zone 1 was overestimated by more than double (p < = .01). No difference was found between CECT and the histological red zone 2 (hRZ2; p > .05). Therefore, CECT most likely corresponded to red zone 2.
Two phases of cell destruction have to be discriminated in thermal ablation: In the first phase, an immediate coagulation of tissue occurs, due to direct thermal injury. Indirect cell damage follows in the second phase [Citation16]. This process starts immediately after the ablation and can last up to several weeks [Citation17,Citation18]. The phase of direct injury was evaluated in the actual study. Complete tissue necrosis was observed only within the white zone, which was demarcated by NADH-staining [Citation16]. Vital cells remained in the surrounding red zone. CECT was only able to depict the extension of the red zone (consisting of red zone 1 and 2). Therefore, CECT overestimated the area of definite tissue necrosis (white zone). Similar results regarding the histological structure and CECT findings have been reported for hepatic MWA and RFA, performed a few days after ablation [Citation18–20].
The impact of the red zone is still discussed controversially in literature. While some authors exclude the red zone, others include it in the evaluation of ablation zones [Citation20,Citation21]. Tsuda et al. examined time-related changes of RFA in rabbit liver [Citation17]. The study described three ablation zones (central zone, middle zone and marginal zone) at the third day after ablation, which merged into two layers (central zone: necrosis, marginal zone: fibrous tissue) within the second post-interventional week. According to the study by Tsuda et al., it seems likely, that the hRZ1 turns into complete necrosis during the course of time, while hRZ2 remains transition (marginal) zone. Considering this second phase of indirect injury, the long-term accuracy of immediate post-interventional CECT rises.
However, the extension of the hRZ2 still remains a crucial factor of uncertainty, since the hRZ2 is included in the hypodense ablation area depicted in CECT. Our study supports the established procedure of performing follow-up imaging at a given time, since the development of the ablation zones in the course of time outlines theoretical considerations and is not investigated in our study [Citation3]. Nevertheless, immediate post-interventional CECT remains an important tool to assure technical success of an ablation. CECT is able to detect the correct position of the ablation in relationship to the target tumor. A second ablation may be performed in the same intervention, if the tumor is covered insufficiently by the ablation visible in CECT [Citation22]. A safety margin around the tumor seems to be reasonable not only to reduce the risk of tumor recurrence due to microsatellite metastases, but also in order to reduce the factor of uncertainty due to the unknown inner extension of the ablation zone within the CECT lesion. There is some evidence that advanced CT technologies like CT-perfusion or subtraction-CT are superior to CECT in detecting ablation zones more precisely, but these techniques are not common clinical practice so far [Citation23,Citation24].
Our study has some limitations. Ablations were performed in healthy porcine liver. To our best knowledge, there is no hepatic tumor model for swine. However, it has to be assumed that the assessment of MWA by CT imaging is similar to ablations of tumor, since the border of MWA should be situated within native liver tissue in order to avoid tumor recurrence. We were only able to analyze small ablations due to the size of the microscope slice. Therefore, we planned ablations with diameters smaller than 30 mm. While larger ablations would be desirable, a complete histological analysis of larger ablation zone would not be feasible. Minor deviation could occur in the identification of the corresponding cutting plane due to manipulation of the tissue by the cutting process. The impact of tissue shrinkage caused by the tissue fixation for histological preparation is not clear and was therefore not taken into account in this study.
In conclusion, immediate post-interventional CECT is incapable of distinguishing between the ablation zones that are visible in histological and macroscopic findings. The zone of direct cell death (white zone) is overestimated by CECT.
Disclosure statement
The authors of this manuscript declare no relationships with any companies, whose products or services may be related to the subject matter of the article.
Additional information
Funding
References
- Hackl C, Neumann P, Gerken M, et al. Treatment of colorectal liver metastases in Germany: a ten-year population-based analysis of 5772 cases of primary colorectal adenocarcinoma. BMC Cancer. 2014;14(1):810.
- De Cobelli F, Marra P, Ratti F, et al. Microwave ablation of liver malignancies: comparison of effects and early outcomes of percutaneous and intraoperative approaches with different liver conditions: new advances in interventional oncology: state of the art. Med Oncol. 2017;34(4):49.
- Ahmed M, Solbiati L, Brace CL, et al. Image-guided tumor ablation: standardization of terminology and reporting criteria–a 10-year update. J Vasc Interv Radiol JVIR. 2014;25(11):1691–1705.e4.
- Kaye EA, Cornelis FH, Petre EN, et al. Volumetric 3D assessment of ablation zones after thermal ablation of colorectal liver metastases to improve prediction of local tumor progression. Eur Radiol. 2019;29(5):2698–2705.
- Engstrand J, Toporek G, Harbut P, et al. Stereotactic CT-guided percutaneous microwave ablation of liver tumors with the use of high-frequency jet ventilation: an accuracy and procedural safety study. AJR Am J Roentgenol. 2017;208(1):193–200.
- Bouda D, Lagadec M, Alba CG, et al. Imaging review of hepatocellular carcinoma after thermal ablation: the good, the bad, and the ugly. J Magn Reson Imaging. 2016;44(5):1070–1090.
- Schumann C, Rieder C, Bieberstein J, et al. State of the art in computer-assisted planning, intervention, and assessment of liver-tumor ablation. Crit Rev Biomed Eng. 2010;38(1):31–52.
- Asvadi NH, Anvari A, Uppot RN, et al. CT-guided percutaneous microwave ablation of tumors in the hepatic dome: assessment of efficacy and safety. J Vasc Interv Radiol JVIR. 2016;27(4):496–502.
- Goldberg SN, Gazelle GS, Mueller PR. Thermal ablation therapy for focal malignancy: a unified approach to underlying principles, techniques, and diagnostic imaging guidance. AJR Am J Roentgenol. 2000;174(2):323–331.
- Sainani NI, Gervais DA, Mueller PR, et al. Imaging after percutaneous radiofrequency ablation of hepatic tumors: Part 1, Normal findings. AJR Am J Roentgenol. 2013;200(1):184–193.
- Stattaus J, Kuehl H, Ladd S, et al. CT-guided biopsy of small liver lesions: visibility, artifacts, and corresponding diagnostic accuracy. Cardiovasc Intervent Radiol. 2007;30(5):928–935.
- Lee MW, Rhim H, Cha DI, et al. Percutaneous radiofrequency ablation of hepatocellular carcinoma: fusion imaging guidance for management of lesions with poor conspicuity at conventional sonography. AJR Am J Roentgenol. 2012;198(6):1438–1444.
- Neumann RA, Knobler RM, Pieczkowski F, et al. Enzyme histochemical analysis of cell viability after argon laser-induced coagulation necrosis of the skin. J Am Acad Dermatol. 1991;25(6):991–998.
- Gemeinhardt O, Poch FGM, Hiebl B, et al. Comparison of bipolar radiofrequency ablation zones in an in vivo porcine model: Correlation of histology and gross pathological findings. Clin Hemorheol Microcirc. 2017;64(3):491–499.
- Plancoulaine B, Laurinaviciene A, Meskauskas R, et al. Digital immunohistochemistry wizard: image analysis-assisted stereology tool to produce reference data set for calibration and quality control. Diagn Pathol. 2014; 9(S1):S8.
- Vanagas T, Gulbinas A, Pundzius J, et al. Radiofrequency ablation of liver tumors (I): biological background. Med Kaunas Lith. 2010;46(1):13–17.
- Tsuda M, Rikimaru Y, Saito H, et al. Radiofrequency ablation of rabbit liver: correlation between dual CT findings and pathological findings. Nihon Igaku Hoshasen Gakkai Zasshi. 2002;62(14):816–821.
- Awad MM, Devgan L, Kamel IR, et al. Microwave ablation in a hepatic porcine model: correlation of CT and histopathologic findings. HPB. 2007;9(5):357–362.
- Raman SS, Lu DS, Vodopich DJ, et al. Creation of radiofrequency lesions in a porcine model: correlation with sonography, CT, and histopathology. AJR Am J Roentgenol. 2000;175(5):1253–1258.
- Lee JM, Han JK, Lee JY, et al. Hepatic radiofrequency ablation using multiple probes: ex vivo and in vivo comparative studies of monopolar versus multipolar modes. Korean J Radiol. 2006;7(2):106–117.
- Ng KK, Lam CM, Poon RT, et al. Porcine liver: morphologic characteristics and cell viability at experimental radiofrequency ablation with internally cooled electrodes. Radiology. 2005;235(2):478–486.
- Zimmermann M, Kuhl C, Keil S. Characteristic changes of the ablation zone on contrast-enhanced computed tomography after radiofrequency ablation of hepatic metastases. Indian J Radiol Imaging. 2018;28(3):320–326.
- Bressem KK, Vahldiek JL, Erxleben C, et al. Instant outcome evaluation of microwave ablation with subtraction CT in an in vivo porcine model. Invest Radiol. 2019;54(6):333–339.
- Thieme SF, Vahldiek JL, Tummler K, et al. Value or waste: perfusion imaging following radiofrequency ablation - early experience. Clin Hemorheol Microcirc. 2015;61(2):323–331.