
Abstract
Objectives
To compare sizes and shapes of ablation zones resulting from hydrochloric acid infusion radiofrequency ablation (HRFA) and microwave ablation (MWA), using normal saline infusion radiofrequency ablation (NSRFA) as a control, at a variety of matched power settings and ablation durations, in an ex vivo bovine liver model.
Methods
A total of 90 ablation procedures were performed, using each of three modalities: NSRFA, HRFA, and MWA. For each modality, five ablation procedures were performed for each combination of power (80 W, 100 W, or 120 W) and duration (5, 10, 20, 30, 45, or 60 min). The size of ablation zones were compared using ANOVA, the Kruskal-Wallis test, or generalized linear regression.
Results
For ablation durations up to 30 min, mean transverse diameter (TD) after HRFA and MWA did not differ significantly (β = 0.13, p = .20). For ablation durations greater than 30 min, mean TD was significantly larger after HRFA than after MWA (β = 1.657, p < .001). The largest TD (9.46 cm) resulted from HRFA performed with 100 W power for 60 min.
Conclusions
Compared to MWA, monopolar HRFA with power settings of 80 W–120 W and durations of less than 30 min showed no significant difference. When duration of more than 30 min, HRFA created larger ablation zones than MWA.
Introduction
Thermal ablation is an efficient and safe treatment for primary and metastatic liver tumors, especially for hepatocellular carcinoma (HCC) when the tumor diameter is less than 3 cm [Citation1,Citation2]. Commonly used modalities for HCC include radiofrequency ablation (RFA) and microwave ablation (MWA), both of which destroy biological tissues by frictional heating of small particles [Citation3].
Normal saline infusion RFA (NSRFA) is a widely-accepted method of RFA that has been used to ablate a lesion up to 3 cm [Citation4,Citation5], making it difficult to use this modality to achieve a complete ablation with safe margins in a large subset of HCC. The ablation size of NSRFA is still limited because the impedance caused output power fall, resulting in roll-off phenomenon [Citation6,Citation7]. Consequently, incomplete tumor ablation increases the risks of residual tumor, early recurrences, and even subsequent tumor metastases [Citation8].
Microwave ablation (MWA) is another form of thermal ablation. Comparing to NSRFA, MWA produces a higher heat efficiency and requires a shorter ablation duration to achieve similar results [Citation9,Citation10]. However, MWA has its limitation that mostly ablation length was achieved in the first 15 min, around 5 cm, after which the size of ablation zone would increase much slower [Citation11]. This limitation makes MWA still difficult to destroy a lesion larger than 5 cm.
In the search for other options, particularly for larger hepatic tumors, hydrochloric acid has been proposed as an alternative to normal saline as a perfusate to be used with RFA. Hydrochloric acid infusion RFA (HRFA) at a power setting of 30 W for 30 min has been shown in ex vivo animal liver models to increase the size of the ablation zone by as much as 4.49 cm [Citation12–14] and the HRFA showed a similar safety comparing to NS-RFA in in vivo study [Citation15]. However, the power settings used for HRFA in previous studies was up to 60 W, so the impact of performing HRFA at higher powers is unknown. Furthermore, to our knowledge, no studies have been published which compare HRFA and MWA using matched power settings and ablation durations.
The aim of this study was to compare ablation zone sizes and shapes, using HRFA and MWA, with NSRFA as a control, at a variety of matched power settings and ablation durations, in an ex vivo bovine liver model. A secondary aim was to confirm that a “silt-like” zone, which has previously been identified within ablation zones after HRFA [Citation12–15], was present exclusively after HRFA, and to determine if the size of this “silt-like” zone correlated with the size of the HRFA ablation zone.
Materials and methods
This study didn’t involve human subjects and we didn’t obtain approval of Institutional Review Board. A total of 90 fresh ex vivo bovine livers were obtained from a local slaughterhouse to use for only this prospective study. This model was chosen because of the difficulty in finding livers thicker than 5 cm in living animals, such as rabbits and pigs. The protocols and analyses were performed between October 2015 and October 2017. Raw data of the present study had been deposited into the Research Data Deposit (www.researchdata.org.cn, RDDN: RDDB2020000857).
Equipment
For RFA, a temperature-controlled RF generator (Model 1500×, AngioDynamics, RITA Medical Systems, Queensbury, New York, USA) was used to deliver RF energy to a perfusion RF electrode at selected power settings and durations. The perfusion RF electrode (UniBlate, RITA Medical Systems, Queensbury, New York, USA) was a 17-guage monopolar perfused electrode, with 2 infusion holes at the tip through which the perfusates, normal saline (NS) or 10% hydrochloric acid (HCl), were infused at a rate of 0.2 ml/min. The active tip of this electrode was 3 cm.
For MWA, a VISON-GEN microwave generator with a single output channel (Vison-China Medical Devices R&D Center, Nanjing, P. R. China) was used to deliver MW energy to the MW antenna at a frequency of 2450 MHz. The MW antenna (VISON-PROBE, Vison-China Medical Devices) was a single-use coaxial interstitial microwave antenna measuring 14 gauge in diameter and 18 cm in length.
Ablation protocols
A total of 90 ablation procedures were performed using each of the three modalities: NSRFA, HRFA, and MWA. For each modality, five ablation procedures were performed for each combination of power (80 W, 100 W, or 120 W) and duration (5, 10, 20, 30, 45, or 60 min).
For all procedures, the active tip of the electrode or antenna was inserted into the central part of the specimen, to a depth of at least 5 cm. During RFA, either 10% HCl (Huayi Medical Auxiliary Materials Manufacturing Co., Ltd, Chengdu, P. R. China) or normal saline were pumped through the infusion holes into the liver tissues as the RF energy was delivered as our previous study had confirmed that concentration of 10%, comparing to 5% or 15%, could create a larger ablation zone [Citation15]. During MWA, no liquid was infused into the liver tissue.
Ablation zone measurements
After the ablation procedures were completed, each ablation zone was identified within the liver by incising along the plane of the ablation applicator insertion path. The ablation zones were defined macroscopically as those areas of liver tissue around the electrode having a grey-white discoloration. The silt-like zones were defined as areas of tissue within the ablation zones that were located centrally around the electrode, had the appearance of moist sediment [Citation13].
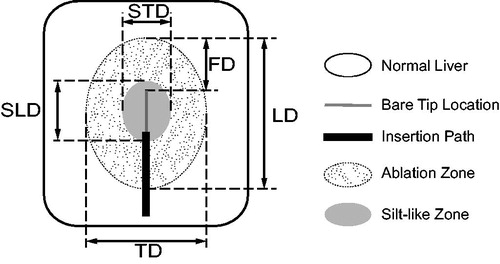
Ablation and silt-like zone measurements were performed by two investigators (ZTQ and DHX, 3–5 years’ experience), who were not blinded, and who settled differences by consensus (). For each ablation zone or silt-like zone, the longitudinal diameter (LD) was defined as the distance along the electrode insertion path, the transverse diameter (TD) was defined as the maximum distance perpendicular to the longitudinal axis, and the front distance (FD) was defined as the distance from the applicator tip to the end of the longitudinal diameter along the insertion path. The volume (V) of each ablation zone was calculated according to the formula: V = 1/6 × π × LD × TD2. The spherical ratio (SR) of each ablation zone was calculated according to the formula: SR = TD/LD [Citation15]. Similarly, in HRFA, the transverse diameter, longitudinal diameter and volume of central “silt-like zone” was described as STD, SLD and SV, respectively.
Figure 1. Ablation zone measurement. For each ablation zone, longitudinal diameter (LD) defined as distance along electrode insertion path, transverse diameter (TD) defined as maximum distance perpendicular to longitudinal axis, and front distance (FD) defined as distance from applicator tip to end of longitudinal diameter along insertion path. For silt-like zone within ablation zone, longitudinal diameter (SLD) defined as distance along electrode insertion path and transverse diameter (STD) defined as maximum distance perpendicular to longitudinal axis.
Primary outcome parameters
TD and V were prospectively selected as the primary outcome parameters with which to compare the sizes of the ablation and silt-like zones produced from the different ablation procedures. TD was chosen because it depends directly on ablation modality, power, and duration, and it is frequently used to determine whether complete ablation of a target lesion has been achieved. Conversely, LD is used less often to determine success, and it can be modified by using applicators with different active tip lengths [Citation16]. As in our previous work, SR was used to characterize the shape of each ablation zone, with a higher SR suggesting a more spherical ablation zone [Citation15].
Statistical methods
Outcome parameter results (LD, TD, FD, V, SR, SLD, STD, and SV) were reported as means and standard deviations for each different combination of ablation modality, power setting, and ablation duration. For FD, medians were also calculated.
The correlations between outcomes and parameters were evaluated by general linear regression and reported as R2 with p-values. To compare the contributions of different modalities to outcomes, generalized linear regression was used and reported as β with 95% confidence intervals and p-values. The difference between power groups within a specific modality was evaluated by Kruskal-Wallis H test and reported as H with p-values. To compare the difference of outcomes between different modality groups when applied the same parameters, we used one-way analysis of variance (ANOVA) and reported as F with p-values
Results were considered statistically significant for p < .05. Statistical analyses were performed using the IBM SPSS Statistics, Version 25.0 (IBM Corp, Armonk, New York, USA).
Results
In general, the ablation zones after NSRFA were ellipsoid and did not contain well-distinguished silt-like or charring zones, whereas those after HRFA were spherical and contained well-distinguished silt-like zones, and those after MWA were ellipsoid and contained well-distinguished charring zones (). Mean TD, V, and SR tended to increase with increasing power settings and ablation durations, for all three ablation modalities, though there were a few exceptions as noted below ().
Figure 2. Macroscopic photographic images, longitudinal view, of characteristic ablation zones after normal saline infusion radiofrequency ablation (NSRFA), hydrochloric acid infusion radiofrequency ablation (HRFA), and microwave ablation (MWA), ablation durations of either (A) 20 min or (B) 60 min. Key findings: [Citation1] NSRFA ablation zone with no silt-like or charring zones identified: (A) 20 min ablation duration: transverse diameter (TD) 2.8 cm × longitudinal diameter (LD) 3.7 cm, spherical ratio (SR) 0.75, ellipsoid shape, (B) 60 min ablation duration: TD 3.2 cm × LD 3.8 cm, SR 0.84, more spherical than ellipsoid shape; [Citation2] HRFA ablation zone with well-distinguished silt-like zone (3 white arrows): (A) 20 min ablation duration: TD 5.4 cm × LD 5.8 cm, SR 0.93, spherical shape, (B) 60 min ablation duration: TD 8.1 cm × LD 8.7 cm, SR 0.93, spherical shape; [Citation3] MWA ablation zone with well-distinguished charring zone (2 white arrows), but no silt-like zone identified: (A) 20 min ablation duration: TD 4.6 cm × LD 6.4 cm, SR 0.71, ellipsoid shape, (B) 60 min ablation duration: TD 6.5 cm × LD 7.3 cm, SR 0.89, ellipsoid shape.
![Figure 2. Macroscopic photographic images, longitudinal view, of characteristic ablation zones after normal saline infusion radiofrequency ablation (NSRFA), hydrochloric acid infusion radiofrequency ablation (HRFA), and microwave ablation (MWA), ablation durations of either (A) 20 min or (B) 60 min. Key findings: [Citation1] NSRFA ablation zone with no silt-like or charring zones identified: (A) 20 min ablation duration: transverse diameter (TD) 2.8 cm × longitudinal diameter (LD) 3.7 cm, spherical ratio (SR) 0.75, ellipsoid shape, (B) 60 min ablation duration: TD 3.2 cm × LD 3.8 cm, SR 0.84, more spherical than ellipsoid shape; [Citation2] HRFA ablation zone with well-distinguished silt-like zone (3 white arrows): (A) 20 min ablation duration: TD 5.4 cm × LD 5.8 cm, SR 0.93, spherical shape, (B) 60 min ablation duration: TD 8.1 cm × LD 8.7 cm, SR 0.93, spherical shape; [Citation3] MWA ablation zone with well-distinguished charring zone (2 white arrows), but no silt-like zone identified: (A) 20 min ablation duration: TD 4.6 cm × LD 6.4 cm, SR 0.71, ellipsoid shape, (B) 60 min ablation duration: TD 6.5 cm × LD 7.3 cm, SR 0.89, ellipsoid shape.](/cms/asset/8c46514e-febe-4dc9-97b6-f6cbc8b0baa5/ihyt_a_1772995_f0002_c.jpg)
Table 1. Mean ablation zone transverse diametersTable Footnotea, volumesTable Footnoteb, and spherical ratiosTable Footnotec after hydrochloric acid infusion radiofrequency ablation (HRFA), microwave ablation (MWA), and normal saline infusion radiofrequency ablation (NSRFA), by power settings and ablation durations, in ex vivo bovine livers.
Ablation zone transverse diameter (TD)
In general, mean TD was significantly larger after HRFA or MWA than after NSRFA (HRFA vs. NSRFA: β = 3.428 [95% CI: 3.182, 3.674], p < .001; MWA vs. NSRFA: β = 2.790 [95% CI: 2.544, 3.036], p < .001). When only HRFA and MWA were compared, mean TD after ablation did not differ significantly with ablation durations up to 30 min (β = 0.13 [95% CI: −0.07, 0.33], p = .20); however, with ablation durations of 45 min and 60 min, mean TD was significantly larger after HRFA than after MWA (β = 1.657, [95% CI: 1.37, 1.94], p < .001).
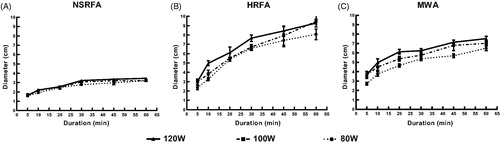
For HRFA, mean TD maintained a more uniform rise as ablation duration increased with treatment at 100 W, whereas for treatment at 80 W or 120 W, mean TD tended to level off after ablation duration of 30 min (). In addition, for ablation durations up to 30 min, mean TD resulting from ablation at the 3 different power settings did not differ significantly (H = 2.96, p = .23). However, for ablation durations longer than 30 min, mean TD resulting from ablation at the 100 W and 120 W power settings were both significantly larger than those from ablation at 80 W (H = 10.95, p = .02; H = 9.75, p = .04; respectively); mean TD resulting from ablation at 100 W and 120 W did not differ significantly (H = 1.20, p = 1.00).
Figure 3. Transverse diameters (TD) of ablation zones after normal saline infusion radiofrequency ablation (NSRFA), hydrochloric acid infusion radiofrequency ablation (HRFA), and microwave ablation (MWA) in ex vivo bovine livers, at various power settings (80 W, 100 W, and 120 W) and ablation durations ranging from 5 to 60 min. Maximum mean TD for all three ablation modalities achieved with 120 W power and 60 min ablation duration. Key findings: (A) Maximum mean TD with NSRFA was 3.46 cm; mean TD positively correlated with ablation duration (R2 = 0.80, p < .001), but not with power (R2 = 0.027, p = .12); (B) Maximum mean TD with HRFA was 9.46 cm; mean TD positively correlated with ablation duration (R2 = 0.86, p < .001), but not with power (R2 = 0.037, p = .07); (C) Maximum mean TD with MWA was 7.52 cm; mean TD positively correlated with both ablation duration (R2 = 0.75, p < .001) and power (R2 = 0.12, p = .001).
Ablation zone volume (V)
For each power-duration combination, mean ablation zone V was significantly larger after HRFA or MWA than after NSRFA (HRFA vs. NSRFA: β = 138.24 [95% CI: 121.40, 155.08], p < .001; MWA vs. NSRFA: β = 107.83 [95% CI: 90.99, 124.67], p < .001) (). When only HRFA and MWA were compared, mean V after ablation did not differ significantly with ablation durations up to 30 min (β = −6.17 [95% CI: −15.00, 1.57], p = .11); however, with treatment durations of 45 min and 60 min, mean V was significantly larger after HRFA than after MWA (β = 104.66 [95% CI: 78.80, 130.52], p < .001).
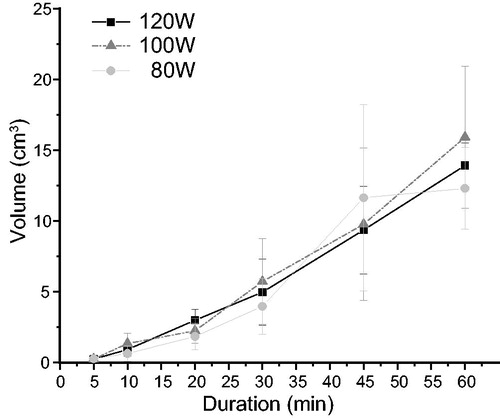
Figure 4. Volumes (V) of ablation zones after normal saline infusion radiofrequency ablation (NSRFA), hydrochloric acid infusion radiofrequency ablation (HRFA), and microwave ablation (MWA) in ex vivo bovine livers, at (A) a power setting of 100 W with ablation durations ranging from 5 to 60 min, and (B) a power setting of 100 W with the highest ablation durations (30, 45, and 60 min). In graph (A), dotted line represents NSRFA results, unbroken line represents HRFA results, and broken line represents MWA results. Bracketed vertical lines represent 95% confidence intervals (CI). Key findings: (A) Ablation zone mean V was significantly larger after HRFA and MWA than after NSRFA (HRFA vs. NSRFA: β = 138.24 [95% CI:121.40,155.08], p < .001; MWA vs. NSRFA: β = 107.83 [95% CI:90.99,124.67], p < .001); when only HRFA and MWA were compared, mean V after ablation did not differ significantly with ablation durations up to 30 min (β = −6.17 [95% CI: −15.00,1.57], p = .11); however, with treatment durations of 45 min and 60 min, mean V was significantly larger after HRFA than after MWA (β = 104.66 [95% CI: 78.80,130.52], p < .001); (B) When ablation zone mean V was compared for ablation power of 100 W at ablation durations of 30 min and 60 min, it increased by 186.48% (136.45 cm3–390.90 cm3) for HRFA, by 69.40% for MWA (137.74 cm3–233.33 cm3), and by 28.3% for NSRFA (17.45 cm3–22.38 cm3) with the longer ablation duration; at ablation durations of 60 min, mean V after HRFA (390.90 ± 77.98 cm3) was significantly larger than mean V after MWA (233.33 ± 24.06 cm3) (F = 18.64, p<.003).
![Figure 4. Volumes (V) of ablation zones after normal saline infusion radiofrequency ablation (NSRFA), hydrochloric acid infusion radiofrequency ablation (HRFA), and microwave ablation (MWA) in ex vivo bovine livers, at (A) a power setting of 100 W with ablation durations ranging from 5 to 60 min, and (B) a power setting of 100 W with the highest ablation durations (30, 45, and 60 min). In graph (A), dotted line represents NSRFA results, unbroken line represents HRFA results, and broken line represents MWA results. Bracketed vertical lines represent 95% confidence intervals (CI). Key findings: (A) Ablation zone mean V was significantly larger after HRFA and MWA than after NSRFA (HRFA vs. NSRFA: β = 138.24 [95% CI:121.40,155.08], p < .001; MWA vs. NSRFA: β = 107.83 [95% CI:90.99,124.67], p < .001); when only HRFA and MWA were compared, mean V after ablation did not differ significantly with ablation durations up to 30 min (β = −6.17 [95% CI: −15.00,1.57], p = .11); however, with treatment durations of 45 min and 60 min, mean V was significantly larger after HRFA than after MWA (β = 104.66 [95% CI: 78.80,130.52], p < .001); (B) When ablation zone mean V was compared for ablation power of 100 W at ablation durations of 30 min and 60 min, it increased by 186.48% (136.45 cm3–390.90 cm3) for HRFA, by 69.40% for MWA (137.74 cm3–233.33 cm3), and by 28.3% for NSRFA (17.45 cm3–22.38 cm3) with the longer ablation duration; at ablation durations of 60 min, mean V after HRFA (390.90 ± 77.98 cm3) was significantly larger than mean V after MWA (233.33 ± 24.06 cm3) (F = 18.64, p<.003).](/cms/asset/044bdb5e-a288-4a54-9158-217acd41a803/ihyt_a_1772995_f0004_b.jpg)
When ablation zone mean V was compared for ablation power of 100 W at ablation durations of 30 min and 60 min, it increased by 186.48% (136.45 cm3–390.90 cm3) for HRFA, by 69.40% for MWA (137.74 cm3–233.33 cm3), and by 28.3% for NSRFA (17.45 cm3–22.38 cm3) with the longer ablation duration (). At 100 W power and 60 min duration, mean V after HRFA (390.90 ± 77.98 cm3) was significantly larger than mean V after MWA (233.33 ± 24.06 cm3) (F = 18.64, p = .003) ().
Furthermore, mean ablation zone V showed a significant positive correlation with ablation duration on multivariate analysis (R2 = 0.86, p < .001).
Ablation zone spherical ratio (SR)
In general, for all three ablation modalities, mean SR increased with ablation durations up to 20 min to 30 min and then reached a plateau (). The maximum mean SR for HRFA (0.95) was achieved using 100 W power for 60 min, for MWA (0.89) was achieved using 80 W power for 60 min, and for NSRFA (0.86) was achieved using 100 W power for 30 min. SR values closest to 1.0 were indicative of a more spherical than ellipsoid ablation zone.
Ablation zone front distance (FD)
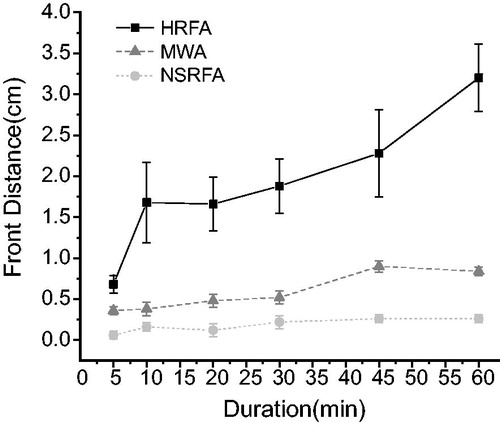
At 100 W power, the median ablation zone FD after HRFA was significantly larger than the median FD after MWA, and the median FD after MWA was significantly larger than the median FD after NSRFA (H = 205.08, p < .001; Multiple comparison adjustment by Bonferroni Test: HRFA vs. MWA, p < .001; MWA vs. NSRFA, p < .001; HRFA vs NSRFA, p < .001) (). The highest mean FD (3.2 cm) was achieved using HRFA at 100 W power for 60 min, and the mean FD positively correlated with HRFA duration (R2 = 0.803, p < .001). In contrast, the mean FD was below 1 cm, using either MWA or NSRFA, for all power settings and ablation durations.
Figure 5. Front distance (FD) of ablation zones after hydrochloric acid infusion radiofrequency ablation (HRFA), microwave ablation (MWA), and normal saline infusion radiofrequency ablation (NSRFA) at power setting of 100 W and different ablation durations, in ex vivo bovine livers. Ablation zone FD defined as the distance from the applicator tip to the end of the longitudinal diameter along the insertion path. Graph shows mean (and standard deviation) FD; however, median FD used for some statistical comparisons. Key findings: median FD after HRFA was significantly larger than after MWA and the median FD after MWA was significantly larger than after NSRFA (H = 205.08, p < .001; multiple comparison adjustment by Bonferroni Test: HRFA vs. MWA, p < .001; MWA vs. NSRFA, p < .001; HRFA vs NSRFA, p < .001); the highest mean FD (3.2 cm) was achieved using HRFA at 100 W power for 60 min, but mean FD created by both NSRFA and MWA was limited to around 1 cm.
Silt-like zone volume (SV)
A silt-like zone was identified within all ablation zones after HRFA, consistent with previously reported findings [Citation12,Citation13,Citation15], but not after MWA or NSRFA. After HRFA, the mean SV correlated significantly with ablation duration (R2 = 0.772, p < .001); however, it did not correlate with power setting (R2 = 0.0004, p = .85) (). Furthermore, after HRFA the mean SV correlated significantly with the ablation zone V, on both univariate and multivariate analyses (R2 = 0.76, p < .001; R2 = 0.76, p < .001; respectively). In addition, the change in SV relative to the change in ablation duration during HRFA was incidentally noted to form a linear regression line at 0.26 ml/min (p < .001), which was similar to the HCl perfusion rate of 0.2 ml/min used during HRFA.
Figure 6. Volumes of “silt-like” zones (SV) after hydrochloric acid infusion radiofrequency ablation (HRFA), at power settings of 80 W, 100 W, and 120 W, and at different ablation durations, in ex vivo bovine livers. Graph shows mean (and standard deviation) SV. The volume of each “silt-like” zone was calculated as: volume = 1/6 × π × longitudinal diameter × (transverse diameter)2. Key findings: (A) Mean volume of the “silt-like” zone correlated with ablation duration (R2 = 0.772, p < .001), but not with power setting (R2 = 0.0004, p = .85). The change in “silt-like” zone mean volume relative to ablation duration was noted to form a linear regression line at 0.26 ml/min (p < .001), which was similar to the HCl perfusion rate of 0.2 ml/min used during HRFA.
Discussion
In the present study involving a liver model, HRFA and MWA were compared to the more widely accepted NSRFA, and both of these alternative approaches resulted in larger ablation zone transverse diameters and volumes than those resulting from NSRFA. In conventional RFA, the contribution of resistive heating, the process by which the passage of an electric current through tissue produces heat, falls off rapidly with increasing distance from the electrode, in proportion to the inverse of the fourth power of the distance from the electrode (1/r4). In practice, resistive heating only occurs within a narrow (< 1 mm) rim of tissue, which is in direct contact with the electrode and is called the heat generating area. The process of coagulative necrosis (i.e. tissue ablation) is then created by the heat that is conducted outward from this heat generating area [Citation17,Citation18]. An unproven theory for why NSRFA is better than conventional RFA is that infusion of normal saline during RFA causes the formation of a “liquid electrode”, which expands the electrode-tissue interface, decreases the current density, and thus increases the ablation volume [Citation16,Citation19].
The presence of the central silt-like zone may provide an explanation for the superior results from HRFA relative to NSRFA. This zone has been observed in our previous work with HRFA [Citation12–15], appearing as a homogeneous red dye-like substance in HE staining [Citation13], and in the current study it was observed again after HRFA (but not after MWA or NSRFA).We noted that unlike in the larger ablation zones, the transverse diameters and volumes of these silt-like zones showed a linear correlation with ablation duration but did not correlate with power settings. We also observed that the change in silt-like zone volume relative to ablation duration (0.26 ml/min) was similar to the HCl perfusion rate (0.2 ml/min) used in this study, which may suggest that the silt-like zone represents the area of tissue into which HCl had diffused during each HRFA procedure.
This unique silt-like zone, possibly created by HCl perfusion, may play a role in the superior ablation zone transverse diameters and volumes observed with HRFA. Our previous study showed that tissue resistance in the silt-like zone was significantly lower than in the rest of the ablation zone [Citation14]. In a radiofrequency circuit, the heat generating area is typically made up of a voltage source and a surrounding low resistance environment [Citation20]. During conventional RFA, the electrode serves as the voltage source and a thin area around the electrode functions as the low resistance environment. But with HRFA, the diffused HCl and silt-like tissue may actually create a much thicker low internal resistance environment [Citation13,Citation15], such that the silt-like zone may effectively act as a large “liquid spherical electrode”, establishing a substantially larger heat generating area than present during conventional RFA or NSRFA. This may greatly expand the electrode-tissue interface and decrease the current density, resulting in a delay in charring and better maintenance of the actual power output. This explanation is consistent with our previous findings that the actual power output of HRFA can be maintained using the same power setting for a long duration, whereas the power output of NSRFA declines after a relatively short time [Citation14,Citation16].
Our study demonstrated no significant difference between HRFA and MWA in the ablation zone transverse diameters during ablation durations up to 30 min. This may be explained by the diameter of the heat irradiation area of MWA (2 cm, based on microwave frequency of 2.45 GHz [Citation21]) being similar to that of the silt-like zone of HRFA during the initial 30 min of ablation. On a related note, our study showed that at ablation durations of at least 30 min and power settings of 80 W–120 W, both MWA and HRFA created ablation zone transverse diameters of at least 5 cm. With this in mind, and given that MWA and requires neither a grounding pad nor liquid perfusion, it may be a better option than HRFA for liver tumors with diameters less than 5 cm.
In contrast to the findings for ablation durations up to 30 min, our study revealed that for ablation durations longer than 30 min, both ablation zone transverse diameters and volumes were significantly larger after HRFA than after MWA. In fact, when ablation zone volumes were compared for ablation durations of 30 min and 60 min at a power setting of 100 W, these volumes increased by just 69.4% for MWA, but by 167.5% for HRFA. Similarly, at ablation durations of 60 min and a power setting of 100 W, the transverse diameters of ablation zones after HRFA (9.46 cm) and MWA (7.02 cm) were significantly different. The more limited increase in the ablation zone volume after MWA was consistent with the results reported by Amabile et al, who noted that 80% of the coagulation zone was achieved within the first 15 min of MWA at most power settings [Citation11]. On a related note, based on additional findings in our study from comparing HRFA at different power settings, when using HRFA for durations longer than 30 min, 100 W should be considered as the preferable power setting, rather than 80 W or 120 W.
Our study also revealed that at all power settings, with ablation durations up to 20 min, the ablation zone spherical ratio after MWA and HRFA did not differ, but that with ablation durations of 30 min or longer, the ablation zone spherical ratio was lower after MWA than after HRFA. A higher spherical ratio suggests a more spherical ablation zone, which is closer to the shape of most liver tumors, and is likely to produce more predictable coverage of tumors and less unintended normal peripheral tissue heat damage. Given these findings, along with the knowledge that longer durations of MWA may increase the risk of antenna damage (FDA report number 1717344-2009-00169), HRFA may be preferable to MWA when longer-duration ablations for tumors larger than 7 cm are indicated. Although another option for larger tumors would be MWA using multiple applicators [Citation22], the use of multi-applicator MWA is associated with higher risks of bleeding and tumor implantation than single-applicator HRFA [Citation23].
Our study also demonstrated that HRFA resulted in a significantly longer ablation zone front distances (i.e. the distance from the applicator tip to the end of the longitudinal diameter along the electrode insertion path) than NSRFA or MWA. A long FD (front distance) has been reported in ablation zones created by umbrella-like multi-array RF electrodes, but not in zones created by monopolar RF electrodes [Citation24]. It’s assumed that when treating a large tumor which is adjacent to gallbladder and gastrointestinal tract, HRFA with large FD would reduce the risk of heat-related injury to those peripheral structure because the electrode could be placed 2–3 cm far from the margin of tumor. Still, further clinical practices would be needed to seek how to take advantage of large FD created by HRFA.
There are limitations in this study. First, the qualities of ex vivo liver tissue may differ from those of live animal or human liver tumor tissue, the most important difference being that there would be blood flow in the liver blood vessels and IVC of live subjects, which could cause the “heat sink” effect. Although it is possible that our results will not transfer directly to live tissues, we considered that performing transarterial embolization (TAE) before HRFA could reduce the heat-sink effect [Citation25]. Nevertheless, it seems likely that the relative differences that we identified between monopolar HRFA, MWA, and NSRFA may be instructive for those using these approaches in live liver tumor tissue. Second, our description of a silt-like zone creating a “liquid spherical electrode” effect is merely theoretical. It is possible that displaying this zone three-dimensionally in the future or measuring the concentration difference of HCl within or outside the silt-like zone may provide additional evidences to support this theory. Third, although “silt-like” zone volume was positively correlated with ablation zone volume in our study, multicollinearity involving “silt-like” zone volume and ablation duration was identified, so that the estimate in our study of the impact of “silt-like” zone volume on ablation zone volume may have been less precise. Fourth, the difference of contraction effects, involution of ablated tissues on immediate postablation, between HRFA and MWA haven’t been measured precisely [Citation26]. Thus, additional investigation into the relationship between “silt-like” zone volume and ablation zone volume is warranted.
Conclusions
HRFA using power settings from 80 W to 120 W and ablation durations of less than 30 min showed no significant difference to MWA. When the duration of more 45 min or 60 min, HRFA achieved significantly larger ablation zone than MWA and may have the potential to treat liver tumors of 5 cm or larger with a safety margin. The optimal power setting for HRFA was 100 W when treating for more than 30 min. The silt-like zone identified exclusively after HRFA suggests the possible existence of a “liquid spherical electrode” effect, which may contribute to the larger ablation zones observed with HRFA.
Disclosure statement
No potential conflict of interest was reported by the author(s).
Correction Statement
This article has been republished with minor changes. These changes do not impact the academic content of the article.
Additional information
Funding
References
- Forner A, Reig M, Bruix J. Hepatocellular carcinoma. The Lancet. 2018;391(10127):1301–1314.
- Ruiter SJS, Heerink WJ, de Jong KP. Liver microwave ablation: a systematic review of various FDA-approved systems. Eur Radiol. 2019;29(8):4026–4035.
- Salati U, Barry A, Chou FY, et al. State of the ablation nation: a review of ablative therapies for cure in the treatment of hepatocellular carcinoma. Future Oncol. 2017;13(16):1437–1448.
- Schmidt D, Trübenbach J, Brieger J, et al. Automated saline-enhanced radiofrequency thermal ablation: initial results in ex vivo bovine livers. AJR Am J Roentgenol. 2003;180(1):163–165.
- Crocetti L, de Baere T, Lencioni R. Quality improvement guidelines for radiofrequency ablation of liver tumours. Cardiovasc Intervent Radiol. 2010;33(1):11–17.
- Chen L, Sun J, Yang X. Radiofrequency ablation-combined multimodel therapies for hepatocellular carcinoma: current status. Cancer Lett. 2016;370(1):78–84.
- Trujillo M, Alba J, Berjano E. Relationship between roll-off occurrence and spatial distribution of dehydrated tissue during RF ablation with cooled electrodes. Int J Hyperthermia. 2012;28(1):62–68.
- Tan L, Chen S, Wei G, et al. Sublethal heat treatment of hepatocellular carcinoma promotes intrahepatic metastasis and stemness in a VEGFR1-dependent manner. Cancer Lett. 2019;460:29–40.
- Meloni MF, Chiang J, Laeseke PF, et al. Microwave ablation in primary and secondary liver tumours: technical and clinical approaches. Int J Hyperthermia. 2017;33(1):15–24.
- Correa-Gallego C, Fong Y, Gonen M, et al. A retrospective comparison of microwave ablation vs. radiofrequency ablation for colorectal cancer hepatic metastases. Ann Surg Oncol. 2014;21(13):4278–4283.
- Amabile C, Ahmed M, Solbiati L, et al. Microwave ablation of primary and secondary liver tumours: ex vivo, in vivo, and clinical characterisation. Int J Hyperthermia. 2017;33(1):34–42.
- Jiang X, Gu Y, Huang J, et al. Ex vivo liver experiment of hydrochloric acid-infused and saline-infused monopolar radiofrequency ablation: better outcomes in temperature, energy, and coagulation. Cardiovasc Intervent Radiol. 2016;39(4):600–605.
- Luo R-G, Fao F, Jin-Hua H, et al. Diluted hydrochloric acid generates larger radiofrequency ablation lesions in excised porcine livers. Diagn Interv Radiol. 2012;19(2):145–149.
- Jiang X-Y, Zhang T-Q, Li G, et al. Increasing radiofrequency ablation volumes with the use of internally cooled electrodes and injected hydrochloric acid in ex vivo bovine livers. Int J Hyperthermia. 2018;35(1):37–43.
- Zhang T-Q, Huang S-M, Gu Y-K, et al. Safety and effect on ablation size of hydrochloric acid-perfused radiofrequency ablation in animal livers. Int J Hyperthermia. 2018;34(7):925–933.
- Ni Y, Mulier S, Miao Y, et al. A review of the general aspects of radiofrequency ablation. Abdom Imaging. 2005;30(4):381–400.
- Miao Y, Ni Y, Yu J, et al. An ex vivo study on radiofrequency tissue ablation: increased lesion size by using an expandable-wet electrode. Eur Radiol. 2001;11(9):1841–1847.
- Longo I, Gentili GB, Cerretelli M, et al. A coaxial antenna with miniaturized choke for minimally invasive interstitial heating. IEEE Trans Biomed Eng. 2003;50(1):82–88.
- Ni Y, Miao Y, Mulier S, et al. A novel “cooled-wet” electrode for radiofrequency ablation. Eur Radiol. 2000;10(5):852–854.
- Smith KC, Smith KCA, Alley RE. Electrical circuits: an introduction. Cambridge: Cambridge University Press; 1992; p. 187–195.
- Brace CL. Radiofrequency and microwave ablation of the liver, lung, kidney, and bone: what are the differences?. Curr Probl Diagn Radiol. 2009;38(3):135–143.
- Harari CM, Magagna M, Bedoya M, et al. Microwave ablation: comparison of simultaneous and sequential activation of multiple antennas in liver model systems. Radiology. 2016;278(1):95–103.
- Yoon J-H, Lee JM, Han JK, et al. Dual switching monopolar radiofrequency ablation using a separable clustered electrode: comparison with consecutive and switching monopolar modes in ex vivo bovine livers. Korean J Radiol. 2013;14(3):403–411.
- Wahba R, Bangard C, Kleinert R, et al. Electro-physiological parameters of hepatic radiofrequency ablation—a comparison of an in vitro versus an in vivo porcine liver model. Langenbecks Arch Surg. 2009;394(3):503–509.
- Zhang Y-J, Chen M-S. Role of radiofrequency ablation in the treatment of small hepatocellular carcinoma. World J Hepatol. 2010;2(4):146–150.
- Brace CL, Diaz TA, Hinshaw JL, et al. Tissue contraction caused by radiofrequency and microwave ablation: a laboratory study in liver and lung. J Vasc Interv Radiol. 2010;21(8):1280–1286.