
 ?Mathematical formulae have been encoded as MathML and are displayed in this HTML version using MathJax in order to improve their display. Uncheck the box to turn MathJax off. This feature requires Javascript. Click on a formula to zoom.
Abstract
Purpose
Most modeling studies on radiofrequency cardiac ablation (RFCA) are based on limited-domain models, which means the computational domain is restricted to a few centimeters of myocardium and blood around the active electrode. When mimicking constant power RFCA procedures (e.g., atrial fibrillation ablation) it is important to know how much power is absorbed around the active electrode and how much in the rest of the tissues before reaching the dispersive electrode.
Methods
3D thorax full models were built by progressively incorporating different organs and tissues with simplified geometries (cardiac chamber, cardiac wall, subcutaneous tissue and skin, spine, lungs and aorta). Other 2D limited-domain models were also built based on fragments of myocardium and blood. The electrical problem was solved for each model to estimate the spatial power distribution around the active electrode.
Results
From 79 to 82% of the power was absorbed in a 4 cm-radius sphere around the active electrode in the full thorax model at active electrode insertion depths of between 0.5 and 2.5 mm, while the impedance values ranged from 104 to 118 Ω, which were consistent with those found (from 83 to 103 Ω) in a 4 cm radius cylindrical limited domain model.
Conclusion
The applied power in limited-domain RFCA models is approximately 80% of that applied in full thorax models, which is equivalent to the power programed in a clinical setting.
Introduction
Radiofrequency (RF) cardiac ablation (RFCA) is a minimally invasive procedure aimed at treating certain types of arrhythmia. During RFCA, electrical current flows between an active electrode (placed on the target site) and a dispersive electrode on the patient’s back. Current density is especially high around the active electrode (due to its small size) and creates a thermal lesion exclusively in the target zone. Computer modeling has been broadly used to study specific issues associated with RFCA [Citation1–13]. As almost all the models simplify reality by including only a relatively small region around the active electrode, the computational domain includes a zone of cardiac tissue and blood whose size depends on preventing the boundary conditions from affecting the results. This dimension can range between a distance of from 12 to 75 mm around the active electrode (12 mm [Citation1], 16 mm [Citation2,Citation3], 19 mm [Citation4], 25 mm [Citation5,Citation6], 30 mm [Citation7], 40 mm [Citation8–11], 44 mm [Citation12], 75 mm [Citation13]). All of these can be considered limited-domain models since they do not include the entire electrical circuit from the active electrode to the dispersive through the thorax tissues (see ).
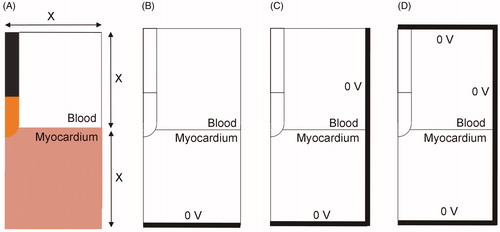
Figure 1. (A) Full thorax model and limited-domain model used to study RF cardiac ablation. (B) In the limited-domain model only a portion of the electrical circuit between active electrode and dispersive electrode is considered. The part of the total power delivered by the RF generator (P0 = V0 × I0) that is applied to a limited-domain model is PMOD = I02 × ZMOD.
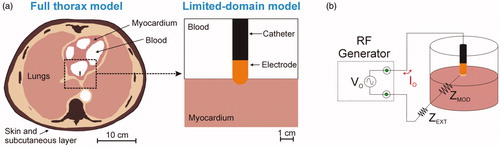
Although limited-domain models may be appropriate to study temperature distributions around the active electrode, they implicitly assume that all the power delivered by the RF generator (P0 = V0 × I0 in ) is absorbed by the volume around the active electrode (i.e., across the impedance ZMOD in ). This actually has a theoretical justification: when the active electrode is inserted in homogeneous tissue and is assumed to be much smaller than the dispersive electrode, the area of the tissue around the active electrode can be increased without significantly changing baseline impedance [Citation14], which in practical terms means that the RF power absorbed around the active electrode remains unchanged. The problem is that this simplification assumes that RF current is flowing through homogenous tissues until it reaches the boundary, represented by the large dispersive electrode. This situation ignores two important facts: 1) the current actually passes through tissues with different electrical conductivities (bone, lung, skin, etc.), and 2) the cross-section is gradually reduced as we approach the dispersive electrode, increasing the value of the current density, especially at its edges [Citation15].
To our knowledge, only Shahidi and Savard’s computer model [Citation16] took the entire electrical circuit into account and included three types of tissue between the active and dispersive electrodes: blood, cardiac wall, and thorax. Their computational domain extended up to 100 mm and included a 2 cm radius dispersive electrode. This model thus represented a more or less simplified scenario based on concentric homogeneous tissues, and despite the effort to create a more or less complete model, they did not consider how the power delivered by the RF generator was spatially absorbed by the tissues. The truth is when ablations are conducted with constant temperature, which made power a somewhat irrelevant parameter. The current atrial fibrillation RFCA clinical scenario is different as the procedure is frequently conducted with programed constant power [Citation17]. In this case it is crucial to estimate how much of this power is absorbed at the target site and how much by the rest of the thoracic tissues. This means that in a limited-domain model an estimate must be made of how much of the power programed in the generator (and absorbed by the entire thorax) is actually absorbed around the electrode.
In the context of the present study, the relationship between ‘useful power’ absorbed by the cardiac wall and ‘lost power’ absorbed by the blood circulating around the electrode is irrelevant as we are only interested in the relationship between the power absorbed around the active electrode (including cardiac tissue and blood) and that absorbed beyond. This information becomes even more important with the current tendency to use high power and short durations [Citation18], so that the thermal lesion is created mainly by the direct deposition of RF power, rather than by thermal conduction.
The part of the electrical circuit at a distance from and not associated with the thermal lesion (i.e., that represented electrically by ZEXT in ) has traditionally been ignored, not only in computational modeling but also in ex-vivo models, which were always based on fragments of cardiac tissue placed in a bath. This meant that when constant power was used, both types of study had to ‘justify’ the specified power being less than the power used in clinical practice, since only part of the domain was considered. The problem is that this ‘adjustment’ value has never been sufficiently justified. For this reason, our goal was to analyze how the total power delivered by the RF generator P0 is distributed between the active and dispersive electrodes, and to estimate the percentage of P0 that would be absorbed in a limited-domain model. For this, we compared the results from a full thorax 3D model with those obtained from a limited-domain model.
Methods
Full thorax models
Two-dimensional full thorax model
A two-dimensional model was first built based on a cross-section medical image obtained from The Cancer Imaging Archive [Citation19] (Patient ID 71813). The model included the four chambers of the heart (blood and cardiac muscle) and most of the tissues in the thorax (): lung, bone (vertebrae and ribs), aorta, connective tissue, and an 18-mm thick layer of skin + subcutaneous tissue. shows the electrical conductivity values considered for the tissues obtained from a database [Citation20]. For skin + subcutaneous, we estimated the mean value between fat (0.025 S/m) and fibrous septa (0.22 S/m) [Citation21]. The value for lungs was considered to be the mean between inflated (0.123 S/m) and deflated (0.307 S/m) lung [Citation20]. Likewise, the value for bone (spinal column and ribs) was considered to be the mean between cortical (0.022 S/m) and trabecular (0.087 S/m) bone [Citation20]. A 4-mm 7 Fr active electrode was modeled perpendicular to the left atrial wall (0.5 mm insertion depth) and a dispersive electrode placed on the back, which was modeled as a 15 cm contour segment of the thorax, as shown in . shows the meshing used in the computer simulations, with an especially small mesh size around the active electrode. To quantify the power spatial distribution the following concentric zones were considered (see ): 2-cm radius circular area around the active electrode (Zone 1), 2–4 cm circular band (Zone 2), 4–8 cm circular band (Zone 3), semicircular 10 cm radius area around the dispersive electrode (Zone 5), and the remaining tissue between areas 3 and 5 (Zone 4).
Figure 2. (A) Cross-section of a CT medical image which was segmented to identify zones associated with the different tissue types (image retrieved from [Citation19], ID 71813). (B) Model geometry resulting from the previous segmentation (scale represents electrical conductivity in S/m).
![Figure 2. (A) Cross-section of a CT medical image which was segmented to identify zones associated with the different tissue types (image retrieved from [Citation19], ID 71813). (B) Model geometry resulting from the previous segmentation (scale represents electrical conductivity in S/m).](/cms/asset/8b8bafd2-af07-42c9-bb1c-52217820a5bf/ihyt_a_1777330_f0002_c.jpg)
Figure 3. (A) 2D model mesh. (B) Detail of mesh around the active electrode.
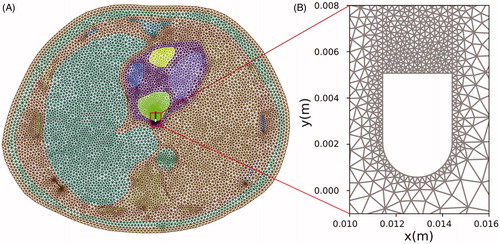
Table 1. Electrical characteristics of the tissues included in the models.
Three-dimensional full thorax model
Different 3D models were developed. All shared the same outer boundary and were built based on the thorax of the patient represented in the 2D model (ID 71813), truncated to a height of 18 cm (Parameter H in ), minor diameter T = 30 cm, and major diameter D = 42 cm. A 4-mm 7 Fr active electrode was considered perpendicular to the cardiac wall inserted to depths of 0.5 mm, 1.5 and 2.5 mm.
Figure 4. (A) Cross section of the fourth 3D model geometry. (B) The structures were immersed in a thorax with realistic boundaries. The dimensions of the model are: T = 30 cm, D = 42 cm, and H = 18 cm. (C) Zone 3 with radius of 8 cm (Zones 1 and 2 were concentric). (D) Zone 5 covers the dispersive electrode.
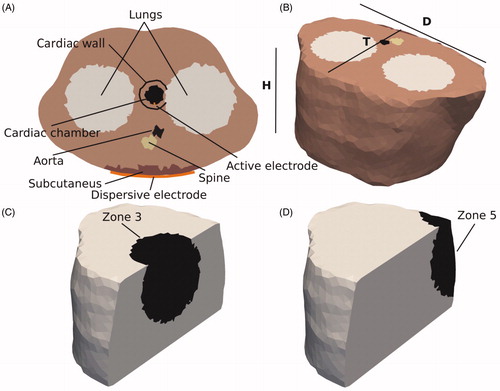
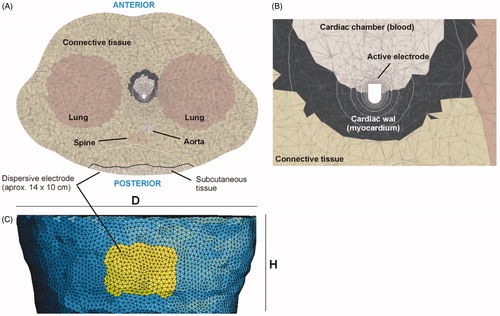
Different numbers of tissues and organs were included in the models, which were built by progressively incorporating the tissue types with more or less simplified geometry (see ). Model 1 was the simplest and was based on a homogeneous thorax with an electrical conductivity of 0.39 S/m (connective tissue). Model 2 included a 2-cm radius sphere (0.748 S/m) mimicking the blood of the cardiac chamber. The active electrode was assumed to be at the boundary of this sphere inserted in the surrounding homogeneous tissue. Model 3 included a 1 cm-thick spherical shell around the sphere to mimic the cardiac wall with an electrical conductivity of 0.281 S/m (myocardium). Model 4 included an ∼18 mm-thick subcutaneous layer at the side corresponding to the dispersive electrode, Model 5 had a 3.6 cm diameter cylindrical structure to mimic the spinal column, Model 6 had two 14 cm diameter cylindrical structures to mimic the lungs, while Model 7 (full model) also had a 2.8 cm diameter cylindrical structure to model the aorta. The electrical conductivities were the same as those in the 2D models ().
The zones used to quantify the power spatial distribution across the thorax were defined similarly to those in the 2D case, but this time spherical instead of circular, with the same radii (see ). Simulations were conducted to compute the percentage of power absorbed in each of these zones and for each model. Since the model represented a truncated torso, the suitability of height H was checked by means of the following sensitivity analysis: parameter H was checked by consecutive simulations in which its value was gradually increased by 2.5 cm above and below until the absorbed power percentage in the different zones varied by less than 1%.
Details of the model mesh can be seen in . The mesh size was also checked by consecutive simulations, increasing the number of elements from ∼34,000 onwards until the difference in the absorbed power percentage between consecutive simulations was less than 1% (obviously in this way mesh size was gradually reduced).
Figure 5. Details of the meshing used in the full thorax model. (A) Cross section at the level of the active electrode. Dotted line represents approximately the contour of the subcutaneous tissue. (B) Close-up of the zone around the active electrode. (C) Posterior view showing the meshing and position of the elements (yellow) on which an electrical condition of zero voltage was set, mimicking the location of the dispersive electrode.
The full model was used to study the effect of changing the active electrode insertion depth and the dispersive electrode’s surface area on power spatial distribution around the active electrode (Zones 1–3).
Governing equations and calculating absorbed power
The model was based on an electric problem which was solved numerically using the Finite Element Method implemented in FEniCS [Citation22]. Image processing and meshing were performed on a 3 D Slicer [Citation23] and Gmsh [Citation24], respectively. As the biological medium can be considered almost fully resistive at RF frequencies, the problem was approximated in its quasi-static form [Citation15]. Voltage Φ was computed by the equation:
(1)
(1)
where σ is the conductivity of the materials. Electric field vector E can be estimated as E = –∇Φ. The power absorbed per unit tissue volume (also known as Specific Absorbed Ratio, SAR) can be calculated as SAR = J•E (dot product), J being the current density vector. As the quasi-static approach was considered valid, SAR can be computed as SAR = σ|E|2 and was integrated over the mentioned zones (surfaces for 2D or volumes for 3D).
Boundary conditions
For the boundary conditions, active and dispersive electrodes were set at voltages 55 V and 0 V, respectively. Although these values are irrelevant in the context of the study, they corresponded with a total power of ∼30 W on impedances of ∼100 Ω (similar to that used in clinical practice for RF cardiac ablation). All the outer surfaces of the model (except that of the dispersive electrode) were fixed to a null electric current. A voltage of 0 V was applied to a set of elements at the back of the thorax (see ) to model a ∼140 cm2 rectangular dispersive electrode (14 cm × 10 cm).
Limited-domain model
A limited-domain model was built similar to others developed to date, i.e., a 2D model based on axial symmetry around the catheter axis (see ). The width of the model was the same value (X) as the height of the blood fragment and the height of the heart tissue fragment (). The electrode was inserted from 0.5 to 2.5 mm (as in the full thorax model). We first determined the optimum model dimensions by the standard convergence test, i.e., increasing X until the variation of a key parameter (impedance, maximum tissue temperature, lesion size) was insignificant. Temperature and lesion depth were also assessed after 30 s of RF ablation and 15 W constant power. This power level was chosen to avoid tissue temperatures higher than 100 °C. The effect of considering one, two or three sides to set the electrical boundary condition of 0 V was also checked (see ). In a limited-domain model this condition should evidently not be the actual physical position of the dispersive electrode (which is further away). After obtaining the optimum dimensions, the impedance values of this limited-domain model were compared to those of the full thorax model in an attempt to harmonize both models and estimate the power adjustment value, i.e., the percentage of power dissipated in ZMOD and ZEXT (according to the lumped element electrical model shown in ).
Figure 6. (A) 2D limited-domain model (out of scale) comprised of two fragments: cardiac tissue and blood, both squares of side X (varying between 4 and 8 cm). (B–D) Options to set the electrical boundary condition of 0 V: only on the bottom (B), bottom and side (C), bottom, side and top (D).
The ANSYS program (ANSYS, Canonsburg, PA, USA) was used to build and solve the model. The governing equations were the Laplace Equation for the electrical problem and the Bioheat Equation for the thermal problem, both coupled [Citation25]. An irrigated electrode was modeled by fixing a value of 45 °C in the cylindrical zone of the electrode tip and leaving the semi-spherical tip free, as described in [Citation26], i.e., blood motion was not modeled by CFD (computer fluid dynamics) but its cooling effect was modeled by means of blood–electrode (hT) and blood–electrode (hE) convective transfer coefficients. Each coefficient was calculated under conditions of high blood flow (24.4 cm/s), as in [Citation11]: hE = 6090 W/m2·K and hT = 1417 W/m2·K. This method predicts lesion depths similar to the method including CFD [Citation25]. Both the initial temperature and the temperature of the surfaces away from the active electrode were initially assumed to be 36 °C.
Results
Two-dimensional full thorax model
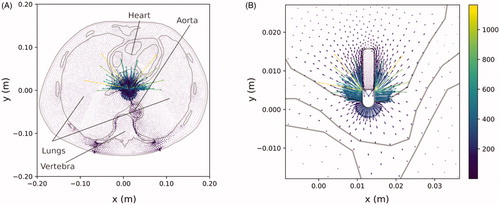
shows the current density plot. As expected, the gradient is maximum around the active electrode. However, it is also interesting to note the high values around the dispersive electrode (bottom) and the distorted current distribution due to the presence of bone structures associated with the spinal column. In it can be seen that: (1) the electric current tries to avoid the spine (due to bone’s low electrical conductivity), (2) the electrical current preferentially flows off the edges of the dispersive electrode (as expected), and (3) large vascular structures (such as the aorta shown in ) favor the passage of current. We also observed that the current prefers to flow toward the blood due to its higher electrical conductivity (see yellow and green arrows in ), which point to the blood filling the cardiac chamber, instead of toward the cardiac wall).
Figure 7. (A) Current density distribution (in A/m) across the thorax computed by the 2D model. (B) Detail around the active electrode.
Three-dimensional full thorax model
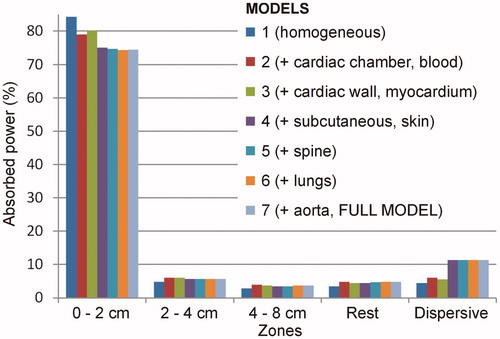
RF power was also deposited mainly around the active electrode in the 3D models. shows the percentage of absorbed power in each zone of the seven models for an insertion depth of 1.5 mm (the behavior as different organs and tissues were added was similar for the other insertion depths). In the simplest model (based on a homogenous thorax with 0.39 S/m electrical conductivity), at this depth 84.4% of the power was absorbed within the 2-cm area around the active electrode. Absorbed power fell drastically in the concentric zones: 4.8% in Zone 2, 2.9% in Zone 3, 3.4% in the rest, and 4.5% around the dispersive electrode. When a sphere mimicking the blood inside the cardiac chambers was added to the previous model, the power absorbed in Zone 1 dropped to 79.1%, rose to 6.1% around the dispersive electrode and slightly increased in Zones 2, 3, and 4: 6.2%, 4.0% and 4.8%, respectively. When a 1 cm-thick cardiac wall was added covering the cardiac chamber, the power in Zone 1 increased slightly to 80.2%, and remained more or less unchanged in the other zones: 6.1%, 3.7%, 4.5% and 5.6% in Zones 2, 3, 4 and 5, respectively. When an ∼18 mm-thick subcutaneous layer was added to the previous model, the power absorbed in Zone 1 dropped to 75.0%, rose to 11.3% around the dispersive electrode and slightly varied in Zones 2, 3, and 4: 5.7%, 3.5% and 4.4%, respectively. The further addition of organs and tissues hardly altered these percentages. Neither did they vary much when the spinal column was added: 74.7%, 5.7%, 3.5%, 4.8%, and 11.3%, in Zones 1 to 5, respectively. With lungs, the model showed that 74.4% of the power was absorbed within the 2-cm around the active electrode, and 11.3% around the dispersive electrode (Zone 5). The remaining 14.3% was absorbed in the intermediate zones (5.7%, 3.7%, 4.9% in Zones 2, 3 and 4, respectively). When the aorta was included (full model), the definitive percentages were 74.5%, 5.7%, 3.7%, 4.8% and 11.3% in Zones from 1 to 5, respectively.
Figure 8. Profile of percentage power absorbed in each zone of the thorax for the seven 3D models studied (which were built on the basis of adding different types of tissues and organs to an initial model based on homogeneous tissue). These results were from an electrode insertion depth of 1.5 mm (similar results were obtained for other values of 0.5 and 2.5 mm).
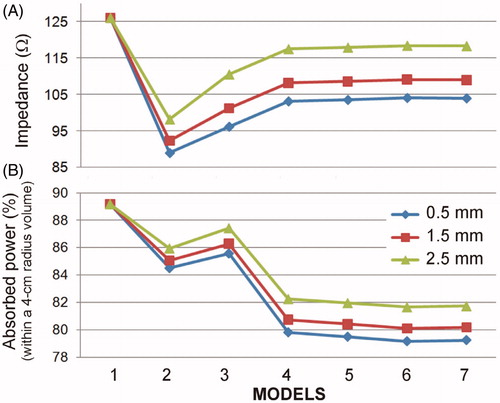
shows the impedance values and power percentage absorbed in a 4 cm radius sphere around the electrode (merger of Zones 1 and 2) at insertion depths of 0.5, 1.5 and 2.5 mm as organs and tissues were added. The most remarkable issue is that from Model 4 on (with a cardiac wall and chamber + subcutaneous tissue and skin) the results hardly changed. The percentages of power absorbed in a 4 cm radius sphere around the active electrode were ∼79, 80 and 82% for insertion depths of 0.5, 1.5 and 2.5 mm, respectively, while impedance was ∼104, 109 and 118 Ω, at depths of 0.5, 1.5 and 2.5 mm, respectively.
Figure 9. Impedance (A) and percentage of power absorbed in a 4 cm radius sphere around the electrode (B) at three insertion depths (0.5, 1.5 and 2.5 mm) and for seven full-thorax models built by progressively adding organs and tissues: 1 (homogeneous), 2 (+ cardiac chamber), 3 (+ cardiac wall), 4 (+ subcutaneous and skin), 5 (+ spine), 6 (+ lungs) and 7 (+ aorta).
Several convergence tests were carried out to check the effects of different parameters. Firstly, it was found that raising parameter H from 18 to 19 cm had little effect on the power percentages (<0.2% for all seven models), which suggests that this dimension is adequate for a full thorax model oriented toward RFCA. When the dimensions of the organs were modified by ±10%, the power percentages in a 4 cm radius sphere around the electrode varied by less than 0.8%, confirming that the presence/absence of organs at a distance from the electrodes has little impact in terms of power deposited around the active electrode. Similarly, when the mesh was refined twice, the power percentages in a 4 cm radius sphere around the electrode varied by less than 1%, which confirmed the optimal 0.2 mm mesh size around the active electrode and ∼7 mm around the dispersive electrode. The model consisted of ∼300,000 tetrahedral elements.
Limited-domain model
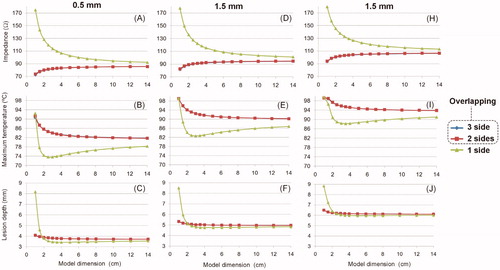
shows the results of the convergence tests conducted on the limited-domain model shown in , when the outer dimension X was increased from 1 to 14 cm. Additional convergence tests for meshing size provided values of ∼0.02 mm at the electrode–tissue interface and ∼2 mm at the point furthest from the active electrode. Likewise, the optimal time-step was ∼0.07 s. The number of elements varied with the model size (X) from 13,000 for X = 1 cm to 21,000 for X = 14 cm (14,318 for X = 4 cm). The following conclusions were drawn: (1) the results obtained when the boundary condition V = 0 is set at the bottom of the model () are very different from those obtained when it is set on 2 or 3 sides (); (2) the results are practically identical when the condition V = 0 is set on 2 or 3 sides; and 3) for any of these two cases, and regardless of the insertion depth, increasing model size from 4 cm to 14 cm changed impedance by less than 3 Ω, maximum temperature by less than 2.5 °C, and lesion depth by less than 0.07 mm.
Figure 10. Effect of the dimensions of a 2D limited-domain model on initial impedance, maximum temperature and lesion depth (assessed with the 55 °C isotherm) after a 15-W 30-s RF cardiac ablation. The columns show the insertion depth of the active electrode (0.5, 1.5 and 2.5 mm). The three lines (blue and red overlap) are the location of the zero-voltage electrical boundary condition (see ).
Discussion
Most of the previous computer RFCA models built only represented a fragment of blood and myocardium around the active electrode, i.e., they were domain-limited models. This was not a problem when modeling constant temperature ablations, since the applied voltage could be suitably modulated to keep the active electrode temperature constant. Power was hence not relevant because it was not even programed. However, the case of constant power RFCA for atrial fibrillation is quite the opposite, as power is now the programed parameter (P0 in ) and lesion size strongly depends on its value, especially on the way in which the power is absorbed in the immediate vicinity of the electrode, which is directly related to how much each tissue contributes to baseline impedance [Citation27]. Computer simulations were conducted to quantify the power percentage absorbed in each zone around the active electrode and to clarify how these percentages can be related to the power applied in a limited-domain model.
A 2D full thorax model was first developed based on an actual medical image to ensure a high degree of tissue realism. The main limitation of this 2D model is that its power distribution was not real, since the power drops by 1/r2 as we move away from the active electrode – assuming a spherical electrode–, instead of 1/r4, as would be the case in a 3 D model [Citation28]. Despite this limitation, the model was able to show how current density mostly flowed toward the cardiac chamber and to a lesser extent toward the myocardium, even though the dispersive electrode was on the opposite side (see ), which was probably due to the higher blood conductivity with respect to the myocardium (0.748 vs. 0.281 S/m). This result suggests that limited-domain models should allow currents to flow not only toward the myocardium but also to the blood by imposing the electrical boundary condition of 0 V on all sides (), and not only on the bottom (). In fact, the convergence tests conducted on the limited-domain model showed that when the condition V = 0 is set on the bottom, and the electrical current is forced to pass only through the myocardium, the impedance values are excessively high (see ) and are not compatible with the full thorax model, since it is reasonable to assume that the impedance values of the limited-domain model should always be lower than those obtained from the full thorax model, as this only considers a fragment of the electrical circuit (ZMOD instead of ZMOD + ZEXT, see ).
The high degree of detail in the 2D model (unaffordable in computational terms with a 3D model) also indicated the tissue structures that significantly altered the current distribution and suggested those that should be included in a simplified 3D full thorax model with structures based on volumes with more or less simplified geometry. The objective with the 3D model was not to make detailed observations (as with the 2D model) but to quantify how much of the total programed power is absorbed around the active electrode. Even though the lungs did not significantly distort electrical current distribution in the 2D model (), we decided to include them in the 3D models due to their large volume and proximity to the active electrode. The results of the 3D full thorax models showed that adding organs relatively far away from the active and dispersive electrodes (i.e., spine, lungs and aorta) had practically no effect (), which makes sense, since the power is mainly absorbed in zones with high current density gradients (or electrical field), and this only occurs in the proximity of the electrodes and mainly near the active electrode, due to its having a smaller effective area than the dispersive electrode (∼ 42 cm2 vs. ∼ 140 mm2). In other words, the 3D model including the cardiac chamber (blood), cardiac wall (myocardium), subcutaneous tissue + skin, and connective tissue filling the intervening space can be considered adequate in terms of assessing how power is spatially absorbed along the electrical circuit between the active and dispersive electrode.
Considering the full thorax 3D model, the percentages of power absorbed in a 4 cm radius sphere around the active electrode ranged from 79 to 82%, for insertion depths between 0.5 and 2.5 mm. These results should have direct implications for computer limited-domain models. Although the volume of the 4 cm radius sphere (in the full thorax model) and the volume of a limited-domain model (as shown in ) is not the same (the sphere occupies 268 cm3 and the circular prism associated with a limited-domain model of X = 4 cm occupies 512 cm3), the results of both models in terms of impedance are quite consistent. Indeed, while the impedance values computed from the full thorax model were 104, 109 and 118 Ω for insertion depths between 0.5, 1.5 and 2.5 mm, respectively, the values of the domain-limited model (with X = 4 cm) were 83, 92 and 103Ω, for insertion depths between 0.5, 1.5 and 2.5 mm, respectively. The values of the limited-domain were obviously smaller since they represented only a portion of the electrical circuit. The impedance values of the limited-domain model represented 80–87% of the full thorax model impedance, which is consistent with the power percentages absorbed 4 cm around the active electrode (79–82%). Note that there is a direct relationship between the power absorbed across a tissue zone and its associated impedance.
The impedance values computed for the full thorax model varied between 104 and 118 Ω (see ) for insertion depths between 0.5 and 2.5 mm and are in agreement with those reported in RFCA clinical studies using 4-mm 7 Fr electrodes (as modeled here): 113 ± 10 Ω in 45 patients [Citation29], 103.5 ± 8.6 Ω in 76 patients [Citation30], 100 ± 9 Ω in 29 patients [Citation31]. Note that impedance values of the latest atrial fibrillation electrodes could be slightly higher since they are 3.5-mm.
The practical implications are as follows: in a model of constant power RFCA with a domain limited to 4 cm around the active electrode (as that used in several previous studies [Citation8–11]) the power in simulations should be reduced to ∼80% of the value used in clinical practice. For instance, if a power of 25 W is programed for a patient, the power in the simulations/experiments should be 20 W to compensate for the missing section of the electrical circuit. Likewise, if the model domain reaches 8 cm in radius (sum of zones 1, 2 and 3), the power in the model should be reduced to ∼84% (21 W). Computational models that do not include the thorax are rarely larger than 8 cm in radius [Citation1–13]. It is important to point out that our conclusions are equally valid for any applied power, which means they can be applied to high-power ablation models such as those recently proposed [Citation32,Citation33]. It should also be noted that we considered spherical zones around the electrode, and this does not have to coincide with the geometries of other numerical models (usually cylinders in 2D models, and cubes in 3D models). Unfortunately these power adjustment values should not be followed to the letter, as our results also showed that there are slight variations at different insertion depths of the active electrode, along with organ and tissue dimensions (cardiac wall, cardiac chamber and subcutaneous tissue). It is also important to recognize that the comparison between the limited-domain model and the full thorax model cannot be straightforward since former assumes a current that always flows more or less uniformly toward the contours (where condition V = 0 is set), while the latter forces the currents to flow toward the back of the thorax and the dispersive electrode. We think that our findings could also be useful for constant temperature ablation modeling, at least for justifying the differences between the power required by the limited-domain model and that provided by the RF generator in clinical practice to keep the electrode at the target temperature.
Limitations of the study
First of all, we would like to point out that the 3D models were built using simplified structures of each incorporated organ/tissue, instead of realistic geometries obtained from patients’ images. In spite of this, the results obtained show that this simplification is appropriate in the context of the present study and does not at all invalidate its conclusions. When the cardiac chamber, cardiac wall and subcutaneous tissues were considered, the results showed that the gradual incorporation of organs/tissues (spine, lungs, aorta) had a very small impact on the percentages of power distribution, confirming that the inclusion of realistic details in the external shape of these organs/tissues would not cause significant changes. In other words, the power distribution percentages would be conditioned by the presence or absence of organs/tissues, and not so much by their geometric details. Obviously the details are expected to be important in the vicinity of the active electrode, but these have already been taken into account in limited domain models, and our goal here was to quantify the power regionally throughout the thorax, and consequently to provide information on how the limited domain models should adjust the total power applied to reproduce the real clinical scenario.
Secondly, our full thorax model focused exclusively on the electrical problem, i.e., no thermal problem was solved. During an RF ablation, heating in the cardiac tissue around the active electrode raises the tissue electrical conductivity. This phenomenon, which was not included in our simulations, would slightly increase the power absorbed in the cardiac tissue around the active electrode, which would slightly modify the percentages shown in . For instance, an increase from 37 °C to 80 °C would raise tissue electrical conductivity from 0.281 S/m to 0.536 S/m (assuming a coefficient of +1.5%/°C [Citation34]). When we conducted an additional simulation using the full thorax model that included an electrical conductivity value associated with ‘heated myocardium’ (0.536 S/m) the power percentage absorbed within the 2-cm around the active electrode for an insertion depth of 1.5 mm changed from 74.5 to 75.9%, i.e., an insignificant effect. In conclusion, we think that the values proposed to adjust the applied power in limited domain models could be used for the entire RF ablation.
And thirdly, the study only considered a specific set of ‘local’ characteristics around the active electrode: electrode design, location of the electrode inside the cardiac chamber, tissue-electrode angle, etc. We must hence recognize that variations in these parameters could cause changes in the power percentages absorbed around the active electrode. Future computer models based on a limited domain should determine whether their conditions are similar to those considered here and act accordingly in case of significant variations.
Conclusions
The percentages of power absorbed in a 4 cm radius sphere around the active electrode in a full thorax model range from 79 to 82% for active electrode insertion depths between 0.5 and 2.5 mm. These same figures could be used to adjust the power applied in limited-domain models of constant power RF cardiac ablation.
Disclosure statement
No potential conflict of interest was reported by the author(s).
Additional information
Funding
References
- Jain MK, Wolf PD. Temperature-controlled and constant-power radio-frequency ablation: what affects lesion growth? IEEE Trans Biomed Eng. 1999;46(12):1405–1412.
- Keller MW, Schuler S, Wilhelms M, et al. Characterization of radiofrequency ablation lesion development based on simulated and measured intracardiac electrograms. IEEE Trans Biomed Eng. 2014;61(9):2467–2478.
- Lau M, Hu B, Werneth R, et al. A theoretical and experimental analysis of radiofrequency ablation with a multielectrode, phased, duty-cycled system. Pacing Clin Electrophysiol. 2010;33(9):1089–1100.
- Tian Z, Nan Q, Nie X, et al. The comparison of lesion outline and temperature field determined by different ways in atrial radiofrequency ablation. Biomed Eng Online. 2016;15(Suppl 2):124.
- Jain MK, Wolf PD. A three-dimensional finite element model of radiofrequency ablation with blood flow and its experimental validation. Ann Biomed Eng. 2000;28(9):1075–1084.
- Panescu D, Whayne JG, Fleischman SD, et al. Three-dimensional finite element analysis of current density and temperature distributions during radio-frequency ablation. IEEE Trans Biomed Eng. 1995;42(9):879–890.
- Gopalakrishnan J. A mathematical model for irrigated epicardial radiofrequency ablation. Ann Biomed Eng. 2002;30(7):884–893.
- Jain MK, Tomassoni G, Riley RE, et al. Effect of skin electrode location on radiofrequency ablation lesions: an in vivo and a three-dimensional finite element study. J Cardiovasc Electrophysiol. 1998;9(12):1325–1335.
- Tungjitkusolmun S, Woo EJ, Cao H, et al. Thermal-electrical finite element modelling for radio frequency cardiac ablation: effects of changes in myocardial properties. Med Biol Eng Comput. 2000;38(5):562–568.
- Tungjitkusolmun S, Woo EJ, Cao H, et al. Finite element analyses of uniform current density electrodes for radio-frequency cardiac ablation. IEEE Trans Biomed Eng. 2000;47(1):32–40.
- Tungjitkusolmun S, Vorperian VR, Bhavaraju N, et al. Guidelines for predicting lesion size at common endocardial locations during radio-frequency ablation. IEEE Trans Biomed Eng. 2001;48(2):194–201.
- Labonté S. Numerical model for radio-frequency ablation of the endocardium and its experimental validation. IEEE Trans Biomed Eng. 1994;41(2):108–115.
- Gallagher N, Fear EC, Byrd IA, et al. Contact geometry affects lesion formation in radio-frequency cardiac catheter ablation. PLOS One. 2013;8(9):e73242.
- Cao H, Tungjitkusolmun S, Choy YB, et al. Using electrical impedance to predict catheter-endocardial contact during RF cardiac ablation. IEEE Trans Biomed Eng. 2002;49(3):247–253.
- Pearce JA. Electrosurgery. New York (NY): John Wiley & Sons; 1986.
- Shahidi AV, Savard P. A finite element model for radiofrequency ablation of the myocardium. IEEE Trans Biomed Eng. 1994;41(10):963–968.
- Vassallo F, Cunha C, Serpa E, et al. Comparison of high-power short-duration (HPSD) ablation of atrial fibrillation using a contact force-sensing catheter and conventional technique: initial results. J Cardiovasc Electrophysiol. 2019;30(10):1877–1883.
- Leshem E, Zilberman I, Tschabrunn CM, et al. High-power and short-duration ablation for pulmonary vein isolation: biophysical characterization. JACC Clin Electrophysiol. 2018;4(4):467–479.
- Clark K, Vendt B, Smith K, et al. The cancer imaging archive (TCIA): maintaining and operating a public information repository. J Digit Imaging. 2013;26(6):1045–1057.
- Hasgall PA, Di Gennaro F, Baumgartner C, et al. 2016. IT’IS Database for thermal and electromagnetic parameters of biological tissues, Version 3.0, September 1st, 2015. Available from: www.itis.ethz.ch/database.
- González ‐Suárez A, Gutierrez-Herrera E, Berjano E, et al. Thermal and elastic response of subcutaneous tissue with different fibrous septa architectures to RF heating: numerical study. Lasers Surg Med. 2015; 47(2):183–195.
- Alnaes MS, Blechta J, Hake J, et al. The FEniCS project version 1.5. Arch Numer Software. 2015; 3(100):9–23.
- Fedorov A, Beichel R, Kalpathy-Cramer J, et al. 3D slicer as an image computing platform for the quantitative imaging network. Magn Reson Imaging. 2012;30(9):1323–1341.
- Geuzaine C, Remacle JF. Gmsh: a three-dimensional finite element mesh generator with built-in pre- and post-processing facilities. Int J Numer Meth Engng. 2009;79(11):1309–1331.
- González-Suárez A, Pérez JJ, Berjano E. Should fluid dynamics be included in computer models of RF cardiac ablation by irrigated-tip electrodes? Biomed Eng Online. 2018;17(1):43.
- Pérez JJ, D'Avila A, Aryana A, et al. Can fat deposition after myocardial infarction alter the performance of RF catheter ablation of scar-related ventricular tachycardia? Results from a computer modeling study. J Cardiovasc Electrophysiol. 2016;27(8):947–952.
- Bhaskaran A, Barry MA, Pouliopoulos J, et al. Circuit impedance could be a crucial factor influencing radiofrequency ablation efficacy and safety: a myocardial phantom study of the problem and its correction. J Cardiovasc Electrophysiol. 2016;27(3):351–357.
- Lopez Molina JA, Rivera MJ, Berjano E. Electrical-thermal analytical modeling of monopolar RF thermal ablation of biological tissues: determining the circumstances under which tissue temperature reaches a steady state. Math Biosci Eng. 2016;13(2):281–301.
- Nsah E, Berger R, Rosenthal L, et al. Relation between impedance and electrode temperature during radiofrequency catheter ablation of accessory pathways and atrioventricular nodal reentrant tachycardia. Am Heart J. 1998;136(5):844–851.
- Wen ZC, Chen SA, Chiang CE, et al. Temperature and impedance monitoring during radiofrequency catheter ablation of slow AV node pathway in patients with atrioventricular node reentrant tachycardia. Int J Cardiol. 1996;57(3):257–263.
- Strickberger SA, Hummel J, Gallagher M, et al. Effect of accessory pathway location on the efficiency of heating during radiofrequency catheter ablation. Am Heart J. 1995;129(1):54–58.
- Irastorza RM, d'Avila A, Berjano E. Thermal latency adds to lesion depth after application of high-power short-duration radiofrequency energy: results of a computer-modeling study. J Cardiovasc Electrophysiol. 2018;29(2):322–327.
- Bourier F, Duchateau J, Vlachos K, et al. High-power short-duration versus standard radiofrequency ablation: insights on lesion metrics. J Cardiovasc Electrophysiol. 2018;29(11):1570–1575.
- Schutt D, Berjano EJ, Haemmerich D. Effect of electrode thermal conductivity in cardiac radiofrequency catheter ablation: a computational modeling study. Int J Hyperthermia. 2009;25(2):99–107.