
Abstract
Objectives
To develop and validate the nomograms to predict survival outcomes after microwave ablation (MWA) in elderly patients(>65 years old) with early-stage hepatocellular carcinoma (EHCC).
Methods
This retrospective study was approved by the institutional review board. A total of 265 EHCC patients (76 females, 189 males; average age 71.4 years ± 5.4 [standard deviation]) with 345 nodules subsequently underwent MWA from April 2006 to October 2019. Baseline characteristics were collected to identify the risk factors for the determination of survival outcomes after MWA. The nomograms were based on prognostic factors for overall survival (OS) and recurrence-free survival (RFS) from the multivariate Cox proportional hazards model and validated in external cohorts from another two institutions (n = 130). The nomograms were assessed for their predictive accuracy using Harrell’s concordance index (C-index).
Results
After a median follow-up time of 28.6 months, 29.8% (79/265) of the patients died, and 54.3% (144/265) of the patients experienced recurrence in the training set. The OS nomogram was developed based on the hepatitis B virus (HBV) presence, α-fetoprotein (AFP), and albumin, with a C-index of 0.757 (95% confidence interval [CI]: 0.645, 0.789).The scores of the nomogram ranged from 0 to 24. The RFS nomogram was developed based on tumor number, abutting major vessels and platelets, with a C-index of 0.733 (CI: 0.672, 0.774). The likelihood of 3- and 5-year OS and RFS were consistent between clinical observations and nomogram predictions in external cohorts.
Conclusions
The nomogram models can be useful in determining the risk of OS and RFS in elderly patients with EHCC after MWA, which can guide individual patient management.
MWA is an effective and feasible treatment for elderly patients with EHCC and can improve survival outcomes.
A calibrated and objective nomogram model for the prediction of survival outcomes in elderly patients (>65 years old) may guide patient selection and MWA treatment.
Older age was not deemed to be a risk factor for survival outcomes when the elderly patients with EHCC underwent MWA.
Key points
Introduction
Population aging is a challenging problem worldwide. According to reliable reports, at least 20% of the population will be 65 years of age or older by 2030 [Citation1–3]. Due to the increased life expectancy of the population, the number of elderly patients with hepatocellular carcinoma (HCC) has also increased gradually. Most studies have shown that the age distribution at diagnosis of HCC has steadily increased and reported that people 65 and older years with HCC received less effective treatments and had worse prognoses than younger adults [Citation4]. An emerging cohort of elderly patients with HCC may place a significant burden on the health care system given that studies have suggested inferior outcomes in elderly patients received surgery compared with younger patients [Citation5–7].
It is difficult to perform surgery or liver transplantation in most elderly people. Accordingly, new therapeutic modalities for the treatment of HCC continue to appear annually, including local radical ablation, targeted chemotherapeutic agents and radiation therapy [Citation8]. As a main choice for local radical ablation, the benefits of microwave ablation (MWA) include an increased intratumoral temperature and a short operation time, making it as safe and effective in older patients as it is in younger patients [Citation9–12]. However, it is unclear whether MWA improves long-time survival in elderly patients. Moreover, risk factors affecting survival prognosis after MWA have been rarely reported in previous studies.
A nomogram, which is a pictorial representation of a complex mathematical formula, is widely used as a prognostic model of oncological outcomes [Citation13–15]. With the ability to generate an individual probability of a clinical event by integrating diverse prognostic and determinant variables, nomograms meet our desire for biologically and clinically integrated models and fulfill our drive toward personalized medicine. Rapid computation through user-friendly digital interfaces, together with increased accuracy and easily understood prognoses compared with conventional staging, allow for the seamless incorporation of nomogram-derived prognoses in clinical decision making.
Here, we developed and validated a nomogram to predict survival outcomes in elderly patients with early-stage hepatocellular carcinoma (EHCC) after MWA. The model was further validated using an external cohort from two different centers. The results may provide useful information for personalizing therapeutic strategies for elderly patients with EHCC to improve their long-term prognosis.
Materials and methods
Patients and treatments
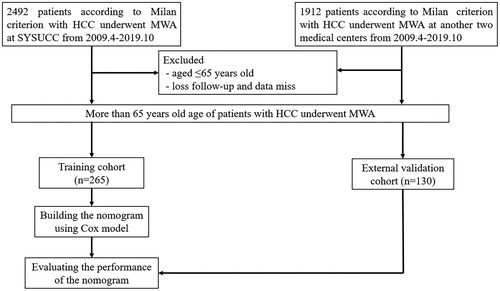
The protocols involved in the current retrospective multicenter study were approved by the ethics committee, who allowed informed consent to be waived. As a training dataset, the patients with EHCC nodules met the Milan criteria who received MWA between April 2006 and October 2019 were reviewed. Milan criteria are defined as patients with a single tumor sized <5 cm or 2–3 tumors sized <3 cm and without vascular infiltration or extrahepatic metastasis. These patients were followed from treatment until death or until November 2019. An additional dataset comprising 130 consecutive elderly patients with EHCC who underwent MWA at two different centers during the study period was also retrospectively collected for external validation. The diagnosis of hepatocellular carcinoma was made based on the European Association for the Study of Liver guidelines [Citation16]. New cases of HCC were deliberated at multidisciplinary meetings comprising hepatologists, surgeons, oncologists, radiologists and pathologists (J.H.H. and W.J.F., both with 25 years of experience) to determine the optimal treatment mode for each patient. The following inclusion criteria were applied in the study: (a) patients aged older than 65 years; (b) patients with Eastern Cooperative Oncology Group (ECOG) performance status 0 or 1; (c) patients with Child-Turcotte-Pugh (CTP) grades A or B; (d) patients with a single tumor sized <5 cm or 2-3 tumors sized <3 cm; (e) patients without major vascular infiltration or extrahepatic metastasis; (f) patients who accepted MWA treatment voluntarily, and patients with surgically unresectable HCC lesions. Those with severe coagulopathy (i.e., prothrombin activity <40%, prothrombin time >25 s and platelet count <50 cells × 109/L) and those who received other non-MWA treatments were excluded from the study. Patient enrollment pathways as well as the inclusion and exclusion criteria are depicted in .
Figure 1. Flow diagram shows study patient accrual process.
MWA procedure
Previous reports describe the MWA device and procedure protocols [Citation17]. All percutaneous ablation procedures were performed by two interventional radiologists. MWA procedures were performed under CT guidance and the microwave needle was located into the tumor and the deployment degree scale was determined according to the tumor size and shape. Patients laid either a supine or prone position on the scanning bed according to the location of the lesions. Each MWA procedure was performed under local and intravenous anesthesia. After local anesthesia, the MWA therapeutic instrument (MTC-3C, Nanjing Qinghai Research Institute of Microwave Electric, China) was inserted into the tumor at a predetermined angle. To ensure the appropriate position of the ablation electrode, CT image scanning was performed again. Power settings and ablation times were determined according to the standard recommendations provided by the manufacture of the equipment. Each MWA session was used overlapping techniques to ensure the eradication of the entire tumor. The 2–3 tumors were treated in the same session. The ablation area covering the tumor focus and its surrounding area measured at least 5 mm as ‘safety margin’, as measured by comparing the real-time image taken after the procedure with the enhanced scan image taken before treatment. Minimal margin evaluation method was used based on the study of Wang et al. [Citation18].
Data analysis
The clinicodemographic information collected was as follows: (1) Comorbid conditions and demographic data (sex, age, comorbidities, i.e., esophageal gastric varices, CTP grade, presence of cirrhosis and etiology, renal and heart disease, diabetes and hypertension); (2) features of the tumor (number and maximum diameter, as well as the perivascular tumor, defined as direct HCC abutting either the inferior vena cava, secondary portal vein branches, main hepatic veins, or any vessel with a diameter >3 mm). All perivascular HCC were retrospectively grouped by two radiologists (J.Z. and L.Z.L.) who reviewed all pretreatment CT or MRI examinations and were blinded to final outcomes by consensus. Two radiologists examined all the images and the final kappa value of perivascular tumor diagnosis was 0.86 (95% CI: 0.77–0.96); and (3) laboratory findings (α-fetoprotein [AFP] level, serum albumin, serum total bilirubin, alanine aminotransferase [ALT], aspartate aminotransferase [AST] and platelet counts). In particular, the safety margin needs our attention. Many studies have shown that it is related to local tumor progression and it is a boundary that the tumor edge reaches 5–10 mm from the edge of the ablation zone. In our study, we choose the 5 mm safety margin as a cutoff value to classify HCC patients, and those who reached the 5 mm safety margin were considered as a low-risk recurrence group; otherwise, they were regarded as high-risk recurrence group. The data were used to analyze and develop the nomograms.
Follow-up and survival assessment
The lack of contrast enhancement on imaging in the ablation zone at one month postprocedure was considered to indicate an effective technique. Incomplete ablation after the second MWA session was considered a technical failure, and these patients underwent repeat MWA for tumor control. To assess treatment efficacy, contrast-enhanced multiphase images (or computed tomography [CT] and magnetic resonance imaging [MRI]) were performed one week after the last course of the defined ablation protocol. The obtainment of adequate margins of ablation should also have been taken into consideration and measurement at immediate post-treatment CT. In patients who were deemed to have undergone sufficient ablation, either MRI or contrast-enhanced CT along with serum tumor marker analyses were repeated at 1 and 3 months post-MWA and at intervals between 3 and 6 months. Lesions suspicious for metastasis were further investigated with a thoracic CT, bone scan or positron emission tomography/computed tomography (PET/CT). Overall survival (OS) represented the duration between the date of the first MWA treatment session and the last follow-up date (either survival or loss to follow-up) or patient death. Recurrence-free survival (RFS) was considered the duration between the date of the first MWA treatment session and the last follow-up date (either recurrence or lost to follow-up) or date of tumor recurrence. Local recurrence and distant recurrence were defined according to imaging results of abnormal nodular, disseminated, and/or unusual patterns of peripheral enhancement around or further away from the ablation site in patients treated with MWA. Those who developed recurrence were treated via surgical resection, MWA, radiofrequency ablation (RFA), transcatheter arterial chemoembolization (TACE), or systemic chemotherapy, based on the patients’ overall health status, location of cancer and baseline liver function.
Statistical analysis
The survival rate post-MWA was the primary study endpoint. Baseline clinical data between the training and validation datasets were compared. Continuous variables were analyzed with the Mann–Whitney U-test, while the Pearson χ2 analysis or Fisher’s exact tests were used to analyze categorical variables. RFS and OS rates were then derived using the Kaplan–Meier method with a log-rank test. Univariate and multivariate analyses of independent risk factors were assessed based on a forward stepwise Cox regression model. A nomogram was constructed using the Cox model-derived β coefficients to determine the association between clinical variables and survival outcomes. The nomogram was then externally validated to determine the scores for each patient in the validation group. The calibration curve allowed for the prediction of OS or RFS at 1-, 3-, and 5-years versus the observed probability. The SPSS 22.0 (SPSS, Chicago, IL) program and the RMS package of R software version 3.5.1 (http://www.r-project.org/) were used for all statistical analyses. A two-sided p value <0.05 was considered to represent statistical significance.
Results
Baseline characteristics and long-term survival
In our study, a total of 265 treatment-naïve elderly patients (>65 years old) (76 females, 189 males; average age 71.4 years ± 5.4 [standard deviation]) with 345 EHCC nodules during a more than 10-year follow-up period were included. The 10-year OS and RFS were 32.8% and 18.9%, respectively. The baseline characteristics between the training dataset and validation datasets are described in . The clinical characteristics and follow-up data did not vary significantly between the two groups (p = 0.641–0.787). 33.7% of patients underwent CT follow-up and 66.3% of patients underwent MRI follow-up. The 94.2% technique effectiveness rate in the training dataset was comparable to the 92.1% technique effectiveness rate in the validation dataset (p = 0.762). After a median follow-up period of 28.6 months (range, 1.3–190.5 months), 29.8% (79/265) of patients died and 54.3% (144/265) of patients developed recurrence. The OS rates at 1-, 3-, and 5-years were 95.9%, 75.0%, and 56.1% in the training data set and 96.7%, 76.8% and 54.5% in the validation data set, respectively, neither of which did demonstrated any significant difference (p = 0.655) (). The RFS rates at 1-, 3-, and 5-years were 79.0%, 54.2%, and 36.2% in the training data set and 72.7%, 44.2% and 29.0% in the validation data set, respectively, demonstrating no statistically significant differences (p = 0.100) ().
Figure 2. Kaplan–Meier LTP curves of comparation between the training data set and the validation data set.
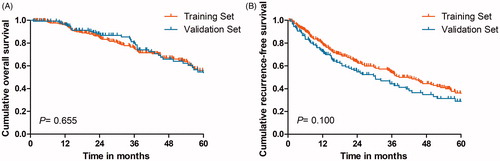
Table 1. Baseline patient characteristics.
Local tumor progression and ablative margin
In the training dataset, the ablative margin (AM) as evaluated after MWA was 0 mm in 76 (74.5%), 1–5 mm in 62 (45.9%), 6–10 mm in 5 (21.7%), >10 mm in 0 (0%), respectively. Two-year local tumor progression (LTP) rate for patients with 0, 1–5, 6–10, or 11–15 mm AM were 72.2, 43.6, 32.5, and 22.8%, respectively (p < 0.001). In the validation dataset, the ablative margin (AM) as evaluated after MWA was 0 mm in 48 (82.6%), 1–5 mm in 24 (35.3%), 6–10 mm in 0 (0%), >10 mm in 0 (0%), respectively. Two-year local tumor progression (LTP) rate for patients with 0, 1–5, 6–10, or 11–15 mm AM were 82.4, 39.1, 0, and 0%, (p < 0.001), respectively ().
Table 2. Local tumor recurrence between different ablative margin.
Univariate and multivariate analyses
To determine independent predictors of long-term prognosis in elderly patients receiving MWA for EHCC, both univariate and multivariate logistic regression analyses were performed. Univariate analysis revealed that there were statistically significant differences between the OS rates that were dependent on etiology (hazard ratio (HR) = 1.689; 95% confidence interval [CI]: 1.064, 2.681; p = 0.026), tumor size (HR =1.611; 95% CI: 1.020, 2.544; p = 0.041), AFP levels (HR = 1.946; 95% CI: 1.196, 3.166; p = 0.007), albumin levels (HR = 0.550; 95% CI: 0.321, 0.946; p = 0.031) and AST (HR = 1.705; 95% CI: 1.772, p = 0.024). The multivariate analysis showed that the factors that significantly affected the OS rate were etiology (HR = 1.684; 95% CI: 1.064, 2.697; p = 0.026), AFP levels (HR = 2.080 ; 95% CI: 1.272, 3.401; p = 0.007) and albumin levels (HR =0.499; 95% CI: 0.288, 0.864; p = 0.013), whereas the age was not significant risk factor of OS (). The RFS rates also differed significantly based on cirrhosis (HR = 1.771; 95% CI: 1.037, 3.024; p = 0.036), tumor number (HR = 1.428 ; 95% CI: 1.064, 1.915; p = 0.018), abutment of major vessels (HR = 1.670; 95% CI: 1.019, 2.559; p = 0.019), platelet counts (HR = 0.663; 95% CI: 0.446, 0.923; p = 0.015), ablative margin (HR = 2.473; 95% CI: 1.382; 4.439; p = 0.027) and number of ablation sessions (HR = 1.663; 95% CI: 1.446; 1.923; p = 0.015). These factors were then subjected to multivariate analysis, which revealed that the independent prognostic factors were tumor number (HR = 1.352 ; 95% CI: 1.003, 1.822; p = 0.048), abutment of major vessels (HR = 1.585; 95% CI: 1.033, 2.402; p = 0.034), and platelet counts (HR = 0.703; 95% CI: 0.504, 0.983; p = 0.040) ().
Table 3. Factors associated with OS after MWA for HCC according to univariate and multivariate analysis.
Table 4. Factors associated with RFS after MWA for HCC according to univariate and multivariate analysis.
Development of the nomograms
Sixteen possible risk factors for OS or RFS were evaluated with a Cox regression model. Etiology, albumin and AFP levels were found to strongly correlate with OS post-MWA in the training data set. depicts the resultant nomogram constructed for post-MWA OS prediction. On the other hand, the presence of abutment of major vessels, platelet count and number of tumors were determined to be the variables that correlated closely with post-MWA RFS. depicts the constructed nomogram for RFS prediction after MWA. The nomograms were constructed based on preidentified prognostic risk factors that were each allocated a predetermined score. The predicted risk of OS and RFS in each patient at 1-, 3-, and 5-years post-MWA represented the sum of all the values. The OS and RFS rates that were nomogram-stratified were then used to plot Kaplan-Meier curves in the training datasets (). According to the cutoff value of risk prediction in the nomogram, the cohort was divided into low-risk group and high-risk group (). The cumulative OS rates at 1-, 3-, and 5-year were 0.1%, 0.7% and 1.2% in the low-risk group and 1.7%, 6.3% and 6.3% in the high-risk group, respectively, and there were significantly statistical differences (p < 0.001). The RFS rates at 1-, 3-, and 5-year were 0.1%, 0.7% and 1.2% in the low-risk group and 1.7%, 6.3% and 6.3% in the high-risk group, respectively, and there were significantly statistical differences (p < 0.001).
Figure 3. The nomogram was developed in the training dataset. (A) Nomogram shows assessment of 1-, 3- and 5-year OS of elderly patients with EHCC after MWA; (B) Nomogram shows assessment of 1-, 3- and 5-year RFS of elderly patients with EHCC after MWA.
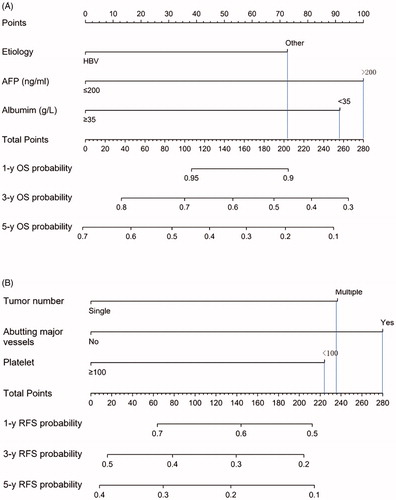
Figure 4. Graphs show results of Kaplan-Meier analyses according to the nomogram risk score in the training dataset. (A) 1-, 3- and 5-year OS in low-risk group was higher than that in high-risk group;(B) 1-, 3- and 5-year RFS in low-risk group was higher than that in high-risk group in the training dataset.
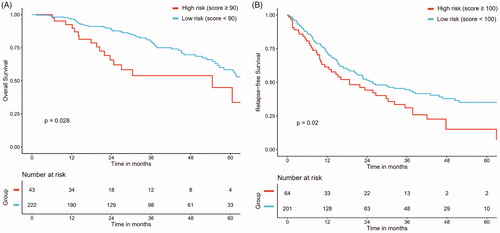
Table 5. OS and RFS rate in high-risk and low-risk groups.
Validation of the nomograms
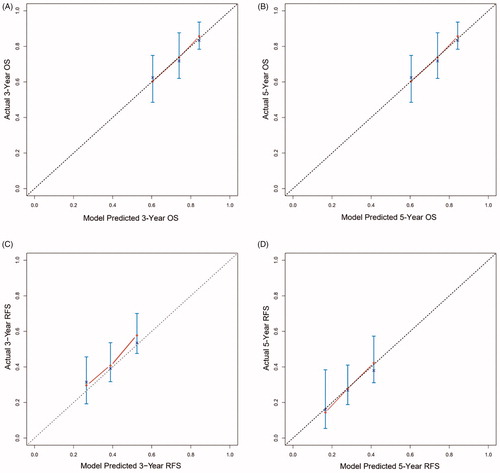
In the training dataset, the post-MWA OS assessment model concordance index (C-index) was 0.757, with 1000 bootstrap replications (95% CI: 0.645, 0.789). The calibration curves of the 3- and 5-year OS corresponded with the idealized 45° line () in the validation dataset. In the training dataset, the post-MWA RFS C-index was 0.733, with 1000 bootstrap replications (95% CI: 0.672, 0.774). The calibration curves of the 3- and 5-year RFS corresponded with the idealized 45° line () in the validation dataset. The likelihood of 3- and 5-year OS and RFS were consistent between clinical observations and nomogram predictions.
Figure 5. Calibration curve for predicting LTP after MWA at (A) 3-, and 5- years OS in the training data set; (B) 3-, and 5- years RFS in the training data set; (C) 3-, and 5- years OS in the validation data set; (D) 3-, and 5- years RFS in the validation data set. Nomogram-predicted probability of OS or RFS is plotted on the x-axis; actual OS or RFS is plotted on the y-axis.
Discussion
Patients aged 65 years or older may develop HCC, who had significantly lower long-term survival rates than younger patients [Citation5]. Elderly patients failed to receive larger traumatic treatments due to poor physical condition, therefore, image-guided percutaneous MWA as a minimally invasive technique is a suitable treatment in elderly patients. The current study evaluated the long-term survival outcomes and risk factors for OS and RFS in elderly patients with EHCC after MWA. There were three major findings, as follows: first, there were acceptable OS rates in elderly patients with EHCC who received MWA, with a 10-years rate of 32.8%. Nevertheless, the 10-years RFS rate only was 18.9%, due to the recurrence rate after MWA being 54.3%. Second, most studies found older age to be a risk factor for poor OS [Citation19,Citation20]; however, our study found that OS in patients with older than 75 years was comparable to that in patients aged between 65 and 75 years. Third, a clinicopathological-based nomogram that may be utilized for individual patient assessment of OS and RFS in elderly patients (>65 years old) with EHCC post-MWA was constructed.
Previous studies have shown that surgical resection and RFA are effective and safe in selecting elderly patients with HCC [Citation21–25]. However, there is a lack of data regarding risk factors associated with survival outcomes after MWA in older patients with HCC. In our study, we summarized all the risk factors related to the survival and recurrence of elderly patients with HCC received MWA. To develop accurate prediction models for survival outcomes of elderly patients, we compiled clinical several variables, including demographic, history, tumor data and laboratory findings. In our study, HCV or other etiologies, high AFP levels, and low albumin levels were associated with a low OS rate; multiple tumors, abutting major vessels and low platelet levels were associated with high recurrence rates after MWA, these were similar to findings in the existing literature. Several studies have previously demonstrated that age is an independent prognostic factor after thermal ablation [Citation26–28]. However, older age was not deemed to be a risk factor for survival given the relatively short remaining lifespan of this cohort compared with younger patients. In addition, accumulated evidence demonstrates that untreated micrometastases from the primary tumor, the subsequent spread along intrasegmental branches and vascular invasion may contribute to LTP. Therefore, the development of AM is beneficial to reduce LTP. However, as a more common type of recurrence, IDR is far from the ablation zone may not be caused by the above reasons and these risk factors regarding OS and RFS should be investigated further.
Nomograms are increasingly being used to improve therapeutic decision making and may be developed to guide the selection of individualized therapy for specific patients [Citation29–31]. In our study, two nomograms comprising the above-mentioned variables were constructed to predict OS and RFS in a large cohort of elderly patients who underwent MWA for EHCC. This visual risk prediction tools may help physicians explain to patients the possible risks after MWA treatment. Additionally, the use of these nomograms prior to the initiation of treatment may further improve patient selection for clinical trials and treatment decision making and may strengthen patient-physician communication. Finally, randomization may be further stratified based on the presence of either two- or three-risk factors determined by the nomograms, which can help physicians making preoperative planning before MWA.
In RFS and OS-predicting nomograms, death and recurrence rates should ideally be more than 10 times the number of variables to reduce the expected error in the predicted probabilities to less than 10% [Citation32]. In our study, 79 patients died, and there were 144 cases of recurrences, which were 26 and 38 times greater than the total number of risk-related variables, respectively. The nomogram validation methods include resampling with bootstrapping and data splitting and resampling with bootstrapping is used to generate unbiased estimates of model performance without sacrificing sample size. A disadvantage of data splitting is the inevitable accuracy loss, as the final model is unable to be validated. Both the OS- and RFS-predicting nomograms were also subjected to external validation with a resampling method of 1000 bootstrap replications for the entire cohort, resulting in good C-indexes of 0.770 and 0.733, respectively. These results indicate that the nomograms possess higher reliability and precision. Moreover, the calibration curves of the 3- and 5-year OS and RFS corresponded with the idealized 45° line in the validation dataset. This result indicated that this clinicopathological-based nomogram has a stable predictive ability for survival outcomes of elderly patients with HCC.
Our study has several limitations. First, it was designed as a retrospective study. A prospective cohort study would allow greater elimination of bias in assessing the various risk factors. Second, the long duration of this study may have allowed time for the MWA operators to improve their technique, thereby affecting the rates of ablation efficacy depending on the patient’s time of enrollment in the study.
In conclusion, the established nomograms were found to be useful in determining risk of OS and RFS in elderly patients with EHCC after MWA, which can guide individual patient management. Nevertheless, this novel scoring system will require further validation in studies utilizing increased sample sizes to truly reflect the heterogenicity of the general population.
Disclosure statement
No potential conflict of interest was reported by the author(s).
References
- Oweira H, Petrausch U, Helbling D, et al. Early stage hepatocellular carcinoma in the elderly: a SEER database analysis. J Geriatr Oncol. 2017;8(4):277–283.
- Ueno M, Hayami S, Tani M, et al. Recent trends in hepatectomy for elderly patients with hepatocellular carcinoma. Surg Today. 2014;44(9):1651–1659.
- Njei B, Rotman Y, Ditah I, et al. Emerging trends in hepatocellular carcinoma incidence and mortality. Hepatology. 2015;61(1):191–199.
- Pignata S, Gallo C, Daniele B, et al. Crit Rev Oncol Hematol. 2006;59(3):243–249.
- Guo H, Wu T, Lu Q, et al. Hepatocellular carcinoma in elderly: characteristics at presentation and outcome of hepatocellular carcinoma (HCC) in the elderly. A study of the Cancer of the Liver Italian Program (CLIP)linical characteristics, treatments and outcomes compared with younger adults. PLOS One. 2017;12(9):e0184160.
- Okamura Y, Sugiura T, Ito T, et al. The short- and long-term outcomes in elderly patients with hepatocellular carcinoma after curative surgery: a case-controlled study with propensity score matching. Eur Surg Res. 2018;59(5–6):380–390.
- Mastoraki A, Tsakali A, Papanikolaou IS, et al. Outcome following major hepatic resection in the elderly patients. Clin Res Hepatol Gastroenterol. 2014;38(4):462–466.
- Brozzetti S, Bezzi M, De Sanctis GM, et al. Elderly and very elderly patients with hepatocellular carcinoma. Strategy for a first line treatment. Ann Ital Chir. 2014;85:120–128.
- Cho E, Cho HA, Jun CH, et al. A review of hepatocellular carcinoma in elderly patients focused on management and outcomes. In Vivo. 2019;33(5):1411–1420.
- Shen X, Ma S, Tang X, et al. Clinical outcome in elderly Chinese patients with primary hepatocellular carcinoma treated with percutaneous microwave coagulation therapy (PMCT): a Strobe-compliant observational study. Medicine (Baltimore). 2018;97(35):e11618.
- Wang YM, Qian GJ, Xu Y, et al. [Efficacy of microwave ablation in treatment of hepatocellular carcinoma within the Milan criteria: a report of 696 cases]. Zhonghua Gan Zang Bing Za Zhi. 2017;25(5):344–348.
- Groeschl RT, Pilgrim CH, Hanna EM, et al. Microwave ablation for hepatic malignancies: a multiinstitutional analysis. Ann Surg. 2014;(6)259:1195–1200.
- Balachandran VP, Gonen M, Smith JJ, et al. Nomograms in oncology: more than meets the eye. Lancet Oncol. 2015;16(4):e173–e180.
- Takuma Y, Shota I, Miyatake H, et al. Nomograms to predict the disease-free survival and overall survival after radiofrequency ablation for hepatocellular carcinoma. Intern Med. 2018;57(4):457–468.
- Ye L, Shi S, Zeng Z, et al. Nomograms for predicting disease progression in patients of Stage I non-small cell lung cancer treated with stereotactic body radiotherapy. Jpn J Clin Oncol. 2018;48(2):160–166.
- Bruix J, Sherman M, American Association for the Study of Liver Diseases. Management of hepatocellular carcinoma: an update. Hepatology. 2011;53(3):1020–1022.
- Ni JY, An C, Zhang TQ, et al. Predictive value of the albumin-bilirubin grade on long-term outcomes of CT-guided percutaneous microwave ablation in intrahepatic cholangiocarcinoma. Int J Hyperthermia. 2019;36:328–336.
- Wang X, Sofocleous CT, Erinjeri JP, et al. Margin size is an independent predictor of local tumor progression after ablation of colon cancer liver metastases. Cardiovasc Intervent Radiol. 2013;36(1):166–175.
- Wan S, Nie Y, Zhu X. Development of a prognostic scoring model for predicting the survival of elderly patients with hepatocellular carcinoma. Peer J. 2020;8:e8497.
- Ozenne V, Bouattour M, Goutté N, et al. Prospective evaluation of the management of hepatocellular carcinoma in the elderly. Dig Liver Dis. 2011;43(12):1001–1005.
- Bove A, Bongarzoni G, Di RRM, et al. Efficacy and safety of ablative techniques in elderly HCC patients. Ann Ital Chir. 2011;82(6):457–463.
- Shin J, Yu JH, Jin YJ, et al. Effective therapeutic options for elderly patients with hepatocellular carcinoma: a nationwide cohort study. Medicine (Baltimore). 2019;98(30):e16150.
- Nishikawa H, Osaki Y, Iguchi E, et al. Percutaneous radiofrequency ablation for hepatocellular carcinoma: clinical outcome and safety in elderly patients. J Gastrointestin Liver Dis. 2012;21:397–405.
- Yu B, Ding Y, Liao X, et al. Radiofrequency ablation versus surgical resection in elderly patients with early-stage hepatocellular carcinoma in the era of organ shortage. Saudi J Gastroenterol. 2018;24(6):317–325.
- Peng ZW, Liu FR, Ye S, et al. Radiofrequency ablation versus open hepatic resection for elderly patients (>65 years) with very early or early hepatocellular carcinoma. Cancer. 2013;119(21):3812–3820.
- Yu J, Liang P. Status and advancement of microwave ablation in China. Int J Hyperthermia. 2017;33(3):278–287.
- Ding J, Zhou Y, Wang Y, et al. Percutaneous microwave ablation of exophytic tumours in hepatocellular carcinoma patients: Safe or not. Liver Int. 2017;37(9):1365–1372.
- Liang P, Yu J, Yu XL, et al. Percutaneous cooled-tip microwave ablation under ultrasound guidance for primary liver cancer: a multicentre analysis of 1363 treatment-naive lesions in 1007 patients in China. Gut. 2012;61(7):1100–1101.
- He W, Peng B, Tang Y, et al. Nomogram to predict survival of patients with recurrence of hepatocellular carcinoma after surgery. Clin Gastroenterol Hepatol. 2018;16(5):756–764.e10.
- Wang F, Zhang H, Wen J, et al. Nomograms forecasting long-term overall and cancer-specific survival of patients with oral squamous cell carcinoma. Cancer Med. 2018;7(4):943–952.
- Shim JH, Jun MJ, Han S, et al. Prognostic nomograms for prediction of recurrence and survival after curative liver resection for hepatocellular carcinoma. Ann Surg. 2015;261(5):939–946.
- Iasonos A, Schrag D, Raj GV, et al. How to build and interpret a nomogram for cancer prognosis. J Clin Oncol. 2008;26(8):1364–1370.