
Abstract
Purpose
To investigate the inter-observer reliability of ultrasound (US) measurement in volume and volume reduction rate (VRR) of benign thyroid nodules during the follow-up of radiofrequency ablation (RFA).
Materials
This retrospective study evaluated 76 patients with 88 benign thyroid nodules who underwent RFA. Two independent observers performed the US measurements during the same follow-up visit. The Bland–Altman analysis was used to evaluate the inter-observer reliability of volume and VRR (logarithmic transformation). The mean difference and 95% limits-of-agreement (LOA) were obtained after antilogarithm.
Results
No significant differences were found in the volume and VRR measurements during a mean follow-up time of 35.52 ± 12.82 months. After antilogarithms, the mean difference of volume was 0.9961, 0.9987, 1.0016, 0.9972, 0.9977 and 0.9969 at 1, 3, 6, 12, 24 and 36 months, respectively. The 95% LOA of volume became wider over the follow-up period, and the largest one was between 0.8471 and 1.1733 at 36 months. The 95% LOA of VRR became narrower over the follow-up period, and the largest one was between 0.9541 and 1.0469 at 1 month. The incidence of regrowth was 20.45% and the largest 95% LOA of regrowth nodules was between 0.9028 and 1.284 at 12 months. At the same follow-up period, VRR had a narrower 95% LOA than volume. Compared with volume ≥10 ml, nodules <10 ml revealed a larger 95% LOA in both the volume and VRR.
Conclusion
The inter-observer reliability of the US measurements of benign thyroid nodules during the follow-up period of RFA was acceptable. The variation by different observers could not affect the evaluation of efficacy.
Introduction
Thyroid nodules are a common disease in the general population, affecting 20–70% of individuals [Citation1]. Although most nodules are incidental findings of asymptomatic and benign nodules that require observation only, 20% of nodules require treatment because of progressive growth and cosmetic or symptomatic problems [Citation2]. Surgery is the standard treatment for thyroid nodules. However, it is associated with general anesthesia, complications and scar formation. Levothyroxine therapy is another option. Unfortunately, its efficacy is still debatable [Citation3]. Thus, minimally invasive thermal ablation techniques, including radiofrequency ablation (RFA), microwave ablation and laser ablation have been widely used with excellent results [Citation4–8].
RFA has been recommended as a safe and effective alternative to surgery for benign thyroid nodules [Citation9–12]. It can selectively destroy the targeted nodule and induce irreversible cell injury [Citation13]. After ablation, large amounts of nodule debris are gradually reabsorbed, which usually takes months to years [Citation14]. Therefore, changes in volume are important indices for evaluating the efficacy of ablation. Moreover, the parameters to evaluate the efficacy, such as volume reduction rate (VRR), technique success and nodule regrowth [Citation15], are based on the volume measurement at each follow-up period. As changes in nodule volume directly reflect treatment efficacy and indicate the need for nodule management during the follow-up [Citation16], accurate and reliable nodule volume measurement is essential. Although thyroid ultrasound (US) is easily accessible, noninvasive, cost-effective and the most common method for nodule measurement [Citation17], its being observer-dependent is the mean disadvantage that may result in variability [Citation17,Citation18]. A few studies have demonstrated that the inter-observer reliability of nodule volume measurement by US was from ±13.1% to ±48.6% [Citation16,Citation18,Citation19]. However, to the best of our knowledge, no studies reported the inter-observer reliability of nodule volume or VRR during the follow-up period of RFA.
Therefore, the purpose of this study was to investigate the inter-observer reliability of US measurement in the volume and VRR of thyroid nodules during the follow-up period of RFA.
Materials and methods
This retrospective study was approved by the Institutional Review Board of Chinese PLA General Hospital (approval number: S2019-211-01). Written informed consent was obtained from all the patients prior to RFA.
Patients
All the enrolled patients fulfilled these inclusion criteria: (1) confirmation of benign nodule status on two separate fine-needle aspiration (FNA) or core-needle biopsy (CNB); (2) no suspicious malignant features on US examination; (3) solid (≤10% of fluid component) or predominantly solid nodules (11–50% of fluid component) [Citation15]; (4) report of cosmetic and/or symptomatic problems or concern of nodules growing rapidly or concern of malignant transformation; (5) serum thyroid hormone and thyrotropin levels within normal ranges; (6) refusal or ineligibility for surgery; (7) follow-up time ≥24 months; (8) accept two complete new sets of US scans by two observers at each follow-up period. Exclusion criteria were: (1) malignancy findings or follicular neoplasm on FNA or CNB; (2) nodules with benign result on FNA or CNB had suspicious of malignancy in US; (3) follow-up time <24 months; (4) refuse two complete new sets of US scans by two observers at each follow-up period.
From August 2014 to March 2018, a total of 137 patients with benign solid/predominantly solid thyroid nodules accepted two complete new sets of US scans by two observers at each follow-up period. Among them, patients with follow-up time less than 24 months (N = 61) were excluded. At last, 76 patients with 88 benign thyroid nodules were evaluated in this study.
Pre-ablation assessment
US before and after RFA, as well as during follow-up were performed using a Philips iU22 Ultrasound System (Philips Healthcare, Bothell, WA) with a L12-5 linear array transducer or a Mindray M9 Ultrasound System (Mindray, Shenzhen, China) with a L12-4 linear array transducer. RFA were all performed using a Siemens Acuson Sequoia 512 Ultrasound System (Siemens, Mountain View, CA) with a 6L3 linear array transducer. CEUS was used to evaluate the ablated zone of the nodule immediately after RFA. Sulfur hexafluoride (SonoVueR, Bracco International, Milan, Italy) was used as US contrast agent. CEUS was performed after bolus injection of SonoVue (2.4 ml), followed by a 5 ml of normal saline flush.
Before RFA procedure, thyroid nodule was measured by an experienced US physician with more than 20-year experience in thyroid US and interventional US (Y.K.L.) who performed RFA procedure. Then, the initial volume was calculated by ellipsoid formula: V = πabc/6 (V is the volume, while a is the largest diameter, b and c are the other two perpendicular diameters).
Ablation procedure
A bipolar RFA generator (CelonLabPOWER, Olympus Surgical Technologies Europe, Hamburg, Germany) and an 18-gauge bipolar RF electrodes with 0.9 cm active tip were used (CelonProSurge micro 100-T09, Olympus Surgical Technologies Europe, Hamburg, Germany) in this study.
Patients lay on an operating table in the supine position with the neck extended. Local anesthesia with 1% lidocaine was administered. RFA was performed using the trans-isthmic approach, hydrodissection technique and moving-shot technique. CEUS was performed immediately after the RFA procedure to evaluate the ablation area. If any enhancement existed, a complementary ablation could be performed. Each patient was observed for 1–2 h in the hospital while any adverse event including complication and side effect occurring during and immediately after ablation were carefully evaluated according to the clinical signs and symptoms [Citation15].
Post-ablation evaluation
Two physicians (Observer A, Y.L. with more than 10-year experience in thyroid US; Observer B, X.J. with 3-year experience in thyroid US) performed all the measurements of ablated nodules at each follow-up period. Before this study, to obtain objective measurement, the two observers standardized the measurements method. The anteroposterior and transverse diameters of nodule were measured on the transverse US image with the largest dimensions, and the longitudinal diameter was measured on the longitudinal US image with the largest dimensions. Nodules were measured with the calipers placed outside of any visible halo [Citation20].
Patients were scanned consecutively by the observers during the same visit. Only one observer was present in the US room at any time. As the volume measurements were performed as a part of clinical follow-up evaluation of RFA, the previous US finding of ablated nodule was known to the observers. For each patient, each observer performed a complete new set of US scans, without knowledge of the other observer’s results. When the margin of ablated nodule was detected, the measurements of three diameters were repeated twice to calculate a mean volume of each observer. Then, VRR was calculated based on the mean volume of each observer. Thus, a total of 6 volume measurements and one VRR were obtained for each nodule at each follow-up period.
After RFA, patients were followed up at 1,3,6,12 months and every 12 months thereafter by US and clinical evaluation. The volume reduction was calculated as follows: VRR = ([initial volume-final volume] × 100%)/initial volume. Technique success was defined as a > 50% volume reduction at last follow-up point [Citation15]. Regrowth was defined as an increased in total volume 50% over the previously recorded smallest volume [Citation15].
Statistical analysis
Statistical analysis was performed using the SPSS statistical software (Version 25.0, SPSS Inc., Chicago, IL) and GraphPad Prism (Version 8.0.0, La Jolla, CA) software. Continuous data were expressed as mean ± SD (range). Wilcoxon’s signed rank tests were used for pairwise comparisons. A difference with p < .05 was considered as statistically significant.
The inter-observer reliability of nodule volume and VRR was assessed using the Bland–Altman analysis. The mean difference and 95% limits-of-agreement (LOA, mean difference ± 1.96SD) were calculated. The mean difference, also called bias, was the tendency for one modality to underestimate or overestimate the measurement relative to the other [Citation21]. LOA was the range within which 95% of the differences between measurements by the two observers would lie [Citation22] and expressed as the absolute magnitude of the reliability between the two observers. The width of the LOA varied with the precision of the measurements. LOA was wider when measurements were imprecise and vice versa [Citation23]. Before the Bland–Altman analysis, the Kolmogorov–Smirnov test was used to assess the normality of the distribution. If a non-normal distribution was shown, a logarithmic transformation was performed, and the Bland–Altman analysis was applied to the transformed data. Antilogarithm was performed to obtain values relating to the ratios of measurements by the two observers to fully understand the LOA and easily interpret the results of the Bland–Altman analysis [Citation22,Citation23]. Moreover, the conclusion on reliability should be made based on the width of LOA in comparison to a priori defined clinical criteria [Citation23,Citation24]. The clinical criteria for thyroid nodule volume using the ellipsoid formula were reported to be between ±13.1% and ±48.6% [Citation16,Citation18,Citation19]. Therefore, the acceptable clinical criteria of volume in this study should be an LOA ranging from 0.5 to 1.5. The inter-observer reliability was determined based on the total number of nodules and then on the subgroups defined by the initial volume before RFA, namely <10 ml and ≥10 ml.
Results
The clinical characteristics of patients are presented in . A total of 76 patients (67 females, nine males) with 88 benign thyroid nodules were evaluated in this study. The mean age was 46.53 ± 10.21 years and the initial volume was 10.49 ± 14.87 ml. The number of nodules <10 ml was 59 and ≥10 ml was 29.
Table 1. Clinical characteristics of patients before RFA.
During the RFA, the mean power was 5.67 ± 1.78 W. The mean RFA time was 376.37 ± 264.32 s and the mean energy was 2110.67 ± 1865.17 J.
Efficacy
After a mean follow-up time of 35.52 ± 12.82 months, the volume decreased significantly from 10.49 ± 14.87 ml to 0.32 ± 0.67 ml (p < .001) with a mean VRR of 94.29 ± 8.82% (). At last follow-up, technique success rate was 95.45% (84/88). Symptom score significant decreased from 2.69 ± 2.29 to 0.98 ± 1.27 (p < .001). Cosmetic score significantly decreased from 2.36 ± 1.25 to 1.36 ± 0.66 (p < .001).
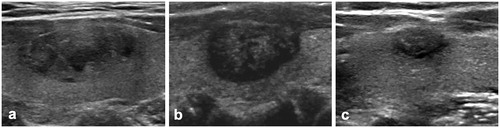
Figure 1. US image of a 48-year-old female with a benign thyroid nodule. (a) Before RFA, US image showed a solid benign thyroid nodule located in the left thyroid lobe with an initial volume of 1.78 ml. (b) At 1 month after RFA, the volume of nodule was 0.98 ml and the VRR was 44.65%. (c) At 36 months after RFA, nodule shrunk to 0.21 ml and the VRR was 88.05%.
The overall incidence of nodule regrowth was 20.45% (18/88). All the regrowth nodules were confirmed benign by CNB. The time of nodule regrowth developed were as follows: 1 at 6 months, 5 at 12 months, 7 at 24 months, 3 at 36 months and 2 at 48 months. The mean time of nodule regrowth developed was at 24.33 ± 12.42 months.
Inter-observer reliability
The volume and VRR measured by the two observers at each follow-up period are summarized in . No significant differences in volume and VRR were found (all p > .05). The inter-observer reliability of volume and VRR by the two observers are presented in . The Bland–Altman analysis showed that after antilogarithms, the mean differences of volume and VRR were approximately 1 during the follow-up period. The 95% LOA of volume became wider and larger over the follow-up period (), whereas the 95% LOA of VRR became narrower over the follow-up period (). After the antilogarithm, the largest 95% LOA of volume was from 0.8471 to 1.1733 at 36 months, which meant that in approximately 95% of cases, the volume measured by observer A was between 0.8424 and 1.1793 times the volume measured by observer B. The largest 95% LOA of VRR was from 0.9541 to 1.0469 at 1 month, which meant that the VRR measured by observer A was between 0.9541 and 1.0469 times the VRR measured by observer B. This applied to all the reported LOA hereinafter with corresponding variations. At the same follow-up period, VRR had a narrower 95% LOA than volume. Moreover, compared with an initial volume ≥10 ml at the same follow-up period, initial volume <10 ml revealed a larger 95% LOA in both the volume and VRR.
Figure 2. The Bland–Altman plots of volume by the observers during the follow-up period. The Bland–Altman plots of volume measured by the two observers at 1, 3, 6, 12, 24 and 36 months after RFA are shown from (a) to (f). Logarithmic transformation was used to show the data. The x-axes showed the log means of volume measurements by the observers. The y-axes showed the log differences between the observers. Solid lines were the mean difference (bias). Top and bottom dashed lines correspond to upper and lower margins of 95% limits-of-agreement (LOA).
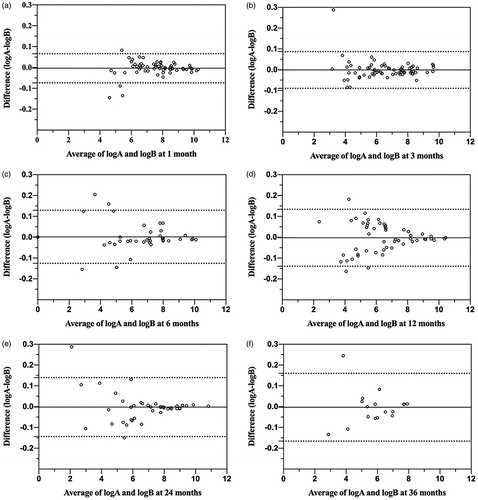
Figure 3. The Bland–Altman plots of VRR by the observers during the follow-up period. The Bland–Altman plots of VRR measured by the two observers at 1, 3, 6, 12, 24 and 36 months after RFA are shown from (a) to (f). Logarithmic transformation was used to show the data. The x-axes showed the log means of VRR measured by the observers. The y-axes showed the log differences between the observers. Solid lines were the mean difference (bias). Top and bottom dashed lines correspond to upper and lower margins of 95% limits-of-agreement (LOA).
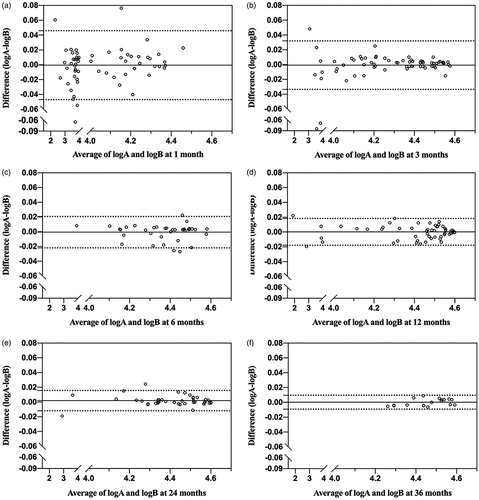
Table 2. Volume and VRR measured by two observers at each follow-up period of RFA.
Table 3. Inter-observer reliability of volume and VRR during the follow-up by the Bland–Altman analysis.
The inter-observer reliability of volume in the non-regrowth and regrowth group are presented in . The mean differences in both groups were also approximately 1. The 95% LOA in the non-regrowth group became larger over the follow-up, and the largest 95% LOA was from 0.8264 to 1.2248 at 36 months. By contrast, in the regrowth group, the 95% LOA increased in the first 12 months and then decreased slightly. The largest 95% LOA was from 0.9038 to 1.1284 at 12 months ().
Figure 4. The Bland–Altman plots of volume in the regrowth group by the observers during the follow-up period. The Bland–Altman plots of volume in the regrowth group measured by the two observers at 1, 3, 6, 12, 24 and 36 months after RFA are shown from (a) to (f). Logarithmic transformation was used to show the data. The x-axes showed the log means of volume measurements by the observers. The y-axes showed the log differences between the observers. Solid lines were the mean difference (bias). Top and bottom dashed lines correspond to upper and lower margins of 95% limits-of-agreement (LOA).
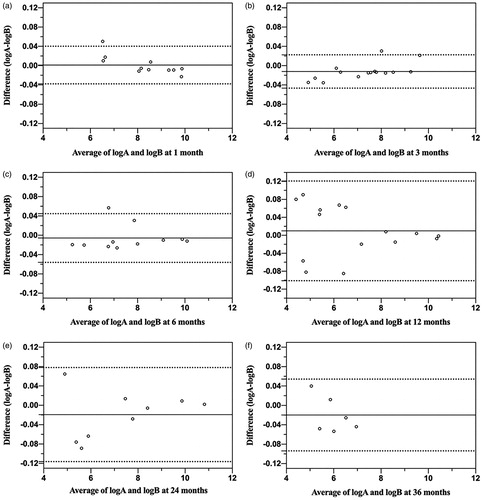
Table 4. Inter-observer reliability of volume in the non-regrowth group and regrowth group during the follow-up by the Bland–Altman analysis.
Discussion
The inter-observer reliability of thyroid nodule measurement during the follow-up of thermal ablation is unclear. This study showed that the 95% LOA of volume became wider and larger over the follow-up period, whereas the 95% LOA of VRR became narrower over the follow-up period. The largest 95% LOA of volume was within the clinical criteria. At the same follow-up period, VRR had a narrower 95% LOA than volume. Compared with volume ≥ 10 ml, nodules < 10 ml revealed a larger 95% LOA in both the volume and VRR.
US, as a safe, cost-effective and noninvasive measurement modality, is the most common method to evaluate thyroid nodules, both in the pretreatment and posttreatment setting [Citation12]. After ablation, changes in nodule volume directly reflected treatment efficacy and indicated the need for nodule management during the follow-up period [Citation16]. Other parameters for efficacy, such as VRR, technique success and nodule regrowth, were all based on the volume measurement. Therefore, there is a definite requirement for accurate and reliable volume measurement on US. However, US has a major drawback, which is the observer dependence [Citation18]. Brauer et al. [Citation19] found that the inter-observer reliability of thyroid volume was 48.96% by a logarithmic method and suggested that the volume changes of at least 49% or more could be interpreted as nodule reduction, growth or therapy effects, which was also recommended by the 2015 American Thyroid Association Guidelines as the cutoff value of volume change [Citation9]. Recently, two studies used the Bland–Altman analysis to evaluate the inter-observer reliability of nodule volume measurement and found that the 95% LOA was ±13.1% and ±48.6%, respectively [Citation16,Citation18]. However, to the best of our knowledge, no study has reported the inter-observer reliability of nodule measurement after ablation. This study found that as the nodule volume decreased over the follow-up period, its 95% LOA became wider and larger. The largest 95% LOA of volume was between 0.8471 and 1.1733 at 36 months, which was still within the clinical criteria. This indicated that the volume evaluation during the follow-up by different observers was acceptable. Only reliable post-ablation evaluation can help better understand the efficacy of RFA, which reduces the volume of nodules and relieves the related symptoms and cosmetic problems, making RFA was a reliable option for patients with symptomatic benign nodules. Moreover, this study also found that compared with an initial volume of ≥10 ml at the same follow-up period, an initial volume <10 ml revealed a larger 95% LOA. This was consistent with a previous study by Choi et al. [Citation16], which found that the inter-observer reliability in volume measurement was greater among the thyroid nodules with a maximum diameter of <2 cm than among nodules with a maximum diameter of ≥2 cm. These results indicated that the inter-reliability of volume measurement might be greater in patients with small nodules, and thus the measurement for small nodules should also be cautious.
VRR is another important index for post-ablation evaluation. VRR ≥50% is defined as the technique success, which was also used to evaluate the efficacy of ablation [Citation15]. Meta-analysis showed that the volume reduction after RFA was significant, and the VRR of benign nodules was 87% at 24 months after RFA [Citation25]. A similar VRR was observed in this study, which was 88% at 24 months. After a mean follow-up time of 35.52 ± 12.82 months, the VRR was 94%. Furthermore, we also investigated the 95% LOA of VRR at each follow-up period. In this study, the 95% LOA of VRR became narrower over the follow-up period, and the largest one was between 0.9541 and 1.0469 at 1 month. Compared with the volume at each follow-up period, VRR had a much narrower 95% LOA, suggesting that the inter-observer reliability of VRR was much better than that of volume. The explanation might be associated with its calculation formula, which could also be converted into VRR = [1 – (final volume/initial volume)] × 100%. As the initial volume was determined before ablation in the routine clinical procedure, its inter-observer reliability was not available. Therefore, as the 95% LOA of volume became wider and larger over the follow-up period, the 95% LOA of VRR became narrower.
RFA and other thermal ablation techniques have been considered safe and effective alternatives to surgery for benign thyroid nodules [Citation4,Citation5,Citation9–12], and the long-term efficacy has attracted research attention. Several studies reported that after 2–3 years of ablation, 4.1–37.5% of the treated nodules developed regrowth [Citation26–32]. Nodule regrowth may be associated with incompletely resolved symptoms [Citation33], or even a potential sign of malignancy [Citation12]; thus, most patients needed additional treatment. Sim et al. [Citation27] reported that the nodule volume consisted of two parts after RFA, which was the ablated volume and vital volume. They found that tracing the vital volume, calculated as the total volume minus the ablated volume, could indicate regrowth earlier than tracing total volume. Schiaffino et al. [Citation34] recently reported that the reliability of ablated volume measurement was higher with CEUS than with US, and thus CEUS should be used for the early prediction of regrowth. However, the inter-observer reliability of the total volume measurement was not reported. Considering that the definition of regrowth was an increase in total volume 50% over the previously recorded smallest volume [Citation15], it was very important to obtain a reliable volume measurement at each follow-up period. This study showed that in the regrowth group, each follow-up presented mean differences of approximately 1. The 95% LOA became wider in the first 12 months and then decreased slightly. The largest 95% LOA was at 12 months and within clinical criteria. These results showed that the evaluation of regrowth nodules was not affected by the volume measured by different observers during the follow-up period.
US measurements were based on imaging plane acquisition and manipulation of calipers on the screen [Citation18]. The variation in measurements depended on several factors, including transducer location, angulation, pressure and the differences in the manipulation of the calipers [Citation18]. In the clinical routine procedure of post-ablation assessment, it was almost impossible to measure the nodule by the same observer at each follow-up period. It was also difficult to reproduce the same two-dimensional image plane at each follow-up period even for the same observer. Although this study showed that the 95% LOA of volume was within the clinical criteria, the post-ablation measurement still needed to be carefully performed. The measurement methods of the nodule after ablation should to be standardized. The definition of the three diameters needed to be clarified, and the measurements could be repeated twice to obtain the mean volume. Physicians should also preview the previous US images and check the ablated nodule location before measurement. When the ablated nodule decreased and re-absorbed during the follow-up, it might be difficult to differentiate it from other small nodules, particularly in patients with multiple nodules.
There were some limitations to this study. First, it was a single-center study. Second, the sample size was relatively small. Considering each subgroup's number, the nodules in this study were not divided into three subgroups, which was recommended by the recent reporting criteria for thyroid ablation [Citation15]. Third, the follow-up time was relatively short. Longer-term inter-observer reliability of US measurements needs further investigation. Moreover, Sim et al. [Citation27] found that there were two peaks of regrowth after ablation. The first peak began at 12 months and tended to be prominent at 2–4 years of follow-up, and the second peak appeared 5 years later. As the follow-up time was 35.52 ± 12.82 months in this study, the inter-observer reliability of the US measurements of regrowth nodules was focused on the first peak of regrowth.
In conclusion, the inter-observer reliability in the US measurements of benign thyroid nodules during the follow-up period of RFA was acceptable. In clinical post-ablation follow-up, the variation by different observers could not affect the evaluation of efficacy.
Disclosure statement
The authors declare that there is no conflict of interest that could be perceived as prejudicing the impartiality of the research reported.
Additional information
Funding
References
- Gharib H, Papini E, Paschke R, et al. American Association of Clinical Endocrinologists, Associazione Medici Endocrinologi, and European Thyroid Association medical guidelines for clinical practice for the diagnosis and management of thyroid nodules. J Endocrinol Invest. 2010;16(Suppl. 1):1–50.
- Durante C, Grani G, Lamartina L, et al. The diagnosis and management of thyroid nodules: a review. JAMA. 2018;319(9):914–924.
- Bandeira-Echtler E, Bergerhoff K, Richter B. Levothyroxine or minimally invasive therapies for benign thyroid nodules. Cochrane Database Syst Rev. 2014;CD004098. www.cochranelibrary.com.
- Mauri G, Gennaro N, Lee MK, et al. Laser and radiofrequency ablations for benign and malignant thyroid tumors. Int J Hyperthermia. 2019;36(2):13–20.
- Mainini AP, Monaco C, Pescatori LC, et al. Image-guided thermal ablation of benign thyroid nodules. J Ultrasound. 2017;20(1):11–22.
- Deandrea M, Trimboli P, Garino F, et al. Long-term efficacy of a single session of RFA for benign thyroid nodules: a longitudinal 5-year observational study. J Clin Endocrinol Metab. 2019;104(9):3751–3756.
- Zhi X, Zhao N, Liu Y, et al. Microwave ablation compared to thyroidectomy to treat benign thyroid nodules. Int J Hyperthermia. 2018;34(5):644–652.
- Khanh HQ, Hung NQ, Vinh VH, et al. Efficacy of microwave ablation in the treatment of large (≥3 cm) benign thyroid nodules. World J Surg. 2020;44(7):2272–2279.
- Haugen BR, Alexander EK, Bible KC, et al. 2015 American Thyroid Association Management Guidelines for adult patients with thyroid nodules and differentiated thyroid cancer: the American Thyroid Association Guidelines Task Force on Thyroid Nodules and Differentiated Thyroid Cancer. Thyroid. 2016;26(1):1–133.
- Kim JH, Baek JH, Lim HK, et al. 2017 thyroid radiofrequency ablation guideline: Korean Society of Thyroid Radiology. Korean J Radiol. 2018;19(4):632–655.
- Dietrich CF, Müller T, Bojunga J, et al. Statement and recommendations on interventional ultrasound as a thyroid diagnostic and treatment procedure. Ultrasound Med Biol. 2018;44(1):14–36.
- Papini E, Pacella CM, Solbiati LA, et al. Minimally-invasive treatments for benign thyroid nodules: a Delphi-based consensus statement from the Italian Minimally-Invasive Treatments of the Thyroid (MITT) Group. Int J Hyperthermia. 2019;36(1):376–382.
- Chu KF, Dupuy DE. Thermal ablation of tumours: biological mechanisms and advances in therapy. Nat Rev Cancer. 2014;14(3):199–208.
- Wu F. Heat-based tumor ablation: role of the immune response. Adv Exp Med Biol. 2016;880:131–153.
- Mauri G, Pacella CM, Papini E, et al. Image-guided thyroid ablation: proposal for standardization of terminology and reporting criteria. Thyroid. 2019;29(5):611–618.
- Choi YJ, Baek JH, Hong MJ, et al. Inter-observer variation in ultrasound measurement of the volume and diameter of thyroid nodules. Korean J Radiol. 2015;16(3):560–565.
- Russ G, Bonnema SJ, Erdogan MF, et al. European thyroid association guidelines for ultrasound malignancy risk stratification of thyroid nodules in adults: the EU-TIRADS. Eur Thyroid J. 2017;6(5):225–237.
- Lee HJ, Yoon DY, Seo YL, et al. Intraobserver and interobserver variability in ultrasound measurements of thyroid nodules. J Ultrasound Med. 2018;37(1):173–178.
- Brauer VFH, Eder P, Miehle K, et al. Interobserver variation for ultrasound determination of thyroid nodule volumes. Thyroid. 2005;15(10):1169–1175.
- Frates MC, Benson CB, Charboneau JW, et al. Management of thyroid nodules detected at US: Society of Radiologists in Ultrasound Consensus Conference Statement. Radiology. 2005;237(3):794–800.
- Anvari A, Halpern EF, Samir AE. Essentials of statistical methods for assessing reliability and agreement in quantitative imaging. Acad Radiol. 2018;25(3):391–396.
- Bland JM, Altman DG. Measuring agreement in method comparison studies. Stat Methods Med Res. 1999;8(2):135–160.
- Chhapola V, Kanwal SK, Brar R. Reporting standards for Bland–Altman agreement analysis in laboratory research: a cross-sectional survey of current practice. Ann Clin Biochem. 2015;52(Pt 3):382–386.
- Mantha S, Roizen MF, Fleisher LA, et al. Comparing methods of clinical measurement: reporting standards for Bland and Altman analysis. Anesth Analg. 2000;90(3):593–602.
- Trimboli P, Castellana M, Sconfienza LM, et al. Efficacy of thermal ablation in benign non-functioning solid thyroid nodule: a systematic review and meta-analysis. Endocrine. 2020;67(1):35–43.
- Lim HK, Lee JH, Ha EJ, et al. Radiofrequency ablation of benign non-functioning thyroid nodules: 4-year follow-up results for 111 patients. Eur Radiol. 2013;23(4):1044–1049.
- Sim JS, Baek JH, Lee J, et al. Radiofrequency ablation of benign thyroid nodules: depicting early sign of regrowth by calculating vital volume. Int J Hyperthermia. 2017;33(8):905–910.
- Døssing H, Bennedbaek FN, Hegedüs L. Long-term outcome following interstitial laser photocoagulation of benign cold thyroid nodules. Eur J Endocrinol. 2011;165(1):123–128.
- Valcavi R, Riganti F, Bertani A, et al. Percutaneous laser ablation of cold benign thyroid nodules: a 3-year follow-up study in 122 patients. Thyroid. 2010;20(11):1253–1261.
- Wang B, Han Z-Y, Yu J, et al. Factors related to recurrence of the benign non-functioning thyroid nodules after percutaneous microwave ablation. Int J Hyperthermia. 2017;33(4):459–464.
- Negro R, Greco G, Deandrea M, et al. Twelve-month volume reduction ratio predicts regrowth and time to regrowth in thyroid nodules submitted to laser ablation: a 5-year follow-up retrospective study. Korean J Radiol. 2020;21(6):764–772.
- Bernardi S, Giudici F, Cesareo R, et al. Five-year results of radiofrequency and laser ablation of benign thyroid nodules: a multicenter study from the Italian Minimally Invasive Treatments of the Thyroid Group. Thyroid. 2020. [Online ahead of print]
- Sim JS, Baek JH. Long-term outcomes following thermal ablation of benign thyroid nodules as an alternative to surgery: the importance of controlling regrowth. Endocrinol Metab. 2019;34(2):117–123.
- Schiaffino S, Serpi F, Rossi D, et al. Reproducibility of ablated volume measurement is higher with contrast-enhanced ultrasound than with B-mode ultrasound after benign thyroid nodule radiofrequency ablation—a preliminary study. J Clin Med. 2020;9(5):1504.