
 ?Mathematical formulae have been encoded as MathML and are displayed in this HTML version using MathJax in order to improve their display. Uncheck the box to turn MathJax off. This feature requires Javascript. Click on a formula to zoom.
Abstract
Purpose
Computer simulations of hepatic radio-frequency ablation (RFA) were performed to: (i) determine the dependence of the vessel wall heat transfer coefficient on geometrical parameters; (ii) study the conditions required for the occurrence of the directional effect of blood; and (iii) classify blood vessels according to their effect on the thermal lesion while considering blood coagulation. The information thus obtained supports the development of a multi-scale bio-heat model tailored for more accurate prediction of hepatic RFA outcomes in the vicinity of blood vessels.
Materials and methods
The simulation geometry consisted of healthy tissue, tumor tissue, a mono-polar RF-needle, and a single cylindrical blood vessel. The geometrical parameters of interest were the RF-needle active length and those describing blood vessel configuration. A simple, novel method to incorporate the effects of blood coagulation into the simulation was developed and tested.
Results
A closed form expression giving the dependence of the vessel wall heat transfer coefficient on geometrical parameters was obtained. Directional effects on the thermal lesion were found to occur for blood vessel radii between 0.4 mm and 0.5 mm. Below 0.4 mm blood coagulation blocked the flow.
Conclusions
The closed form expression for the heat transfer coefficient can be used in models of RFA to speed up computation. The conditions on vessel radii required for the occurrence of directional effects on the thermal lesion were determined. These conditions allow the classification of blood vessels. Different approximations to the thermal equation can thus be used for these vessel classes.
Introduction
In recent years, minimally invasive techniques such as radio-frequency ablation (RFA), microwave ablation, and cryotherapy have become popular in clinical practice for the treatment of liver cancer. In RFA, in particular, an alternating current flowing between the active region of an RF-needle inserted in the tumor and a ground pad is responsible for localized tissue ablation through heating.
During RFA, the challenge is to ablate the complete tumor without harming the adjacent healthy or vital structures [Citation1]. The final lesion is affected by fine-scale perfusion in the liver and by large vessels which have a strong localized cooling effect. The micro-vasculature in the ablated tissue is destroyed and blood coagulation occurs in the vessels neighboring the targeted area with diameter smaller than 3 mm [Citation2]. Moreover, imaging techniques currently used in clinical practice (e.g., CT and MRI) cannot detect small vessels in the liver (dia < 1 mm).
Mathematical modeling of the vessel effect could predict the temperature distribution in the liver and hence aid treatment planning. Such models must be fast yet accurate to be useful in practice. Chen and Saidel [Citation3] used the transient Pennes bio-heat equation with a 1D advection-diffusion approximation for the large blood vessel to study the effect of the vessel radius, distance between the RF-needle and vessel, and the angle between the RF-needle and vessel on the vessel cooling effect. They assumed the blood vessel wall heat transfer coefficient to be a constant independent of vessel radius. Huang used the steady Pennes bio-heat equation with a steady 1D convection-diffusion approximation for the large blood vessel for a similar study, using a constant blood vessel wall heat transfer coefficient. Shao et al. [Citation4] studied the cooling effect of complicated vessel trees. They examined the impact of varying the average distance of the needle from vascular structures, the total vascular volume, and the number of branches in the vascular structure on the cooling effect. They found that the cooling effect increases with decreasing distance, increasing vascular volume, and increasing number of blood vessel branches. Existing works on multi-scale modeling have not considered the possibility of directional effects of isolated vessels [Citation1,Citation5,Citation6]. While low blood flow-rates were found to cause a directional effect on the thermal lesion [Citation7], no detailed study has been performed yet on the influence of the vessel radius. A study by dos Santos et al. [Citation8] found the vessel wall heat transfer coefficient to be independent of temperature, but it did not comment on the dependence of this coefficient on geometrical parameters. To the best of our knowledge, simulation studies on RFA have not considered the possibility and effect of blood coagulation in vessels of diameter larger than 1 mm.
This work aims to address these shortcomings in the state of the art of RFA modeling, particularly focusing on (i) understanding the dependence of the heat transfer coefficient on geometrical parameters, (ii) determining the conditions at which directional effects and blood coagulation occur, and finally (iii) understanding the dependence of the thermal lesion on the blood vessel diameter.
Methods
Geometry
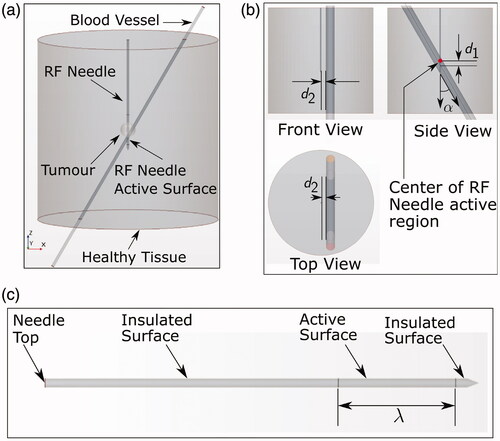
The computational geometry () consisted of a cylindrical healthy tissue region of both diameter and height 12 cm containing a tumor (radius 0.5 cm) positioned in the center, a simplified UniBlate® RF-needle (from Angiodynamics, New York, NY, USA), and a blood vessel of variable radius r. Both height and diameter of the cylindrical tissue were chosen to be equal to 12 cm, similarly to previous works found in literature [Citation9–11] and considered enough to avoid boundary condition effects. To reduce computational complexity, the internal structure of the RF-needle was assumed to be homogeneous with averaged material properties (density, specific heat capacity, thermal conductivity, and electrical conductivity). The exact outer dimensions of the RF-needle (diameter 1.5 mm) were used. The blood vessel position with respect to the needle was varied according to three parameters: d1, d2, and α (). This parametrization took advantage of the cylindrical symmetry of the domain. During the RFA procedure, the current passed through the active surface of the needle with variable length λ (), and toward the ground pad. Simulations of RFA were performed using different values of the variable parameters described above, and were grouped into two sets (SET A and SET B) based on the way the parameter values varied.
Figure 1. (a) Simulation geometry. The bottom surface of the tissue cylinder was electrically grounded. (b) Views of the simulation geometry showing the parameters α, d1, and d2. Note that the distance d1 is negative if the blood vessel axis is located below the center of the RF-needle active region in the side view shown and vice versa. (c) Enlarged view of the RF-needle geometry showing the definition of parameter λ. The axial length from the top surface to the active surface is 50 mm.
Governing equations
Bio-heat models for hepatic RFA require separate treatment of fine-scale perfusion and large blood vessels. A number of models describing the fine-scale perfusion effects have been proposed, but their experimental validation is currently difficult [Citation12–14]. It was decided to omit the fine-scale perfusion from the governing equations, since the focus of the present work is the effect of large blood vessels. The governing equations for solid tissue, blood, and RF-needle were given by
(1)
(1)
where the subscripts t, b, and n stand for tissue, blood, and RF-needle respectively. The constants ρi, Ci, Ti, ki, σi, and ϕi are respectively the density, specific heat, temperature, thermal conductivity, electrical conductivity, and electric potential for
Their values are listed in . The thermal and electrical conductivities of tissue and blood were considered temperature dependent. All specific heats and densities were assumed constant. A convection boundary condition,
W m–2, was applied to the tissue boundary, where
K. The blood inlet and outlet boundaries were kept at 310.15 K. The temperature and heat-flux were assumed continuous across all interfaces. Blood was assumed to be a Newtonian fluid and shear effects were neglected. Blood flow was assumed to be steady and laminar [Citation15].
Table 1. Table showing material property values used.
In EquationEquation (1)(1)
(1) the term
is responsible for heat advection, where
is the blood velocity which depends on the blood flow rate Q according to
(where η is the radial coordinate in the blood vessel cross-section) [Citation15]. The flow rate is assumed to be dependent on blood vessel radius r according to Murray’s law. This is an heuristic expression describing the relationship between the pipe diameter and the flow rate within a flow network [Citation16], given by:
(2)
(2)
Here di, Q, μ, ξ, and c are the vessel diameter, volume flow-rate, dynamic viscosity of the fluid, power-to-mass ratio of the pumping system, and a constant material property of the pipes respectively. The constants and
are the pipe material density and fluid density respectively. The constant material property
is independent of the vessel radius and therefore its value has been derived back from EquationEquation (2)
(2)
(2) using known values for the portal vein for the other parameters. In particular, the values used are:
and
Pa s for hepatic vessels with di = 10 mm [Citation17], thus resulting in a value of
The expression represents the RF heat source densities for
The electric potential is governed by the quasi-static approximation
(3)
(3)
where
[Citation1]. The power input to the domain was chosen to be dependent on the active length lambda and equal to
W where λ is expressed in meters. The chosen value is similar to the one used for the model validation with an active length of 3 cm (see Section ‘Model validation’) and enough to lead to typical temperatures in RFA procedures (below 100
C).
The top and curved surfaces of the tissue boundary were electrically insulated, while the bottom surface had V. A time-dependent voltage
(4)
(4)
was applied at the top boundary of the RF-needle, where
is the current density. All external boundaries of the blood vessel domain were electrically insulated. All tissue-vessel interfaces were assumed to be electrically conducting. All tissue-needle interfaces except the active surface were electrically insulated.
The damage to the tissue and blood due to the RF heat source was modeled using the Arrhenius model [Citation18,Citation19]. The Arrhenius damage index Ω is related to the survival fraction ω according to
(5)
(5)
The tissue/blood survival fraction evolves in time according to
(6)
(6)
For both tissue and blood, the initial condition (i.e., Ω = 0) was used. The values for the activation energy
ideal gas constant R, and frequency factor A for the tissue and blood Arrhenius models are given in . Tissue and blood were considered to be thermally damaged for survival fraction
e–1 (0.37) [Citation19].
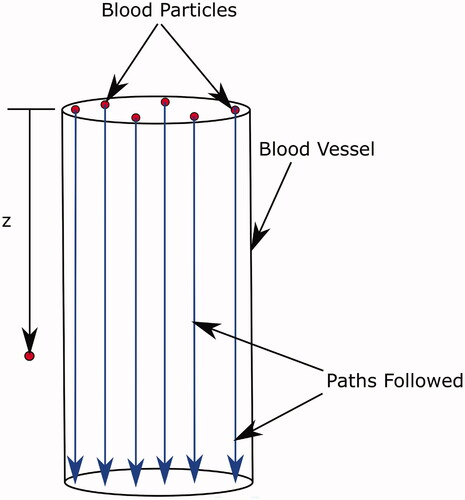
A simplified model was used to describe the effect of thermal coagulation of blood on blood flow. At any time step, the latest temperature field inside the blood vessel was used to calculate the survival fraction of the blood. For this calculation, a number of blood ‘particles’ distributed over the vessel cross-section were considered, as shown in . The local temperature
seen by each blood particle as it traversed the length of the blood vessel was recorded. Here, z is the coordinate along the path of the blood particle, obtained using the relation
(7)
(7)
(where t is the time and
the velocity of the blood particle). This temperature-time data was used to evaluate the Arrhenius damage integral to solve EquationEquation (6)
(6)
(6) for each blood particle. If numerous such particles are used, an approximate representation of the coagulation state of the blood vessel cross-section is obtained. When this calculation showed all the blood particles in the cross-section of the vessel as coagulated, the blood flow was switched off and the simulation was resumed using the electrical conductivity of coagulated blood (given in ). All other properties of coagulated blood were assumed to be the same as those for healthy blood. To the best of our knowledge, this is the first time a weak coupling between blood coagulation and RF ablation has been considered.
Figure 2. Paths followed by blood particles traversing the blood vessel. The definition of the z coordinate used in the calculation is also shown.
The transient simulation was run for a total physical time of 540 s. This is the typical RFA treatment time used in clinical practice. The tissue and blood were kept at an initial temperature of C, i.e., the normal body temperature. The finite volume method based simulation package STAR-CCM + was used to solve the equations.
Model validation
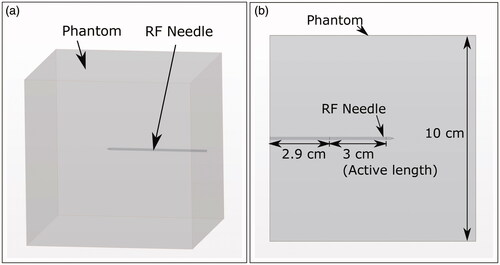
An RF ablation experiment was performed in a cube (side length 10 cm) of thermochromic gel phantom using a RITA® 1500X RF generator and the UniBlate® RF-needle (both by Angiodynamics, New York, NY, USA) with active length set to 3 cm. Temperature set-point, ablation time, and maximum power of the RF generator were 103 C, 10 min, and 35 W, respectively.
For the phantom, 671 g of distilled water was mixed with 175 g of a 40% (Bis-)Acrylamide (National Diagnostics, Atlanta, GA, USA) 19:1 solution. Fifty grams of irreversible change ink concentrate (Kromagen Magenta MB60-NH, TMC Hallcrest, Flintshire, UK) and 7 g of sodium chloride (Sigma Aldrich, St. Louis, MO, USA) were added to the solution and mixed under continuous stirring. The ink is known to discolor proportional to the maximum achieved temperature [Citation20]. The catalyst N,N,N0,N0-tetramethylethylenediamine (1.4 g) was added before 1.4 g of ammonium persulphate (both from Sigma Aldrich, St. Louis, MO, USA) to initiate polymerization. The mixture was poured into a cube-shaped container and allowed to polymerize at room temperature.
The thermochromic phantom was prepared as a cube of side length 10 cm, as seen in , which includes a 3D schematic of the experimental geometry. The RF needle was inserted perpendicularly at the center of the phantom cube face (as seen in ), with insertion depth as shown in . During the ablation, the phantom was placed on a table such that the inserted RF-needle was parallel to the table surface. The RF generator ground-pad was fixed to the surface of the phantom resting on the table.
Figure 3. (a) 3D schematic of the geometry showing the phantom cube and RF-needle orientation. (b) Schematic of the top view of the phantom geometry. Cube dimensions and RF-needle dimensions are shown.
In the simulation, the geometry of the experimental setup was replicated. EquationEquations (1)(1)
(1) and Equation(3)
(3)
(3) were used with the phantom material properties given in . There was no blood subdomain. The top surface of the RF-needle was kept at room temperature. Convection boundary conditions of the form
(8)
(8)
were applied to all other external boundaries. Symbols k, T,
h, and
are the phantom thermal conductivity, temperature, unit surface vector, boundary convection coefficient, and reference temperature respectively. The values of the convection coefficient h used are shown in . For all these surfaces
was set as the room temperature. The room temperature (and initial temperature) was
C. The bottom surface of phantom cube was electrically grounded. The voltage corresponding to the input power obtained from the RF generator logging data was applied to the top surface of the RF-needle.
Table 2. Convection coefficient values for external boundaries. [Citation21].
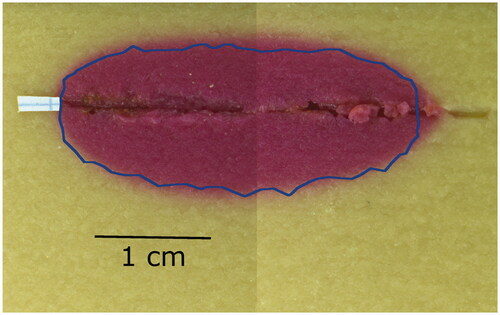
The average power supplied by the RF generator in the experiment was 10.22 W, which is similar to the power used in this parametric study. The thermochromic phantom turns magenta in regions where the temperature exceeds 70 C. The comparison of the experimental and simulation results is shown in . The magenta coloration of the thermochromic phantom marks the region where temperature exceeded 70
C during the ablation. The blue line marks the boundary of this zone as predicted by the simulation. The experimental
C zone area was 3.71 cm2, while the simulated one was 3.17 cm2. These results gave confidence on the method and on the simplification of the needle geometry.
Figure 4. Axial cross-section of post-ablation thermochromic gel phantom. During the experiment, the temperature in the phantom exceeded 70 C in the magenta zone. The blue outline marks the same zone predicted by the model.
Simulations performed
Blood vessel configurations – SET A
A full central composite Design of Experiments (DoE) has been considered for the generation of SET A of the blood vessel configurations. Five different values for each parameter were considered which are given in . Ten (2 × 5) simulations were performed with one parameter taking either a ‘Max’ or ‘Min’ value and the other parameters taking ‘Center’ values. Thirty-two (25) simulations were performed with each parameter taking either a ‘High’ or a ‘Low’ value. One simulation was performed with all parameters taking center values. This led to a total of 43 simulation runs. One reference simulation, which had no blood vessel region, was performed for every value of the RF-needle active length λ.
Table 3. Parameter values used for simulations of SET A.
Blood vessel configurations – SET B
In these simulations, the blood vessel was parallel to the RF-needle. The distance d1 between the RF-needle and blood vessel was kept 0. The perpendicular distance between the RF-needle and the vessel, d2, was 1 mm. The RF-needle active length was λ = 20 mm. Seventeen different values were used for the vessel radius ().
Table 4. Vessel radii used for simulations of SET B.
Metrics and method used to quantify blood vessel effects
Possible effects of the blood vessel on the thermal lesion are:
reduction in size of the lesion due to cooling (as shown in )
Figure 5. Schematic of the cooling effect (black outline) and the directional effect (green line) of a blood vessel on a thermal lesion. The cooling effect reduces the lesion size, while the directional effect causes stretching in the flow direction. Definition of
and
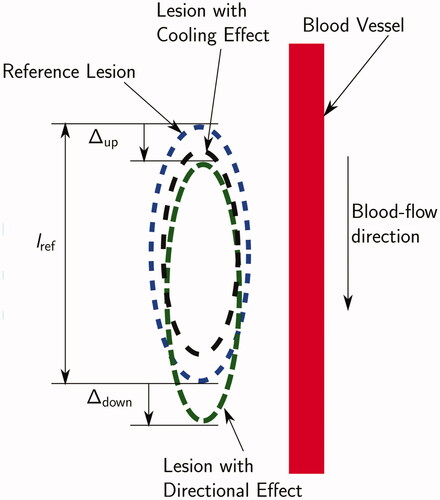
stretching of the lesion in the direction of the blood flow (as shown in , referred to as ‘the directional effect’ in this paper)
combined effect resulting in both size reduction and lesion stretching.
To capture these effects and to quantify the impact of parameter variation on the thermal lesion, three metrics have been defined:
Average Lesion Boundary Displacement ΔA (%):
Maximum Nusselt number
Relative ablated volume
Minitab® Statistical SoftwareFootnote1 was used to fit second-order response surfaces to the three metrics (obtained from the simulations of SET A) as functions of d1, d2, r, α, and λ. Backward elimination was used to remove the insignificant terms in the response surface expressions. The terms with a p value lower than 0.1 (i.e., a confidence level of 90%) were removed during the backward elimination procedure.
Results
Quantitative data about the thermal lesions (i.e., lesion volume and maximum diameter) obtained in each simulation are given in the online supplemental material.
Results for SET A
The most important contribution to the directional effect metric ΔA is of parameter d1, as visible in the main effect plots obtained from the fitted response surface in . A non linear relationship with the radius r was found. For the simulations of set A, no directional effect was observed on the thermal lesion (thermal lesion plots not shown), and the ΔA values were within the range [−3%, 3%].
Figure 6. Results obtained from simulations of SET A.
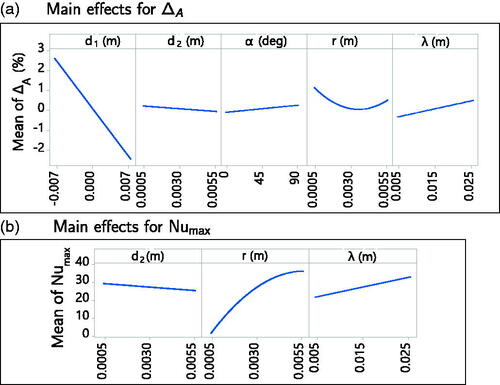
shows the main effects plot for the maximum Nusselt number (Nu) on the vein surface obtained from the fitted response surface. The important parameters affecting this metric were d2, r, and λ. The most important effect was of variation in r. The following closed form expression, which approximates the relationship between Nu
and the parameters d2 (m), r (m), and λ (m) was obtained (R-sq = 96.75%):
(12)
(12)
(valid in the parameter ranges analysed).
The relative ablated volume decreased with decreasing distance between the RF-needle and the blood vessel. The cooling effect was the largest when the blood vessel was parallel to the RF-needle and decreased with increasing angle till the vessel became perpendicular to the RF-needle. The relative ablated volume increased with increasing RF-needle active length.
Results for SET B
With decreasing blood vessel radius, two opposing effects become stronger:
Lesion stretching due to the directional effect
Blood coagulation
The objective of the simulations of SET B was to investigate which of these two effects dominates at which vessel radius and its implications for the ablated zone.
shows the estimated blood coagulation plots for all the simulations of SET B at the end of the ablation () and the blood vessel cross-section at which thermal damage to blood is computed (; red line). The complete vessel cross-section coagulated for 0.25 mm 0.40 mm (), while the blood remained unaffected for 0.7 mm
5 mm (). For 0.45 mm
0.65 mm () the blood cross-section suffered partial thermal damage which was not sufficient to cause flow blockage. For 0.25 mm
0.40 mm the time at which the blood cross-section completely coagulated is given in .
Figure 7. (a) Location of the vessel cross-section at which thermal damage is calculated. (b–h) Arrhenius survival fraction ω for the vessel cross-sections for SET B computed at the blood outlet. A value of corresponds to blood coagulation. The RF-needle was located below the cross-section.
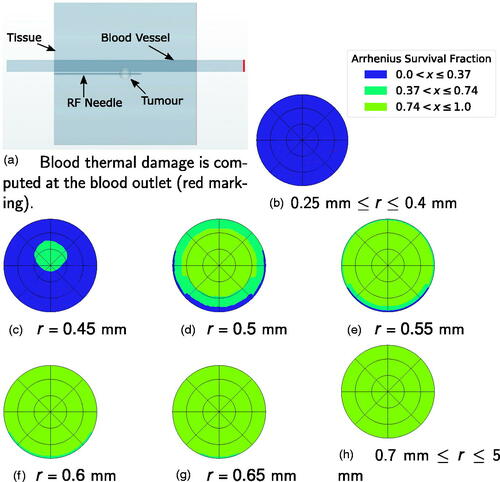
Table 5. Time required for complete coagulation of the blood vessel cross-section.
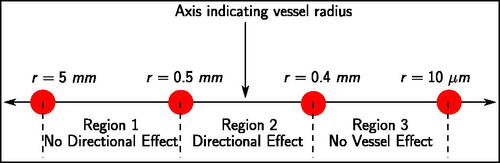
and show the thermal lesions obtained at the end of the simulation. For r = 0.25 mm, r = 0.3 mm, and r = 0.35 mm, the thermal lesion was ellipsoidal as a result of early flow-blockage due to blood coagulation. For r = 0.4 mm, the blood coagulation occurred late resulting in a tail-like structure, which was not fully enveloped by thermal lesion growth after flow blockage. For r = 0.45 mm, the thermal lesion had a long tail-like structure. For r = 0.5 mm a small tail was visible in the tissue thermal lesion, whereas for r > 0.5 mm no tail like structure was present. Based on these findings, a classification depending on the likelihood of the directional effect can be derived as shown in . For vessels of ‘region 1′ there is no directional effect of blood flow on the thermal lesion, so an advection term is not required in the blood subdomain. A perfusion term with a higher perfusion coefficient (e.g., the model from Kröger et al. [Citation6]) would suffice. For vessels of ‘region 2′ directional effects do occur, and an advection-diffusion equation would be necessary to model heat transfer. The blood vessels of ‘region 3′ have neither a directional effect nor a cooling effect, and can be modeled similar to solid tissue, but with different material properties.
Figure 8. Thermal lesion at the end of the simulation for 0.25 mm 0.7 mm. The tissue section containing the vessel axis and the RF-needle axis is shown. The top horizontal band in each image is the blood vessel section. Blood flow was from right to left. The bottom horizontal ‘half-band’ is the RF-needle. Blue indicates healthy tissue and red indicates ablated tissue. The white circle is the tumor boundary.
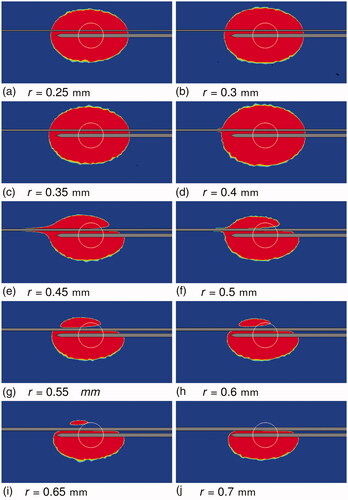
Figure 9. Tissue thermal damage at the end of the simulations for 0.75 mm 5 mm. Sub-figure (h) shows the reference lesion. The tissue section containing the vessel axis and the RF-needle axis is shown. The top horizontal band in each image is the blood vessel section. Blood flow was from right to left. The bottom horizontal ‘half-band’ is the RF-needle. Blue indicates healthy tissue and red indicates ablated tissue. The white circle is the tumor boundary.
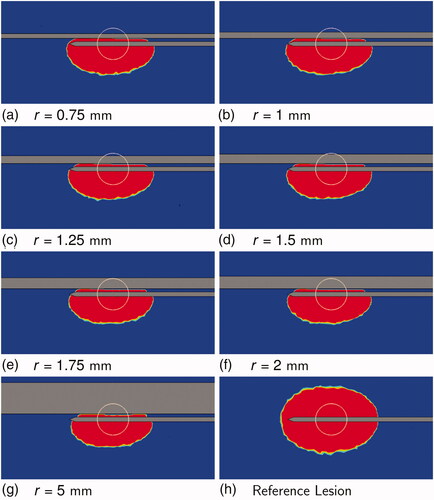
Figure 10. Classification of blood vessels into regions based on the occurrence of a directional effect.
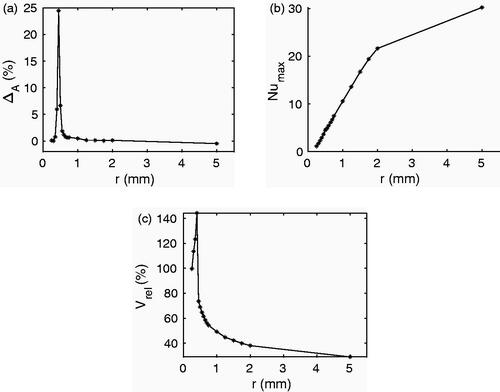
shows the effect of radius variation on the three scalar metrics in SET B. The directional effect metric ΔA first increased up to r = 0.45 mm and then decreased as r increased (). For the cases where a tail-like structure was visible in the thermal lesion the value of ΔA was larger than 5%. The maximum Nusselt number increased with increasing radius (). For the radii 0.3 mm, 0.35 mm, and 0.4 mm the lesion volume was larger than the reference lesion (). This could be a combined effect of the high electrical conductivity of healthy blood, the low blood flow-rate, and the blockage of blood flow during the simulation. From vessel radius 0.45 mm onward decreased with r.
Figure 11. Effect of vessel radius on (a) directional effect ΔA, (b) Nusselt number and (c) relative ablated volume
metrics for simulations of SET B.
Discussion
Our work extends the results of dos Santos et al. [Citation8] through an expression for the heat transfer coefficient as a function of d2, r, and λ. In SET A for the variation of cooling effect with parameters r and α, our findings agree with those of Chen and Saidel [Citation3] and Huang [Citation7]. For SET B, where blood coagulation came into play, our results showed that the vessel cooling effect first decreased with increasing r and then increased. We observed that, in cases where blood coagulation occurred during the ablation, the ablated volume was larger than the reference. Our study found that, as in the one by Chen and Saidel, the vessel cooling effect decreases continuously as d2 increases. The study by Huang found that the cooling effect of a blood vessel first increases as d2 is increased and reaches a maximum value, after which it decreases again. To the best of our knowledge the present study is the first one to investigate how varying the parameter d1 influences the blood-vessel effects.
Huang found that, ignoring blood coagulation the directional effect occurs for small blood vessels (irrespective of flow rate) or large vessels with low flow rate. We observed that directional effects occurred for vessel radii between 0.4 mm and 0.5 mm for flow rates dictated by Murray’s law. To the best of our knowledge, the present study is the first one that has taken into account blood coagulation in a systematic investigation of the directional effect of blood vessels in RFA.
The present work uses temperature dependent expressions for the thermal and electrical conductivities of tissue and blood. This is in contrast with related works in literature, see e.g., [Citation3,Citation7], which use constant values. The strong dependence of Nu on the vessel radius suggests that a constant Nusselt number would either over- or under-estimate the cooling effect depending on the vessel radius. Hence, the closed-form expression for Nu
could potentially improve the accuracy of the simulation results. The findings concerning directional effects highlight the need for using an appropriate, advection-based, mathematical model for 0.4 mm
mm. Furthermore, the findings suggest that the bio-heat model used by Kröger et al. [Citation6] is valid for 0.5 mm
5 mm.
The results we obtained depend on the RF-needle shape and are specific to the Angiodynamics UniBlate® RF-needle. The effect of a single blood vessel on the thermal lesion is considered. The number of blood vessels surrounding the RF-needle is known to have an impact on the thermal lesion during RFA. Another limitation of the model used is the weak coupling of the blood coagulation, blood flow, and energy models. The classification of blood vessels does not include the effect of parameters other than the vessel radius. Future work can focus on: (i) addressing limitations discussed above and (ii) experimental validation of the conclusions obtained.
Conclusions
A mathematical model has been used to determine the impact of blood vessel parameters and RF-needle active length on: (i) the ablated volume, (ii) the directional effect, and (iii) the heat transfer coefficient at the vessel wall.
Firstly, the vessel radius r, distance d2, and the RF-needle active length λ are the most important parameters affecting the maximum Nusselt number on the blood vessel surface. An expression for the maximum Nusselt number as a function of these parameters has been obtained, which can be used to determine the heat transfer coefficient in approximate models.
Secondly, directional effects of blood are important for 0.4 mm mm. As a first approximation, mathematical models should allow for directional effects for blood vessels of radii between 0.4 mm and 0.5 mm.
Thirdly, a vessel classification scheme based on the occurrence of a directional effect has been proposed, which can be used to develop a mathematical model tailored for fast estimation of vessel cooling effects.
Supplemental Material
Download PDF (81.7 KB)Disclosure statement
No potential conflict of interest was reported by the author(s).
Additional information
Funding
Notes
1 MINITAB® and all other trademarks and logos for the Company’s products and services are the exclusive property of Minitab Inc. All other marks referenced remain the property of their respective owners. See minitab.com for more information.
References
- Payne S, Flanagan R, Pollari M, et al. Image-based multi-scale modelling and validation of radio-frequency ablation in liver tumours. Philos Trans A Math Phys Eng Sci. 2011;369:4233–4254.
- Curley SA. Radiofrequency ablation of malignant liver tumors. Oncologist. 2001;6:14–23.
- Chen X, Saidel GM. Mathematical modeling of thermal ablation in tissue surrounding a large vessel. J Biomech Eng. 2009;131:011001.
- Shao YL, Arjun B, Leo HL, et al. A computational theoretical model for radiofrequency ablation of tumor with complex vascularization. Comput Biol Med. 2017;89:282–292.
- Audigier C, Mansi T, Delingette H, et al. Lattice Boltzmann method for fast patient-specific simulation of liver tumor ablation from ct images. In: Mori K, Sakuma I, Sato Y, Barillot C, Navab N, editors. Medical Image Computing and Computer-Assisted Intervention (MICCAI). Berlin (Germany): Springer; 2013. p. 323–330.
- Kröger T, Altrogge I, Preusser T, et al. Numerical simulation of radio frequency ablation with state dependent material parameters in three space dimensions. In: Larsen R, Nielsen M, Sporring J, editors. Medical Image Computing and Computer-Assisted Intervention (MICCAI). Berlin (Germany): Springer; 2006. p. 380–388.
- Huang HW. Influence of blood vessel on the thermal lesion formation during radiofrequency ablation for liver tumors. Med Phys. 2013;40:073303.
- dos Santos I, Haemmerich D, Pinheiro C d S, et al. Effect of variable heat transfer coefficient on tissue temperature next to a large vessel during radiofrequency tumor ablation. Biomed Eng Online. 2008;7:21.
- Tungjitkusolmun S, Staelin ST, Haemmerich D, et al. Three-dimensional finite-element analyses for radio-frequency hepatic tumor ablation. IEEE Trans Biomed Eng. 2002;49:3–9.
- Haemmerich D, Tungjitkusolmun S, Staelin ST, et al. Finite-element analysis of hepatic multiple probe radio-frequency ablation. IEEE Trans Biomed Eng. 2002;49:836–842.
- Haemmerich D, Wright AW, Mahvi DM, et al. Hepatic bipolar radiofrequency ablation creates coagulation zones close to blood vessels: a finite element study. Med Biol Eng Comput. 2003;41:317–323.
- Pennes HH. Analysis of tissue and arterial blood temperatures in the resting human forearm. J Appl Physiol. 1948;1:93–122.
- Shrivastava D, Vaughan JT. A generic bioheat transfer thermal model for a perfused tissue. J Biomech Eng. 2009;131:074506.
- Nakayama A, Kuwahara F. A general bioheat transfer model based on the theory of porous media. Int J Heat Mass Transf. 2008;51:3190–3199.
- Sutera SP, Skalak R. The history of poiseuille’s law. Annu Rev Fluid Mech. 1993;25:1–20.
- Williams HR, Trask RS, Weaver PM, et al. Minimum mass vascular networks in multifunctional materials. J R Soc Interface. 2008;5:55–65.
- van Wijk Y. Treatment planning for microwave ablation of hepatic tumors in the proximity of hepatic veins [master’s thesis]. Eindhoven University of Technology; 2015.
- Barton JK, Popok DP, Black JF. Thermal analysis of blood undergoing laser photocoagulation. IEEE J Select Topics Quantum Electron. 2001;7:936–943.
- Chen CCR, Miga MI, Galloway RL Jr. Optimizing electrode placement using finite-element models in radiofrequency ablation treatment planning. IEEE Trans Biomed Eng. 2009;56:237–245.
- Mikhail AS, Negussie AH, Graham C, et al. Evaluation of a tissue-mimicking thermochromic phantom for radiofrequency ablation . Med Phys. 2016;43:4304–4311.
- Çengel YA. Heat and mass transfer: a practical approach. McGraw-Hill series in mechanical and aerospace engineering. 2 ed. New York (NY): McGraw-Hill; 2006.
- Hasgall PA, Neufeld E, Gosselin Mc, Klingenböck A, et al. IT–IS Database for Thermal and Electromagnetic Parameters of Biological Tissues. Version 2.6. September 2015.
- Valvano JW, Cochran JR, Diller KR. Thermal conductivity and diffusivity of biomaterials measured with self-heated thermistors. Int J Thermophys. 1985;6:301–311.
- Zurbuchen U, Holmer C, Lehmann KS, et al. Determination of the temperature-dependent electric conductivity of liver tissue ex vivo and in vivo: importance for therapy planning for the radiofrequency ablation of liver tumours. Int J Hyperth. 2010;26:26–33.
- Holmes KR. Thermal properties. [accessed 2017 Jun 13]. http://users.ece.utexas.edu/∼valvano/research/Thermal.pdf
- Zurbuchen U, Poch F, Gemeinhardt O, et al. Determination of the electrical conductivity of human liver metastases: impact on therapy planning in the radiofrequency ablation of liver tumors. Acta Radiol. 2017;58:164–169.
- Duck FA. Physical properties of tissues: a comprehensive reference book. London (UK): Academic press; 2013.
- Mohapatra SN, Hill DW. The changes in blood resistivity with haematocrit and temperature. Eur J Intensive Care Med. 1975;1:153–162.
- Hightower NC. Resistivity and permittivity characteristics of human blood plasma during coagulation [master’s thesis]. Georgia Institute of Technology; 1970.
- Negussie AH, Partanen A, Mikhail AS, et al. Thermochromic tissue-mimicking phantom for optimisation of thermal tumour ablation. Int J Hyperthermia. 2016;32:239–243.