
Abstract
Objectives
Hepatocellular carcinoma (HCC) is a heterogeneous disease. This study aimed to identify the heterogeneity related to the prognosis of ablation in patients with single-nodule hepatitis B virus (HBV)-associated HCC ≤3 cm.
Methods
A total of 359 patients with single-nodule HBV-associated HCC ≤3 cm treated with curative thermal ablation were retrospectively investigated. Hierarchical cluster analysis was applied to obtain more homogeneous patient clusters concerning demographic and physiological characteristics. Discriminant analysis was performed to identify the relatively important variables for cluster analysis. Multiple correspondence analysis (MCA) was used to clarify the relationship between clusters and categorical variables. Overall survival (OS) was compared among clusters using the Kaplan–Meier model.
Results
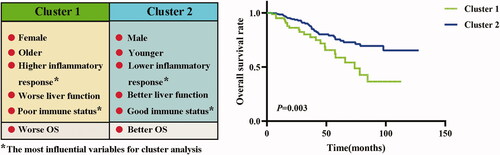
A two-cluster model was identified. Cluster 1 (n = 85) showed a higher percentage of female and older patients, higher inflammation response (higher prognostic nutritional index [PNI] and Glasgow prognostic score [GPS]), worse liver function (higher albumin–bilirubin grade and Child–Pugh grade), and relatively poorer immune status (higher neutrophil-to-lymphocyte ratio [NLR]) than cluster 2 (n = 274). NLR and GPS were the two most influential variables for cluster analysis (p < .0001). Cluster 2 had a significantly better prognosis than cluster 1. MCA revealed a clear negative correlation between inflammation status and liver function. Compared with cluster 1, the hazard ratios for OS of cluster 2 were 0.47 and 0.52 before and after adjusting for age, respectively (p < .05).
Conclusions
This study identified two sub-phenotypes of patients with single-nodule HBV-associated HCC ≤3 cm and their association with the outcome of thermal ablation alone as the first-line therapy.
Thermal ablation alone as the first-line therapy is not suitable for all patients with single-nodule hepatitis B virus (HBV)-associated hepatocellular carcinoma (HCC) ≤3 cm.
Patients with single-nodule HBV-associated HCC ≤3 cm can be identified as two sub-phenotypes associated with the outcome of thermal ablation alone as the first-line therapy, based on key preoperative clinical characteristics, especially inflammatory response and immune status.
Patients with single-nodule HBV-associated HCC ≤3 cm characterized by late-onset disease, worse liver function, poorer immune status, and higher inflammatory response (with higher inflammatory response being the most important factor) are not suitable for thermal ablation alone as the first-line therapy. In contrast, patients with single-nodule HBV-associated HCC ≤3 cm characterized by early-onset disease, better liver function, lower inflammatory response, and good immune status (with lower inflammatory response being the most important factor) are particularly suitable for thermal ablation alone.
Key points
In the treatment of patients with single-nodule HBV-associated HCC ≤3 cm, thermal ablation alone as the first-line therapy should be carefully considered after recognizing the key clinical characteristics, among which inflammatory response and immune status are the two most important factors involved in clinical heterogeneity, and inflammatory response is closely related to the prognosis of thermal ablation alone as the first-line therapy for these patients.
Implications for patient care
Introduction
Hepatocellular carcinoma (HCC) is the most common pathological type of liver cancer, and is the third leading cause of cancer-related deaths worldwide [Citation1]. It has been reported that approximately 80% of HCC cases are associated with hepatitis B virus (HBV) infection [Citation2]. Currently, liver transplantation, surgical resection, or thermal ablation can be selected as the first-line treatment for small HCCs (Barcelona Clinic Liver Cancer stage 0 or A) [Citation3,Citation4]. However, owing to the scarcity of liver transplant donors, immune rejection, and prolonged use of immunosuppressants, the preferred treatment for these patients are resection and thermal ablation [Citation5]. In addition, the prognosis of patients with early HCC undergoing thermal ablation is similar to that of patients undergoing surgical resection, especially for those with lesions ≤3 cm [Citation6]. Unfortunately, no study has identified the heterogeneity related to the prognosis of ablation in patients with single-nodule HBV-associated HCC ≤3 cm. The identification of specific patient phenotypes may help in the early selection of patients who are suitable for thermal ablation alone as the first-line therapy, and might subsequently facilitate the development of potentially more effective therapies for patients who are not suitable for thermal ablation alone. Therefore, the main purpose of this study was to identify the different phenotypes of patients with single-nodule HBV-associated HCC ≤3 cm by using factor analysis, cluster analysis, discriminant analysis, and multiple correspondence analysis (MCA). The secondary purpose was to assess the relationship between the different phenotypes and the overall survival (OS) of patients who underwent thermal ablation alone as the first-line therapy.
Materials and methods
Patients and follow-up
A total of 359 patients with HCC at the Sun Yat‑sen University Cancer Center (SYSUCC) between September 2006 and December 2018 were retrospectively analyzed. These patients met the following criteria: (1) HCC confirmed with imaging or histopathological examination, (2) microwave ablation (MWA) or radiofrequency ablation (RFA) as the first-line therapy, (3) HCC treated with curative treatment (no obvious local HCC recurrence during the first follow-up), (4) HBV infection, (5) single nodule ≤3 cm, (6) adequate liver function (albumin–bilirubin [ALBI] grade 1–2 or Child–Pugh [CP] grade A–B), (7) no other treatments for HCC before recurrence, and (8) complete preoperative baseline data. In general, the patients were re‑examined with abdominal enhanced computed tomography (CT), ultrasound, or magnetic resonance imaging approximately 1 month after RFA or MWA treatment. If no obvious signs of recurrence were observed, the patients were followed up once every 3–6 months for the first 2 years, once every 6–12 months from 2 to 5 years, and once every 12 months or longer after 5 years. The median follow-up time was 30.4 months. During the follow-up period, 63 patients died. When calculating the OS, patients who were lost to follow-up were counted as censored. OS was defined as the interval from the start of the initial RFA or MWA treatment to death.
The study was approved by the SYSUCC Hospital Ethics Committee and conducted in accordance with the Declaration of Helsinki. The need for informed consent was waived because of the retrospective nature of this study.
Baseline data collection
The baseline data of the patients were collected before ablation, including sex, age, HBV infection, cirrhosis, platelet counts, liver function (ALBI grade and CP grade), inflammation status (C-reactive protein [CRP], Glasgow prognostic score [GPS], and prognostic nutritional index [PNI]), body’s immune status (neutrophil-to-lymphocyte ratio [NLR]), and tumor-related indicators (tumor size and number, alpha-fetoprotein [AFP]). The ALBI score was calculated using the following formula: −0.085 × (albumin g/L) + 0.66 × lg (total bilirubin μmol/L) [Citation7]. The GPS, PNI, NLR, and ALBI grade were constructed as described in [Citation8–11].
Table 1. Related indicators of liver function, immune status and inflammation state.
Treatment protocols
MWA and RFA could achieve similar efficacy in patients with early-stage HCC [Citation12,Citation13]. Therefore, clinicians can choose MWA or RFA according to the size or location of the tumor, and the personal willingness and economic status of the patient. The MWA and RFA procedures were performed under CT or ultrasound guidance by interventional radiologists with at least 5 years’ experience in ablation therapy. The power and corresponding time were chosen according to tumor location and size, with the aim of completely eliminating the tumor. A single-needle ablation was usually performed for tumors ≤3.0 cm. The end point of treatment was when the ablation zone had completely covered the tumor and the periablational margin had extended at least 5–10 mm beyond the tumor boundary [Citation14].
Statistical methods
Factor analysis: variables selected into cluster analysis
Factor analysis is a statistical technique that can be used to identify highly relevant variables by which the number of clinical variables for cluster analysis can be reduced, because the variables used for cluster analysis theoretically cannot have a strong correlation. Therefore, a total of seven independent factors () were identified by orthogonal varimax rotation of the 12 initially selected variables [Citation15]. Factor 1 variables showed a certain degree of correlation between pretreatment liver function (CP grade and ALBI grade) and inflammation-based scores (GPS and PNI). However, the main purpose of this study was to perform cluster analysis based on different characteristics (including sex, age, liver function, inflammation status, body’s immune status, and tumor-related indicators). The time-dependent receiver operating characteristic (ROC) curves and the estimated areas under the curve (AUCs) showed that the ALBI grade had a better ability to predict prognosis than the CP grade with respect to OS, whereas GPS and PNI had similar abilities (). PNI is composed of serum albumin and total lymphocyte count, whereas GPS is composed of serum CRP and albumin. Therefore, GPS is more representative of the inflammation status of patients. On the basis of the above analysis, we included six variables from factors 2–7 and two variables (i.e. GPS and ALBI grade) from factor 1 into cluster analysis ().
Figure 1. Time-dependent receiver operating characteristic (ROC) curves for OS at 3 years (A), 5 years (B) and 8 years (C) based on GPS, PNI, CP grade, and ALBI grade. ALBI: albumin–bilirubin; GPS: Glasgow prognostic score; PNI: prognostic nutritional index; CP: Child–Pugh. The time-dependent ROC curves and the corresponding estimated areas under the curve were used to compare the abilities of the variables to predict prognosis with respect to overall survival rates at different time points.
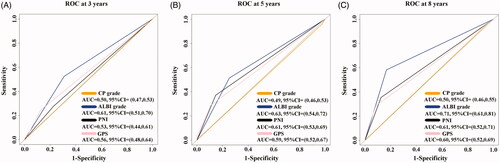
Table 2. Factor analysis: rotated component matrix of 12 variables.
Cluster analysis and discriminant analysis
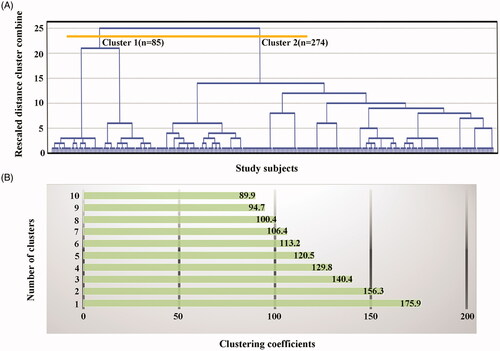
A hierarchical cluster was used in this study based on the agglomerative approach (bottom–up) and Ward’s linkage methods [Citation16]. Patients were merged into different clusters to minimize the intra-cluster sum of squares or to maximize the inter-cluster sum of squares by hierarchical clustering (). Therefore, patients within each cluster have similar characteristics, whereas patients in different clusters have different characteristics. The optimal number of clusters generated by the hierarchical cluster was determined using the elbow criterion () and clinical values [Citation17].
Figure 2. Dendrogram of patients generated using cluster analysis. The total of 359 patients with single-nodule hepatitis B virus–associated hepatocellular carcinoma ≤3 cm were merged into a single final cluster (A), and two clusters were successively identified according to the elbow criterion (B) and clinical values. In hierarchical cluster analysis, each observation is treated as a cluster and the distances between the clusters are measured. Subsequently, the clusters with the closest distances are merged into new clusters. The distances between these new clusters continue to be measured, and the closest clusters are merged. Therefore, these clusters are merged into a single final cluster. Ward’s linkage was used for the distance measures between clusters, which can merge similar clusters together. Therefore, patients within each cluster have similar characteristics, whereas patients in different clusters have different characteristics. The elbow criterion is an objective method used to determine the optimal number of clusters. Panel (B) shows the trend of the clustering coefficients with the number of clusters. The value of each light green band indicates the clustering coefficient corresponding to the number of clusters. Theoretically, the corresponding number of clusters is the optimal value when the clustering coefficients most obviously decrease with the increase in the number of clusters. Therefore, in theory, two or three optimal clusters can be considered. However, in the three-cluster model, the overall survival rates of patients after thermal ablation in cluster 1 were not significantly different from those in clusters 2 and 3 (p>.05). Therefore, the optimal two-cluster model was identified in our study. Among the patients, 274 (76.3%) were distributed into cluster 2 and the remaining 85 (23.7%) were assigned to cluster 1.
Discriminant analysis was performed to identify the relatively important variables for cluster analysis and to further verify the clusters generated by the hierarchical cluster. The standardized canonical discriminant function coefficients were used to explain the discriminating ability of the variables. Wilks’ lambda was used to assess the accuracy of the discriminant model [Citation18]. Moreover, a cross-validation was performed to further verify the accuracy of the discriminant model.
Multiple correspondence analysis
MCA is a principal component analysis technique that is suitable for dealing with multiple categorical variables. The technique can capture the relative associations among categorical variables, which can be achieved by generating coordinate points, representing different category points of categorical variables, in a high-dimensional ‘Euclidean’ space [Citation19]. In other words, MCA can present the complex categorical relationship of multiple categorical variables in a high-dimensional graph with visualization (). In the coordinate plane, the category points (coordinate points) of each variable are connected to the origin (0, 0). If the angle between two connecting lines is <90°, there is a correlation between the categories of the two categorical variables. The closer the distance of the coordinate points is, the more obvious the tendency of the categorical point association of the corresponding categorical variable. Moreover, the farther the coordinate points from the origin are, the more obvious the tendency of the association becomes. MCA can also generate a plot of discrimination measures that can clearly express the close relationship between categorical variables in terms of the length of the line segment and the angle between the line segments ().
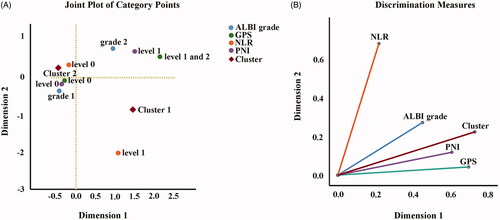
Figure 3. Two-dimensional joint plot of category points (A) and discrimination measure plot (B) were generated using multiple correspondence analysis (MCA). ALBI: albumin–bilirubin; GPS: Glasgow prognostic score; NLR: neutrophil-to-lymphocyte ratio; PNI: prognostic nutritional index. MCA, a principal component analysis technique, can capture the relative associations among categorical variables by generating coordinate points in a high-dimensional space. MCA provides multiple dimensional solutions as outputs. Therefore, an ideal dimensional solution should be determined to simply and effectively describe the relationship between the categorical variables. The most optimal dimensional solution is identified based on the following principle: the largest total variance explained by the lowest dimensional solution. In our study, the outputs of MCA showed that dimensions 1, 2, 3, and 4 accounted for 53.6%, 27.3%, 10.4%, and 7.7% of the total variance, and the corresponding eigenvalues were 2.678, 1.365, 0.518, and 0.387, respectively. Therefore, a two-dimensional solution is adopted because dimensions 1 and 2 together explain 80.9% of the total variation.
Statistical analysis
Medians and quartiles were used to describe continuous variables that did not meet the normal distribution. The t-test and Mann–Whitney U-test were used for continuous variables. The chi-square test and Fisher’s exact test were used for categorical variables. The median OS between the different groups was compared using Kaplan–Meier curves and log‑rank tests. Cox regression was performed to compare OS between clusters before and after adjusting for age, and was used for multivariable analysis. The time-dependent ROC curves and the corresponding estimated AUCs were used to compare the ability of the variables to predict the prognosis with respect to OS [Citation20]. Analyses were two-sided, and p < .05 indicated statistical significance. Statistical analyses were performed using R version 3.6.1 (https://www.r-project.org/), SPSS version 25.0 (IBM, USA), and GraphPad Prism 8.0.1(244) (GraphPad Software, USA).
Results
Study population
A total of 359 patients (298 men, 61 women) with single-nodule HBV-associated HCC ≤3 cm were included in this study. Among these patients, the median age was 57 years (interquartile range [IQR] 49–66 years) and the median tumor size was 2.1 cm (IQR 1.7–2.5 cm). The first-line treatment was RFA in 282 (78.6%) patients and MWA in 77 (21.4%) patients. shows that patients who underwent MWA and those who underwent RFA had similar OS (p = .975). With respect to liver function, 247 (68.8%) patients had ALBI grade 1, 347 (96.7%) patients had CP grade A, and no patients had CP grade C or ALBI grade 3. Concerning the inflammation status, 316 (88.0%) patients had a GPS of 0 and 289 (80.5%) patients had a PNI of 0. In terms of immune status, 307 (85.5%) patients had an NLR of 0. The other clinical characteristics are shown in .
Figure 4. Comparison of overall survival rates between radiofrequency ablation (RFA) and microwave ablation (MWA).
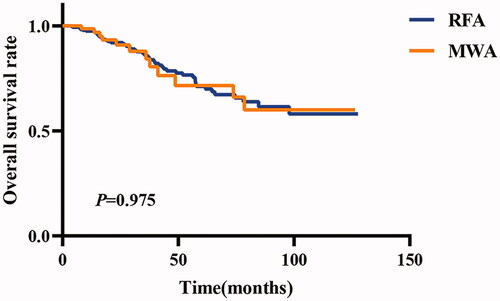
Table 3. Demographic and clinical characteristics of the enrolled patients.
Cluster analysis
In patients with single-nodule HBV-associated HCC ≤3 cm, a dendrogram was generated using hierarchical cluster analysis (). Two clusters were identified according to the elbow criterion () and clinical values. Of the patients, 274 (76.3%) were distributed into cluster 2 and the remaining 85 (23.7%) were assigned to cluster 1. The discriminant analysis showed similar clustering results to the hierarchical cluster analysis, which was characterized by a Wilks’ lambda of 0.142 (p < .0001), thus indicating ideal accuracy for the prediction of cluster membership. Cross-validation also proved that the results of discriminant analysis were rather credible. In addition, the stepwise discriminant analysis also showed that NLR (F = 1120, Wilks’ lambda = 0.588, p < .0001) and GPS (F = 784, Wilks’ lambda = 0.454, p < .0001) were the two most influential variables for cluster analysis.
Clinical characteristics of the two clusters
The demographic and baseline data of the identified clusters are shown in . Cluster 1 was characterized by a higher percentage of female and older patients, higher inflammation status (higher PNI and GPS), worse liver function (higher ALBI grade and CP grade B), and relatively poor immune status (higher NLR) than cluster 2.
Table 4. Baseline characteristics of clusters in the two-cluster model.
Multiple correspondence analysis
To further clarify the relationship between clusters and the patients’ inflammation status, liver function, and immune status, we conducted an MCA. Considering that MCA is susceptible to outliers and the number of patients with a GPS of 2 was small, we combined GPS =1 and GPS =2 into a single variable. Further, the outputs of the MCA showed that dimensions 1, 2, 3, and 4 accounted for 53.6%, 27.3%, 10.4%, and 7.7% of the total variance, and the corresponding eigenvalues were 2.678, 1.365, 0.518, and 0.387, respectively. Therefore, a two-dimensional solution was adopted because dimension 1 and dimension 2 together explained 80.9% of the total variation. A joint plot of category points visualized the relationship between variables, which revealed that cluster 2 was characterized by lower inflammation status, better liver function, and better immune status, whereas cluster 1 was characterized by higher inflammation status, worse liver function, and relatively poor immune status (). In particular, the MCA plot showed a clear negative correlation between inflammation status (GPS and PNI) and liver function (ALBI grade) (). In addition, Pearson’s chi-square test and correlation analysis showed a significantly positive correlation between the ALBI grade and GPS (Spearman rs = 0.51, p < .001) and PNI (Pearson r = 0.59, p < .001), which further suggested that a higher inflammation status had a significant relationship to worse liver function. Moreover, our study showed that compared with a lower NLR (NLR = 0), a higher NLR (NLR = 1) was significantly related to higher neutrophil and lower lymphocyte counts (Mann–Whitney U-test, both p < .001), but was not significantly associated with cirrhosis (p = .440), higher serum AFP level (p = .194), and worse liver function (ALBI grade 2 [p = .692] and CP grade B [p = .843]).
OS in the two-cluster model
The Kaplan–Meier curve for the two-cluster model of OS is shown in . The 1-, 3-, 5-, and 8-year OS rates of cluster 1 were 95.1%, 80.1%, 58.6%, and 36.5%, respectively, and the 1-, 3-, 5-, and 8-year OS rates of cluster 2 were 98.5%, 88.5%, 75.5%, and 69.4%, respectively (p = .003). Cox proportional hazards modeling showed a significantly longer median OS (p = .004) in cluster 2, with a hazard ratio (HR) for mortality of 0.47 (95% confidence interval [CI] 0.28–0.78), than in cluster 1 (reference). After adjusting for the ablation modality (MWA vs. RFA), Cox proportional hazards modeling showed the same results. After adjusting for age, Cox proportional hazards modeling still showed a significantly better OS (p = .014) in cluster 2, with an HR for mortality of 0.52 (95% CI 0.31–0.88).
Figure 5. Comparison of the characteristics of different clusters and their association with the overall survival rates of thermal ablation alone as the first-line therapy. In the case that the clusters of all observations are determined, discriminant analysis, a multivariate statistical analysis, can identify the clusters to which the observations belong according to its discriminant criteria. Therefore, discriminant analysis can further verify the clusters generated by the hierarchical cluster. In addition, the most influential variables for cluster analysis can be identified with stepwise discriminant analysis. In our study, the stepwise discriminant analysis showed that the neutrophil-to-lymphocyte ratio (a substitute for immune status) and Glasgow prognostic score (a substitute for inflammation status) are the two most influential variables for cluster analysis.
OS in different immune status (NLR) and inflammation status (GPS)
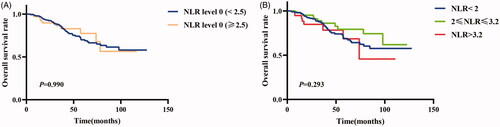
The Kaplan–Meier curves of OS for different immune status and inflammation status are depicted in . With respect to the immune status (NLR), the 1-, 3-, and 5-year OS rates of a better immune status (NLR = 0) were 98.0%, 86.9%, and 71.1%, respectively, and the 1-, 3-, and 5-year OS rates of a poorer immune status (NLR = 1) were 95.9%, 83.7%, and 71.9%, respectively (p = .424) (). Concerning the inflammation status (GPS), the 1-, 3-, and 5-year OS rates of a lower inflammation status (GPS = 0) were 98.3%, 88.1%, and 76.0%, respectively, and the 1-, 3-, and 5-year OS rates of a higher inflammation status (GPS = 1 and 2) were 92.9%, 76.3%, and 46.0%, respectively (p = .001) (). To clarify whether the difference between our result (i.e. NLR was not an effective indicator for predicting OS in patients with early HCC after ablation) and that of previously published studies was caused by the selection of cutoff values, we plotted different Kaplan–Meier curves based on the cutoff values reported in previous studies [Citation9,Citation21]. As a result, we still found that NLR was not an effective indicator for predicting OS in those patients ().
Figure 6. Comparison of overall survival rates between poor and good immune status (A; the cutoff value of neutrophil-to-lymphocyte ratio was 3.0), and between high and low inflammation status (B).
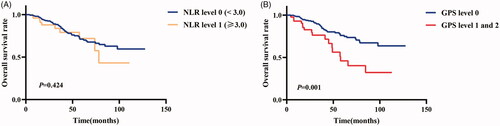
Figure 7. Comparison of overall survival rates between poor and good immune status under different cutoff values of neutrophil-to-lymphocyte ratio (A, cutoff value of 2.5; B, cutoff values of 2 and 3.2).
Discussion
At present, thermal ablation is one of the first-line treatments for patients with single-nodule HBV-associated HCC within the Milan criteria [Citation4]. However, some studies have shown that sex, age, tumor size, AFP level, cirrhosis, CP grade, ALBI grade, PNI, NLR, and GPS have clear correlations with the prognosis of patients with HCC who meet the Milan criteria [Citation21–28]. Therefore, these results indicated the heterogeneity of HCC within the Milan criteria. The aim of this study was to identify, using cluster analysis, the different phenotypes of patients with HBV-associated HCC with a single nodule ≤3 cm treated with thermal ablation as the first-line therapy, in order to improve the understanding of the heterogeneity of HCC.
Cluster analysis can group subjects into different clusters with the within-cluster minimal sum of squares and the between-cluster maximum sum of squares [Citation16]. Therefore, patients with similar clinical characteristics are grouped in the same cluster, and patients with different clinical characteristics are distributed into different clusters. The variables used in the clustering algorithm were selected according to their potential prognostic values in HCC meeting the Milan criteria. In addition, the statistical technique of factor analysis was used to further select variables [Citation15]. Therefore, we identified two specific phenotypes related to prognosis, which were differentiated by baseline characteristics before thermal ablation. One phenotype that was not suitable for ablation alone was identified, which was characterized by late-onset disease, higher inflammatory response, worse liver function, and poorer immune status. The results were further clarified using MCA, a principal component analysis technique that is suitable for dealing with multiple categorical variables [Citation19]. The findings were consistent with previously published results: patients with HCC within the Milan criteria characterized by early-onset disease, better liver function (lower ALBI grade and CP grade), lower inflammatory response (lower PNI and GPS), and good immune status (lower NLR) had significantly better prognosis than those characterized by elderly-onset disease, worse liver function (higher ALBI grade and CP grade B), higher inflammatory response (higher PNI and GPS), and relatively poor immune status (higher NLR) [Citation21,Citation23–28].
Discriminant analysis further verified the clusters generated by hierarchical clustering. Stepwise discriminant analysis showed that NLR and GPS were the two most influential variables for cluster analysis [Citation18]. In our study, NLR, which was calculated as the ratio of serum neutrophil count to lymphocyte count, was considered a surrogate for immune status. The increase in neutrophils could promote the growth and invasiveness of tumors through the release of vascular endothelial growth factor, which can promote the infiltration of immunosuppressive cells, inhibit the maturation of antigen-presenting cells, and further lead to the immunosuppression of the tumor microenvironment [Citation29,Citation30]. It is well known that lymphocytes play crucial roles in the adaptive immune response to tumors. The results of this study showed that an NLR of 1 was significantly associated with higher neutrophil counts and lower lymphocyte counts than an NLR of 0. Therefore, it is reasonable to use NLR as one substitute for immune status. With respect to the ability of NLR to predict the prognosis after thermal ablation, a higher NLR accompanied by a larger tumor size (≥3 cm) has been described to be significantly associated with a worse prognosis in patients with HCC within the Milan criteria who underwent thermal ablation [Citation21]. However, in our study, despite using the cutoff values reported in previous studies [Citation9,Citation21], NLR was still not an effective indicator for predicting OS in patients with HBV-associated HCC with a single nodule ≤3 cm treated with curative thermal ablation. These differences may be related to tumor size because our study did not include HCCs >3 cm [Citation9,Citation23]. We also found that NLR was not significantly associated with cirrhosis, higher serum AFP level, and worse liver function, consistent with previously published results [Citation21]. Therefore, our finding that NLR is not an effective indicator for predicting OS in these patients may be due to comprehensive reasons. GPS and PNI have been considered inflammation-related prognostic indices [Citation11]. In our study, GPS, PNI, and CRP level were included in factor 1 in the factor analysis, which suggested that GPS and PNI were significantly associated with CRP, an inflammation-sensitive marker that plays an important role in the regulation of the inflammatory process [Citation11,Citation31]. In addition, our study showed that GPS and PNI had similar predictive abilities for prognosis with respect to OS. However, PNI is composed of serum albumin level and total lymphocyte count, whereas GPS consists of serum CRP and albumin levels. Therefore, GPS may be more representative of the inflammation status of patients. No studies have reported that GPS could predict the prognosis of patients with HCC within the Milan criteria who underwent thermal ablation. However, a study showed that a GPS of 1 or 2 was an independent risk factor for long-term outcomes of HCC patients within the Milan criteria who received a liver transplant [Citation28]. Our study also showed that GPS was a good inflammation-related indicator for predicting the OS of patients after curative thermal ablation. Interestingly, we found a strong negative correlation between inflammatory response and liver function in MCA, and this negative correlation was further identified by Pearson’s chi-square test and correlation analysis.
This is the first study to investigate the combined application of factor analysis, cluster analysis, discriminant analysis, and MCA for the identification of the heterogeneity of HCC in patients undergoing thermal ablation as the first-line treatment. Our results could provide a novel classification algorithm related to prognosis based on preoperative baseline characteristics, which would allow clinicians to make better decisions for patients with single-nodule HBV-associated HCC ≤3 cm. In addition, as cluster analysis has the nature of unsupervised learning, this technique does not have any a priori assumption and reflects more accurate real-world outcomes. Therefore, on the basis of the above analysis, we propose a new perspective that thermal ablation alone is not suitable for all patients with HBV-associated HCC with a single nodule ≤3 cm. Among such patients, those with early-onset disease, better liver function, lower inflammatory response, and good immune status (with lower inflammatory response being the most important factor) are the most suitable for thermal ablation-alone treatment. However, for patients with single-nodule HBV-associated HCC ≤3 cm with elderly-onset disease, worse liver function, higher inflammatory response, and poor immune status (with higher inflammatory response being the most important factor), more optimized first-line therapies, rather than thermal ablation alone, should be selected.
This study had some limitations. First, this was a single-center retrospective study, which may be subject to selection bias; however, as the unsupervised nature of the analysis was the major strength of this study, it is difficult to produce a subjective selection bias. Second, our cohort consisted of a relatively small number of patients, which limited the robustness of the analysis. Third, the study was based on a patient population with single-nodule HBV-associated HCC ≤3 cm. Thus, in patients with non-HBV-predominant HCC, whether cluster analysis can obtain the same results needs to be further verified. Fourth, NLR and GPS were used as surrogates for immune status and inflammation status, respectively; however, more predictive indices may be revealed in the future. Therefore, validation is necessary in prospective and multicentre randomized controlled trials, and more predictive surrogates for immune status and inflammation status need to be identified in the future.
Conclusions
Our study revealed that two phenotypically distinct and clinically meaningful clusters can be identified using clustering analysis of clinically available data of patients with single-nodule HBV-associated HCC ≤3 cm. Patients with HCC with elderly-onset disease, worse liver function, higher inflammatory response, and poor immune status (with higher inflammatory response being the most important factor) are not suitable for thermal ablation alone as the first-line therapy.
Acknowledgements
We would like to thank Ms Binyan Shen for her support of Shuanggang Chen.
Disclosure statement
No potential conflict of interest was reported by the author(s).
Data availability statement
The datasets used and analyzed in the current study are available from the corresponding author on reasonable request.
Additional information
Funding
References
- Siegel R, Naishadham D, Jemal A. Cancer statistics, 2012. CA Cancer J Clin. 2012;62(1):10–29.
- Zhang B, Zhang B, Zhang Z, et al. 42,573 cases of hepatectomy in China: a multicenter retrospective investigation. Sci China Life Sci. 2018;61(6):660–670.
- Heimbach JK, Kulik LM, Finn RS, et al. AASLD guidelines for the treatment of hepatocellular carcinoma. Hepatology. 2018;67(1):358–380.
- Benson AR, D'Angelica MI, Abbott DE, et al. NCCN guidelines insights: hepatobiliary cancers, version 1.2017. J Natl Compr Canc Netw. 2017;15(5):563–573.
- Sapisochin G, Bruix J. Liver transplantation for hepatocellular carcinoma: outcomes and novel surgical approaches. Nat Rev Gastroenterol Hepatol. 2017;14(4):203–217.
- Feng K, Yan J, Li X, et al. A randomized controlled trial of radiofrequency ablation and surgical resection in the treatment of small hepatocellular carcinoma. J Hepatol. 2012;57(4):794–802.
- Johnson PJ, Berhane S, Kagebayashi C, et al. Assessment of liver function in patients with hepatocellular carcinoma: a new evidence-based approach-the ALBI grade. J Clin Oncol. 2015;33(6):550–558.
- Abe T, Tashiro H, Kobayashi T, et al. Glasgow Prognostic Score and prognosis after hepatectomy for hepatocellular carcinoma. World J Surg. 2017;41(7):1860–1870.
- Chen TM, Lin CC, Huang PT, et al. Neutrophil-to-lymphocyte ratio associated with mortality in early hepatocellular carcinoma patients after radiofrequency ablation. J Gastroenterol Hepatol. 2012;27(3):553–561.
- Man Z, Pang Q, Zhou L, et al. Prognostic significance of preoperative prognostic nutritional index in hepatocellular carcinoma: a meta-analysis. HPB (Oxford)). 2018;20(10):888–895.
- Sanghera C, Teh JJ, Pinato DJ. The systemic inflammatory response as a source of biomarkers and therapeutic targets in hepatocellular carcinoma. Liver Int. 2019;39(11):2008–2023.
- Shibata T, Iimuro Y, Yamamoto Y, et al. Small hepatocellular carcinoma: comparison of radio-frequency ablation and percutaneous microwave coagulation therapy. Radiology. 2002;223(2):331–337.
- Tan W, Deng Q, Lin S, et al. Comparison of microwave ablation and radiofrequency ablation for hepatocellular carcinoma: a systematic review and meta-analysis. Int J Hyperthermia. 2019;36(1):264–272.
- Kudo M. Local ablation therapy for hepatocellular carcinoma: current status and future perspectives. J Gastroenterol. 2004;39(3):205–214.
- Kaiser HF. The varimax criterion for analytic rotation in factor analysis. Psychometrika. 1958;23(3):187–200.
- Ward JH. Hierarchical grouping to optimize an objective function. J Am Stat Assoc. 1963;58(301):236–244.
- Vergara VM, Salman M, Abrol A, et al. Determining the number of states in dynamic functional connectivity using cluster validity indexes. J Neurosci Methods. 2020;337:108651.
- Badagliacca R, Rischard F, Papa S, et al. Clinical implications of idiopathic pulmonary arterial hypertension phenotypes defined by cluster analysis. J Heart Lung Transplant. 2020;39(4):310–320.
- Neudecker H, Greenacre M, Blasius J. Multiple correspondence analysis and related methods. Stat Papers. 2010;51(4):1017–1018.
- Rodriguez-Alvarez MX, Meira-Machado L, Abu-Assi E, et al. Nonparametric estimation of time-dependent ROC curves conditional on a continuous covariate. Stat Med. 2016;35(7):1090–1102.
- Chu MO, Shen CH, Chang TS, et al. Pretreatment inflammation-based markers predict survival outcomes in patients with early stage hepatocellular carcinoma after radiofrequency ablation. Sci Rep. 2018;8(1):16611.
- Zhang H, Han J, Xing H, et al. Sex difference in recurrence and survival after liver resection for hepatocellular carcinoma: a multicenter study. Surgery. 2019;165(3):516–524.
- Zhang F, Wu G, Sun H, et al. Radiofrequency ablation of hepatocellular carcinoma in elderly patients fitting the Milan criteria: a single centre with 13 years experience. Int J Hyperthermia. 2014;30(7):471–479.
- Hocquelet A, Balageas P, Laurent C, et al. Radiofrequency ablation versus surgical resection for hepatocellular carcinoma within the Milan criteria: a study of 281 Western patients. Int J Hyperthermia. 2015;31(7):749–757.
- Doyle A, Gorgen A, Muaddi H, et al. Outcomes of radiofrequency ablation as first-line therapy for hepatocellular carcinoma less than 3cm in potentially transplantable patients. J Hepatol. 2019;70(5):866–873.
- Ho SY, Liu PH, Hsu CY, et al. An albumin-bilirubin (ALBI) grade-based prognostic model for patients with hepatocellular carcinoma within milan criteria. Am J Clin Oncol. 2019;42:698–704.
- Jiang YQ, Wang ZX, Deng YN, et al. Efficacy of hepatic resection vs. radiofrequency ablation for patients with very-early-stage or early-stage hepatocellular carcinoma: a population-based study with stratification by age and tumor size. Front Oncol. 2019;9:113.
- Abe T, Tashiro H, Hattori M, et al. Prediction of long-term survival by using the Glasgow Prognostic Score in patients with hepatocellular carcinoma after liver transplantation. Hepatol Res. 2016;46(7):622–633.
- Hato T, Zhu AX, Duda DG. Rationally combining anti-VEGF therapy with checkpoint inhibitors in hepatocellular carcinoma. Immunotherapy. 2016;8(3):299–313.
- Kusumanto YH, Dam WA, Hospers GA, et al. Platelets and granulocytes, in particular the neutrophils, form important compartments for circulating vascular endothelial growth factor. Angiogenesis. 2003;6(4):283–287.
- Carlson CS, Aldred SF, Lee PK, et al. Polymorphisms within the C-reactive protein (CRP) promoter region are associated with plasma CRP levels. Am J Hum Genet. 2005;77(1):64–77.