
Abstract
Purpose
In pancreatic cancer treatment, hyperthermia can be added to increase efficacy of chemo- and/or radiotherapy. Gas in stomach, intestines and colon is often in close proximity to the target volume. We investigated the impact of variations in gastrointestinal gas (GG) on temperature distributions during simulated hyperthermia treatment (HT).
Methods
We used sets of one CT and eight cone-beam CT (CBCT) scans obtained prior to/during fractionated image-guided radiotherapy in four pancreatic cancer patients. In Plan2Heat, we simulated locoregional heating by an ALBA-4D phased array radiofrequency system and calculated temperature distributions for (i) the segmented CT (sCT), (ii) sCT with GG replaced by muscle (sCT0), (iii) sCT0 with eight different GG distributions as visible on CBCT inserted (sCTCBCT). We calculated cumulative temperature-volume histograms for the clinical target volume (CTV) for all ten temperature distributions for each patient and investigated the relationship between GG volume and change in ΔT50 (temperature increase at 50% of CTV volume). We determined location and volume of normal tissue receiving a high thermal dose.
Results
GG volume on CBCT varied greatly (9-991 cm3). ΔT50 increased for increasing GG volume; maximum ΔT50 difference per patient was 0.4–0.6 °C. The risk for GG-associated treatment-limiting hot spots appeared low. Normal tissue high-temperature regions mostly occurred anteriorly; their volume and maximum temperature showed moderate positive correlations with GG volume, while fat-muscle interfaces were associated with higher risks for hot spots.
Conclusions
Considerable changes in volume and position of gastrointestinal gas can occur and are associated with clinically relevant tumor temperature differences.
Graphical Abstract
Gastrointestinal gas displays large day-to-day variations
Maximum differences in ΔT50 due to changes in gas were 0.4–0.6 °C
Temperature differences due to variations in gas are clinically relevant
Risk for treatment-limiting hot spots appears low
HIGHLIGHTS
1. Introduction
Pancreatic cancer remains associated with a very poor prognosis, with a 5-year relative survival of 10% [Citation1]. The treatment of choice for (borderline) resectable pancreatic cancer is resection combined with (neo-)adjuvant chemo-(radio)therapy [Citation2]. For patients with locally advanced or metastatic pancreatic cancer (the vast majority of diagnoses), chemotherapy is the standard of care [Citation3]. Pancreatic tumors, however, are resistant to chemotherapy [Citation4] and radiotherapy [Citation5], strengthening the need for strategies to enhance treatment efficacy.
Mild hyperthermia treatment (HT), in which the temperature of the tumor is raised to approximately 40–44 °C for typically 60–90 min, acts as a sensitizer for chemo- and radiotherapy [Citation6–8]. HT has yielded good clinical results for various tumor sites, including soft tissue sarcomas [Citation9,Citation10], non-muscle invasive bladder cancer [Citation11–13], cervical cancer [Citation14,Citation15], (recurrent) breast cancer [Citation16], head&neck cancer and melanoma [Citation17,Citation18].
For pancreatic cancer, several studies have indicated that combining chemo- and/or radiotherapy with HT may be beneficial, increasing overall survival [Citation19–22]. To further investigate the potential role of HT for this patient group, there are two randomized trials currently ongoing: HEATPAC (NCT02439593), a phase II trial of concurrent thermochemoradiotherapy vs. chemoradiotherapy in advanced pancreatic cancer [Citation23], and HEAT (NCT01077427), a phase III trial of adjuvant chemotherapy vs. thermochemotherapy for resected pancreatic cancer [Citation24].
However, as sensitization is highly temperature-dependent, for chemotherapy as well as for radiotherapy, the therapeutic effect of HT strongly depends on the achieved tumor temperatures [Citation7,Citation25–27]. For radiotherapy, major mechanisms of sensitization by HT are inhibition of DNA repair [Citation28], selective direct killing of radioresistant hypoxic tumor cells and reoxygenation by increased tissue perfusion [Citation6,Citation29]. In combination with chemotherapy, heating can enhance the cytotoxic reaction, as demonstrated in, e.g., an in vitro animal tumor cell study [Citation26]. In addition, HT increases blood flow and vascular permeability, thus enhancing drug delivery [Citation7], induces direct cell death and has a positive impact on the immune response [Citation7,Citation30]. Many of the relevant sensitizing mechanisms display a steep temperature dependence; an increase of 0.5 °C can result in a doubling of the cytotoxic effect, as shown in in vitro studies for several agents including cisplatin, melphalan and oxaliplatin [Citation25,Citation26]. In particular oxaliplatin, which is part of folfirinox, is relevant for pancreatic cancer treatment [Citation8,Citation28]. Some sensitizing mechanisms require a temperature above a certain threshold, as seen, e.g., for inhibition of DNA repair. Cell studies showed that DNA repair inhibition is optimal for temperatures between 41 and 43 °C, while below 41 °C this mechanism is not activated [Citation8,Citation28]. As a consequence of these temperature dependencies, even small changes in temperature may affect HT efficacy and thus clinical outcome.
Deep-seated tumors are usually heated with locoregional heating equipment consisting of multiple radiofrequency antennas surrounding the patient [Citation31]. During local HT, power is focused to the tumor location, but normal tissue temperatures are also increased. The occurrence of local excessive temperatures in normal tissue (so-called hot spots) can cause patient discomfort or pain; as a result, the achieved tumor temperatures may be limited. Treatment planning, based on pretreatment computed tomography (CT) or magnetic resonance imaging (MRI), can be used to optimize temperature distributions [Citation32–36] and thus lessen or prevent hot spots [Citation37]. However, in the time between imaging and HT as well as during HT, anatomical changes may take place, leading to differences between calculated and actual temperature distributions [Citation38].
Due to the location of the pancreas, gas in stomach, intestines and colon is often in close proximity to the target volume. In pancreatic cancer patients, volume and location of gastrointestinal gas has been shown to vary considerably from day to day [Citation39,Citation40], which can severely affect radiation dose distributions for photon [Citation40] and particle therapy [Citation41]. Whether there is a comparable impact on the temperature distribution in HT, however, is yet unknown.
The aim of this study is to investigate the effect of changes in gastrointestinal gas on temperature distributions in pancreatic cancer patients treated with locoregional HT. For this, we calculated temperature distributions using clinical imaging data of four pancreatic cancer patients with representative and relevant dynamic changes in gas volume. Differences in predicted temperatures for the target volume and high-temperature regions in normal tissue were evaluated.
2. Materials and methods
2.1. Patient cohort
In a previous study, we reported on the change in gastrointestinal gas over the course of cone beam CT (CBCT)-guided radiotherapy for nine patients (P1–P9) with pancreatic cancer [Citation40]. Gastrointestinal gas varied considerably over the course of the three-week radiation treatment (). To adequately investigate the effect of changes in gastrointestinal gas volume on temperature distributions, we needed to sample sufficiently large changes in gas volume. Therefore, we selected patients from this cohort based on the range of relevant gastrointestinal gas (i.e., gas located within the radiotherapy 20% isodose surface, the volume parameter defined in the original radiotherapy article [Citation40]). Since two of the nine patients had a large range of relevant gastrointestinal gas (>450 ml) and all others had considerable smaller ranges (<200 ml), we selected the four patients with largest range. As patient P5 had a metal biliary stent that would hamper tissue segmentation for hyperthermia treatment planning due to the imaging artifacts, we included P6, who had a similar gastrointestinal gas volume range, instead. Thus, the cohort of this study consisted of P7, P8, P1 and P6 (in order of decreasing range of relevant gastrointestinal gas volume).
Table 1. Relevant gastrointestinal gas (GG) volume (i.e. GG located within the radiotherapy 20% isodose surface) for CT and CBCTs [Citation40].
2.2. Imaging data
For each patient, a pretreatment CT (resolution, 0.98 × 0.98 mm2, 2.50 mm slice thickness; LightSpeed RT16, General Electric Company, Waukesha WI) obtained for radiation treatment planning and 14–15 CBCTs (1.00 × 1.00 × 1.00 mm3; Synergy system, Elekta Oncology Systems, Crawley, UK) were available; patients had received 14–15 treatment fractions, with daily CBCT imaging prior to irradiation. From these, we selected eight CBCTs, namely those from the odd treatment fractions; patient P7 did not receive a 15th fraction, so we substituted with the CBCT from the 2nd fraction.
Each CBCT was translated according to the clinically used table shift and resampled in the frame of reference of the CT, thus registering the CTVs (Velocity, version 4.0, Varian Medical Systems, Palo Alto, USA).
2.3 E-Field and temperature calculations
For hyperthermia treatment planning simulations, a patient model is usually generated from a CT scan by applying Hounsfield Unit (HU)-based segmentation to distinguish between tissues with a large dielectric contrast, i.e., muscle, fat, bone, lung and air [Citation42]. To investigate the effect of variations in gastrointestinal gas (GG) on temperature, preferably the daily CBCTs would be used to establish the patient anatomy and differentiate between tissue types. However, with CBCT HUs being unreliable [Citation43], accurate CBCT tissue segmentation for hyperthermia treatment planning is not possible. Therefore, we obtained the daily GG volume and location from CBCT, but used the CT for tissue segmentation. Using jVolumetool and the in-house developed C++-based HT planning software package Plan2Heat [Citation42,Citation44], we created the geometries needed for calculations via the following steps, corresponding to the panels in .
Figure 1. Schematic of data analysis: (a) CT, (b) segmented CT (sCT), (c) sCT with gas replaced by muscle (sCT0), (d) cone-beam CT (CBCT), (e) segmented gas from CBCT (GG-CBCT), (f) sCT with GG-CBCT inserted (sCTCBCT), (g) calculated temperature distributions, (h) cumulative volume-temperature histograms. Structures sCT, sCT0 and sCTCBCT were used for temperature calculations. Note: for calculations, segmented external air was replaced by water bolus.
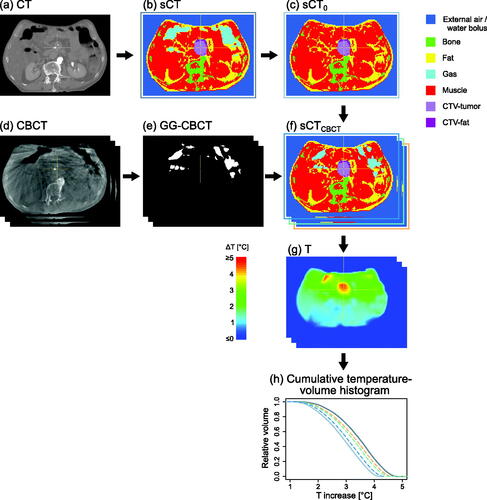
CT, the planning CT scan;
sCT, the segmented CT, created by segmenting into air, bone, fat, and muscle based on HU. Subsequently, based on location, for the air a distinction was made between external air, lungs (i.e., air in lungs + lung tissue) and gastrointestinal gas (GG-CT). High-intensity voxels from iodine-containing intravenous contrast agents, implants and imaging artifacts that were segmented as bone were replaced by muscle. Next, the CTV as delineated on CT was defined, with a distinction between fat-like and muscle-like tissue;
sCT0, sCT with all GG-CT replaced by muscle;
CBCT, the CBCT scan;
GG-CBCT, the gastrointestinal gas on CBCT segmented using a threshold (HU<-550); GG within the CTV was excluded;
sCTCBCT, which is sCT0 with GG-CBCT inserted, limited to within the body contour on CT.
Of these geometries, sCT (), sCT0 (), and the eight sCTCBCT () were used for calculations.
We conducted our HT simulations for the ALBA-4D (Med-Logix, Rome, Italy), a locoregional HT system that consists of a ring of four 70 MHz waveguides connected to a phase- and amplitude-controlled RF generator [Citation45,Citation46]. For skin cooling and improvement of electric coupling, a water-filled bolus (40 cm in cranial-caudal direction) was positioned between the patient's body contour and the waveguides, as would be done during clinical treatment. The temperature of the bolus was set at 12 °C, in accordance with clinical practice at our institute [Citation37], where we maintain a bolus temperature of 12 °C during the entire HT. A towel, placed for patient comfort between skin and cold bolus during patient positioning and preparation, is removed before starting HT. The values of dielectric and thermal properties at 70 MHz, as used in the simulations, are listed in .
Table 2. Values of the dielectric and thermal properties for gastrointestinal gas and different tissue types at 70 MHz, used in the simulations.
For the calculations, executed in Plan2Heat, each patient volume (sCT, sCT0 and each of the eight sCTCBCT was resampled to 2.5 × 2.5 × 2.5 mm3; for remaining artifacts, for example from lead positioning markers, voxels were assigned an appropriate segmentation (e.g., external air or fat, depending on whether the voxel was located inside or outside the patient contour). Next, the patient anatomy was positioned between the antennas such that the CTV was located centrally in front of the waveguide apertures in cranial-caudal direction. The CT scans were 23.75–29.75 cm in cranial-caudal direction. This is insufficient for accurate electromagnetic field simulations, since the water bolus would extend beyond the patient model, thereby introducing artifacts by introducing incorrect fringing fields at the cranial and caudal borders of the computational domain. Therefore, for each patient the volume was extended to 50 cm by repeating the most cranial and most caudal slices [Citation47]. Although this approach introduces errors in the anatomical information and computed fields in the border regions, the effect on the field distribution in the central tumor target region will be minimal; in addition, with an ALBA-4D focus size of 15–20 cm [Citation45,Citation46], field values in the border regions will be low, thus limiting temperature increase, and with that limiting the effect of an incorrect anatomy on temperature increase, in those regions. Electromagnetic-field calculations were performed, for each of the four antennas separately, using the finite difference time domain method with perfectly matched layer boundary conditions [Citation42].
As we were interested in the differences in temperature due to GG changes representative for the clinical situation, we applied standard relative phases for the antennas, suitable to focus at the approximate position of the CTV: 0° (top), 20° (bottom), 40° (left), and 40° (right); amplitudes were equal for all four antennas, with a total power of 400 W.
The power absorption in the patient was calculated using superposition and the corresponding temperature distribution was calculated by solving the Pennes bio-heat equation at steady-state [Citation48], with the water bolus represented as a fixed-temperature boundary condition. This yielded ten temperature distributions per patient for further analyses.
2.4. Analyses
For each patient, the temperature distributions () for sCT and sCT0 were compared with the distributions for sCTCBCT. From the distributions, cumulative temperature-volume histograms were created for the CTVs (). To assess the relation between GG volume and temperature increase, the temperature increase (relative to 37 °C) at 50% of the CTV volume (ΔT50) was determined for every histogram, and plotted against GG volume; for each patient we applied a linear fit to the ten data points (sCT, sCT0 and sCTCBCT and calculated the coefficient of determination R2.
To investigate the potential occurrence of hot spots, we determined for each distribution the volume of normal tissue (i.e., muscle, fat and bone combined) reaching a temperature level with enhanced risk of tissue damage. Damage starts occurring at temperatures exceeding 44–45 °C [Citation49–51], i.e., 1–2 °C higher than the goal temperature of 43 °C in the tumor. To enable a comparison between patients, we defined normal tissue temperatures for each patient relative to T50 of the CTV for sCT for that patient, i.e., Tref = ΔT50 + 37 °C. Thus, we determined VTref+1 and VTref+2, i.e., the volumes of normal tissue reaching Tref + 1 °C and Tref + 2 °C, respectively. We investigated the location of these high-temperature regions and plotted their volumes as a function of GG volume to investigate the relation between GG and high temperature in normal tissue.
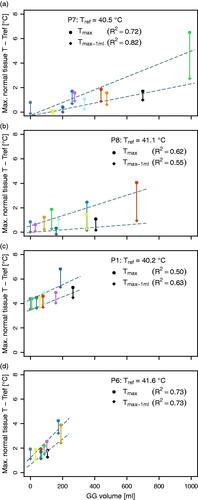
To further investigate potential hot spots, we determined for each patient Tmax, i.e., the maximum normal tissue temperature. Since Tmax may reflect the temperature in a very small volume (e.g., a single voxel), we also determined the near-maximum temperature Tmax-1ml, i.e., the maximum temperature when ignoring the 64 voxels of normal tissue with highest temperature; 64 voxels have a combined volume of 1 ml. Both Tmax and Tmax-1ml were expressed relative to Tref and for both we investigated their relation with GG volume.
All analyses were performed in R, version 3.5.1 [Citation52].
3. Results
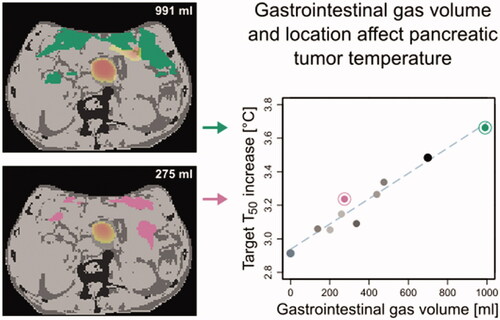
For the four patients, gastrointestinal gas volume varied considerably over sCT and the eight sCTCBCT (). The largest variability was found for P7, with a GG volume range of 138–991 cm3. shows, as an example, the scans and corresponding geometries and temperature distributions for patient P7, for CT (GG volume of 699 cm3) and one CBCT (260 cm3, 5th fraction); this change in GG volume and location resulted in a change in temperature distribution, for the CTV as well as for the surrounding normal tissue, with ΔT50 of the CTV decreasing from 3.5 °C (CT) to 3.1 °C (CBCT).
Figure 2. Example of imaging data and calculation results for patient P7, with (a) CT scan, (b) CBCT of 5th fraction, (c) segmented CT (sCT), (d) sCTCBCT, i.e. sCT with GG-CT replaced by muscle and GG-CBCT inserted, (e) temperature distribution for sCT, (f) temperature distribution for sCTCBCT. GG volume was 699 cm3 for sCT (c) and 260 cm3 for the sCTCBCT (d). Note: for calculations, segmented external air was replaced by water bolus.
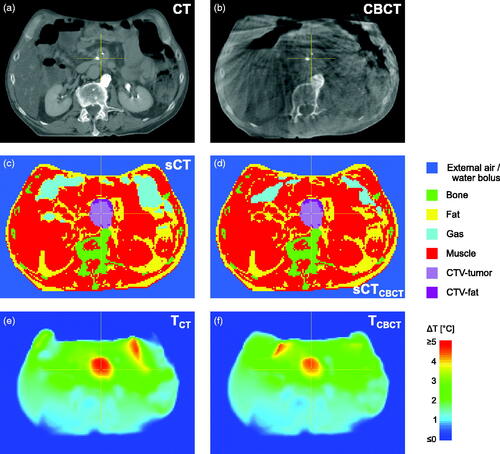
Table 3. Results of this study.
Cumulative temperature-volume histograms (, left column) show the differences in CTV temperature between sCT, sCT0 and sCTCBCT; a larger GG volume was associated with a higher ΔT50 (, right column). Over the four patients, the difference in ΔT50 ranged from 0.4 to 0.6 °C ().
Figure 3. (Left column) For four patients, cumulative temperature-volume histograms of clinical target volume (CTV), for sCT, sCT0 and sCTCBCT data for eight fractions. (Right column) Relation between ΔT50 and volume of gastrointestinal gas (GG) for sCT (dark gray double circle), sCT0 (light gray double circle) and sCTCBCT (colored dots); R2 is the coefficient of determination for the linear fit (dashed line) to the ten data points.
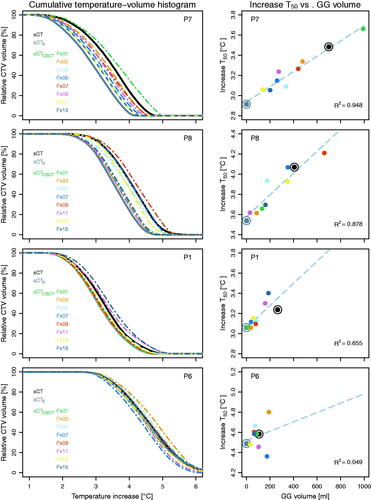
The linear fit yielded for P7 and P8 an R2 of 0.95 and 0.88, respectively, indicating a strong correlation between GG volume and ΔT50. For P1, the correlation was moderate (R2=0.66) and for P6 no correlation was found. Likely, the limited variation in GG volume for the two latter patients played a role in the obtained strength of correlation. The relation between GG volume and ΔT50 is patient specific, as slopes differed between patients, even for the two patients with large range of GG volume.
In our simulations, the location of high temperature in normal tissue was mostly in the anterior region of the patients, often in tissue adjacent to GG (). Moderate to very strong correlations with GG volume were found for VTref+1 and VTref+2 for all patients (0.55 < R2<0.95), with larger GG volumes associated with larger high-temperature volumes; slopes differed considerably between patients (). The effect of a change in GG volume and location can, for example, be seen when comparing the temperature distributions for the 11th () and 13th fraction () of patient P1.
Figure 4. sCTCBCT with colorwash of corresponding temperature distribution, for patient P1, 11th fraction (a; GG volume = 158 cm3) and 13th fraction (b; 58 cm3), and patient P7, 1st fraction (c; 991 cm3) and 9th fraction (d; 275 cm3). Regions of high temperature in normal tissue were generally located near GG. For patient P1, who had more fat tissue, high temperature regions were also found at the anterior fat-muscle interface (a and b). Note: these 2D images show a limited view of the 3D temperature distribution; colorwash only shown for high-temperature regions (ΔT ≈≥ 3.5 °C).
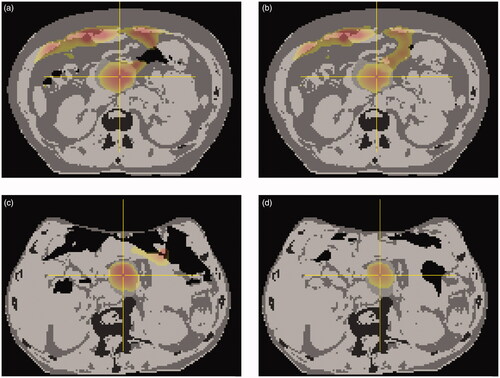
Figure 5. Volume of normal tissue reaching Tref +1 °C and Tref +2 °C, for patients (a) P7, (b) P8, (c) P1 and (d) P6, with Tref = ΔT50 + 37 °C for the CTV for sCT of that patient. Data from temperature distributions for sCT (black), sCT0 (dark gray) and sCTCBCT (colors corresponding to colors in ). Linear fit and corresponding R2 are given for each.
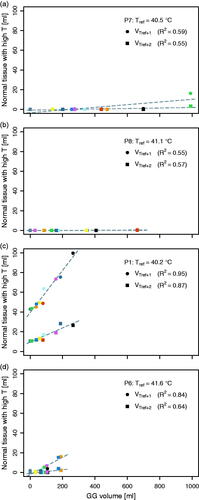
Patients P6, P7 and P8 had relatively little fat tissue, a feature often seen in pancreatic cancer patients [Citation53,Citation54]. For all their temperature distributions, VTref+1 and VTref+2 were very small (<20 cm3; ). For patient P1, who had more fat tissue, the maximum VTref+1 and Vref+2 were 100 and 28 cm3, respectively (); correlations with GG volume were very strong (R2 of 0.87 and 0.95, respectively). For this patient, the high-temperature regions were not only seen adjacent to the target volume and GG, but also at the anterior fat-muscle interface ().
Upon further investigating normal tissue temperatures, we found for both Tmax and Tmax-1ml a positive correlation with GG volume (; 0.50 < R2<0.82). Overall, however, the potential for hot spots to occur appeared limited: for patients P6, P7 and P8, we found Tmax>Tref +3 °C in just four out of 30 temperature distributions (). In addition, these regions of high temperature were typically small (<1 ml), since for only one of those distributions (P6, 7th fraction) also Tmax-1ml was > Tref +3 °C (). For these three patients, the highest temperature in normal tissue (relative to T50 of the CTV for the sCT), was found for the largest GG volume (patient P7, 1st fraction; Tmax = 6.5 °C). Only for patient P1, the patient with more fat, the temperatures in normal tissue were higher (), with 4.4 < Tmax<6.8 °C (mean, 4.9 °C) and 3.5 < Tmax-1ml <5.3 °C (mean, 4.0 °C).
Figure 6. Maximum temperature in normal tissue, Tmax, as well as the maximum temperature in normal tissue when ignoring 1 ml (64 voxels) of normal tissue with highest temperature, Tmax–1 mL; both relative to Tref, with Tref = ΔT50 + 37 °C for the CTV for sCT of that patient. Data from temperature distributions for sCT (black), sCT0 (dark gray) and sCTCBCT (colors corresponding to colors in ). Linear fit and corresponding R2 are given for each.
4. Discussion
In this study, we used simulations to investigate the effect of changes in gastrointestinal gas on the temperature distribution for patients with pancreatic cancer receiving HT. For the four patients investigated, an increase in GG volume on CT/CBCT yielded an increase in temperature, with difference in ΔT50 of the CTV in the range of 0.4–0.6 °C (). Detailed knowledge on temperature-effect relations for specific treatment combinations is, also for pancreatic cancer, very limited; however, temperature dependence of HT efficacy has been shown to differ greatly between the different mechanisms [Citation55] and the thermal dose dependency is assumed to be steep, with a doubling of dose per 0.5 °C [Citation27]. Therefore, temperature differences <1 °C as seen in our simulations may have a considerable effect on HT efficacy.
Contrary to radiotherapy courses, which often consist of daily fractions during several weeks, HT is usually administered only once or twice per week, resulting in as few as 5 HT fractions. Therefore, while for radiotherapy effects may average out, changes in GG can have a relatively large impact on the total thermal dose of a HT series.
In addition to these direct effects on efficacy, changes in temperature distribution may locally create unforeseen hot spots, causing thermal damage to normal tissues [Citation49–51,Citation56]. The effects of these hot spots may, typically at temperatures >44–45 °C, be experienced by the patient as discomfort or pain. Consequently, the occurrence of hot spots often leads to the applied power being reduced, thereby decreasing the overall tumor temperature and thus the beneficial effect of HT. However, as hot spots mostly appear at tissue interfaces (e.g., fat-muscle) and patients with pancreatic cancer in general do not have a lot of fat tissue [Citation53,Citation54], hot spots may occur less frequently in this patient group.
To investigate the potential occurrence of hot spots in our cohort, we assessed the volume of normal tissue reaching a relatively high temperature, the location of these regions, as well as the maximum and near-maximum temperature in normal tissue. In our simulations, for three out of four patients indeed both the volume of normal tissue reaching a high temperature and the maximum normal tissue temperature were limited, with VTref+1 <20 cm3 and for all except four distributions Tmax < 2.6 °C. When assuming a Tref of 43 °C (the widely accepted HT goal temperature for the target), this would correspond to a maximum temperature <45.6 °C. Since pain sensations usually occur when normal tissue temperatures exceed 45 °C [Citation50], such temperature levels could lead to treatment-limiting hot spots. In the four instances with a higher Tmax, the associated Tmax-1ml indicated that the volume of the potential hot spot was (very) small.
For the patient with more fat tissue (patient P1), the maximum VTref+1 was 100 cm3 and the mean Tmax and Tmax-1ml were 4.9 °C and 4.0 °C, respectively. Although accurate quantitative prediction of hot spots is difficult [Citation57], these results—especially regarding the high near-maxima—infer that hot spots might occur. Whether this larger volume of high temperature and higher (near-)maximum temperature were a consequence of the larger amount of fat tissue was not directly investigated; however, while for all patients high-temperature regions were found adjacent to gastrointestinal gas, for this patient, additionally a large volume of high temperature in normal tissue was located near the anterior fat-muscle interface. Location and temperature of high-temperature regions depended on GG location and volume, which may change between HT fractions.
Hyperthermia treatment planning can play an important role in achieving sufficient heating of the target volume [Citation58]. Possibly, the use of daily imaging prior to HT can help in predicting temperature distributions including hot spots in pancreatic cancer patients. Although on-line plan adaptation based on new imaging data is not feasible because recomputation of electromagnetic fields is time consuming, daily imaging may still be used to gauge anatomical changes with respect to the pretreatment CT or MRI scan. When HT is combined with radiotherapy prior to HT, in-room imaging for radiotherapy patient positioning could be used for this. Otherwise, dedicated CT or CBCT imaging to assess anatomical changes prior to HT may be considered. To localize gastrointestinal gas, a low-dose kV (CB)CT scan would suffice. Especially for this patient group, any improvement of the HT is likely to outweigh any risk associated with additional imaging radiation dose.
However, as HT typically takes >1 h, anatomical changes including changes in GG location are likely to also take place during HT. No pretreatment imaging can account for changes on this time scale, although temperature calculations based on pretreatment imaging may help in assessing possible effects. In this work we have seen a correlation between GG volume and ΔT50 for patients with a large range in GG volume. Therefore, when the pretreatment planning CT or MRI displays a large volume of gastrointestinal gas, during treatment planning an estimate may be made of the effect when less GG is present during treatment by repeating calculations for a segmented scan with the gas replaced by tissue. How to mitigate effects on temperature of changes in GG relative to the planning CT, however, will be patient dependent. Changes in volume of GG may be less likely to occur during HT delivery, due to a general reluctance to pass gas in public. And while the location of GG may change over time, in general the regions where GG may be present remain the same; due to gravity combined with the configuration of bowels and stomach, gas is mostly found anterior and anterolateral to the pancreas, as seen in our (CB)CT scans. The largest impact of GG on the temperature distribution can therefore be expected to be in these regions.
4.1. Scope of this study
The four patients used in this study were selected, based on gastrointestinal gas volume, from a cohort of nine patients from a previous study [Citation40]. Of the nine patients, two displayed large differences in gas volume over the course of their 3-week radiotherapy; these were included in our set of four, resulting in a small but representative cohort suitable to investigate the effects of differences in GG on HT temperature distributions in patients with pancreatic cancer.
In clinical practice, when a patient presents with an increased volume of gas, this may (partially) coincide with a displacement rather than a replacement of tissue/matter. Our calculations assumed solely a replacement, with all surrounding anatomy remaining identical; this may have influenced the obtained results. Nevertheless, this study provides a useful first step in evaluating the possible impact of GG on temperature distributions.
Including organ displacement in the simulations is more challenging, since obtaining daily repeat-CT scans is not feasible and CBCT scans do not allow for HU-based tissue segmentation. A possible alternative approach would be to use deformable registration of CT to CBCT [Citation43]. However, (dis)appearing structures, such as pockets of GG, are very difficult to deal with by currently available commercial registration software, and special approaches are needed to prevent incorrect deformation of tissues surrounding (dis)appearing structures [Citation59]. Therefore, even though including actual daily anatomy would be preferable, this would be subject of additional research. However, the effect of displacement of the CTV on achieved ΔT50 is likely limited. Van der Horst et al. found a difference in tumor position between CT and CBCT ≤10 mm in 184 of 300 radiotherapy fractions (61%; 13 patients) with a maximum of 24.7 mm [Citation60]. Such displacements are small with respect to the ALBA-4D focus size of 15–20 cm, and would be associated with temperature differences of a few percent for locoregional HT devices [Citation61].
In our study, standard settings were used and no patient-specific plan optimization was applied. This enabled us to investigate differences in temperature distribution as a consequence of changes in gas, and these comparisons yield clinically relevant results. Although patient-specific treatment planning has shown potential to improve treatment quality [Citation58], standard clinical practice in the majority of hyperthermia centers is still the use of standard settings, i.e., equal amplitudes and standard phases to focus to the tumor location. The use of different antenna settings may yield different temperature distributions; however, as this paper focuses on the effect of a difference in GG on the difference in ΔT, rather than ΔT itself, the qualitative results of our work would not change.
Besides the volume of GG, also its location with respect to the target volume will be of influence on the temperature distribution. The pancreas is in close proximity to the stomach and colon, and even though this is where often a large proportion of present GG is located, the location of GG does change between fractions. This may have contributed to the observed differences in ΔT50 for similar GG volumes (). However, within this study we did not further investigate the influence of specific GG locations; this would be subject of further research. Our results will not only apply to pancreatic tumors, but also to other tumor sites in the same region (e.g., liver, duodenum). For pelvic tumors, though, the effect may be different; most GG is located in colon and stomach, which are both situated further away from the pelvis.
This study evaluated radiative locoregional heating, as often applied for pancreatic tumors. Calculations for capacitive heating devices, as also clinically applied for this patient group [Citation21,Citation31], were outside of the scope of this study. However, the relative effects of presence of and variations in gastrointestinal gas on temperature can be expected to be comparable.
4.2. Outlook
Hyperthermia treatment planning can be used to optimize temperature distributions and predict hot spot regions [Citation37]. Quantitatively accurate prediction of the entire temperature distribution in a patient, however, is currently unattainable [Citation33]. Therefore, to ensure adequate heating, and to enable accurate determination of thermal dose-effect relations, measuring the temperature obtained by HT remains essential and is prescribed in the Quality Assurance guidelines [Citation62]. For pancreatic tumors, placement of invasive thermometry in the pancreas itself is considered hazardous, but sensors placed in the duodenum around the pancreas can help assess tumor temperature [Citation23,Citation58]. Noninvasive thermometry using MRI can potentially yield 3 D temperature information for the entire heated region [Citation63–65]. However, motion artifacts arise in MR-thermometry images of abdominal sites including the pancreas, and although methods to resolve this issue are under development [Citation66–69], at present this remains a major issue.
In the ongoing HEATPAC trial, investigating concurrent thermochemoradiotherapy vs. chemoradiotherapy alone in locally advanced pancreatic cancer, prior to each HT session, a multi-sensor thermometry probe is endoscopically placed in the duodenal part encircling the pancreas for thermal mapping during treatment. Locoregional HT is delivered with a phased-array applicator [Citation23]. Such randomized studies are crucial in establishing the potential role of HT in pancreatic cancer treatment. A combined effort of patient imaging, patient-specific treatment planning and adequate temperature monitoring to assess the actual delivered thermal dose would enable optimization of clinical results.
5. Conclusions
The work presented here shows that the differences in volume and position of gastrointestinal gas as seen in pancreatic cancer patients can have a clinically relevant influence on the temperature distribution during locoregional HT delivery, with changes in ΔT50 for the clinical target volume of up to 0.6 °C. Differences in and displacement of gastrointestinal gas may also lead to differences in volume and location of high-temperature regions in normal tissue, and thus in the potential for hot spots.
Realization of an intended target temperature, sufficient for sensitization and optimal clinical outcome, will benefit from a combined effort of patient imaging, treatment planning and temperature monitoring.
Disclosure statement
No potential conflict of interest was reported by the author(s).
Additional information
Funding
References
- SEER database. [cited 2020 Oct 28]. Available from: https://seer.cancer.gov/statfacts/html/pancreas.html.
- Janssen QP, O'Reilly EM, van Eijck CHJ, et al. Neoadjuvant treatment in patients with resectable and borderline resectable pancreatic cancer. Front Oncol. 2020;10:41.
- Conroy T, Hammel P, Hebbar M, et al. FOLFIRINOX or Gemcitabine as adjuvant therapy for pancreatic cancer. N Engl J Med. 2018;379(25):2395–2406.
- Adamska A, Elaskalani O, Emmanouilidi A, et al. Molecular and cellular mechanisms of chemoresistance in pancreatic cancer. Adv Biol Regul. 2018;68:77–87.
- Seshacharyulu P, Baine MJ, Souchek JJ, et al. Biological determinants of radioresistance and their remediation in pancreatic cancer. Biochim Biophys Acta Rev Cancer. 2017;1868(1):69–92.
- Horsman MR, Overgaard J. Hyperthermia: a potent enhancer of radiotherapy. Clin Oncol (R Coll Radiol). 2007;19(6):418–426.
- Issels RD. Hyperthermia adds to chemotherapy. Eur J Cancer. 2008;44(17):2546–2554.
- Oei AL, Kok HP, Oei SB, et al. Molecular and biological rationale of hyperthermia as radio- and chemosensitizer. Adv Drug Deliv Rev. 2020;163-164:84–97.
- van Rhoon GC, Franckena M, Ten Hagen TLM. A moderate thermal dose is sufficient for effective free and TSL based thermochemotherapy. Adv Drug Deliv Rev. 2020;163-164:145–156.
- Issels RD, Lindner LH, Verweij J, European Organization for the Research and Treatment of Cancer-Soft Tissue and Bone Sarcoma Group and the European Society for Hyperthermic Oncology, et al. Effect of neoadjuvant chemotherapy plus regional hyperthermia on long-term outcomes among patients with localized high-risk soft tissue sarcoma: The EORTC 62961-ESHO 95 Randomized Clinical Trial. JAMA Oncol. 2018;4(4):483–492.
- Colombo R, Salonia A, Leib Z, et al. Long-term outcomes of a randomized controlled trial comparing thermochemotherapy with mitomycin-C alone as adjuvant treatment for non-muscle-invasive bladder cancer (NMIBC). BJU Int. 2011;107(6):912–918.
- Liem EIML, Crezee H, de la Rosette JJ, et al. Chemohyperthermia in non-muscle-invasive bladder cancer: An overview of the literature and recommendations. Int J Hyperthermia. 2016;32(4):363–373.
- Arends TJH, Nativ O, Maffezzini M, et al. Results of a randomised controlled trial comparing intravesical chemohyperthermia with mitomycin C versus bacillus Calmette-Guérin for adjuvant treatment of patients with intermediate- and high-risk non–muscle-invasive bladder cancer. Eur Urol. 2016;69(6):1046–1052.
- Franckena M, Fatehi D, de Bruijne M, et al. Hyperthermia dose-effect relationship in 420 patients with cervical cancer treated with combined radiotherapy and hyperthermia. Eur J Cancer. 2009;45(11):1969–1978.
- Kroesen M, Mulder HT, van Holthe JML, et al. Confirmation of thermal dose as a predictor of local control in cervical carcinoma patients treated with state-of-the-art radiation therapy and hyperthermia. Radiother Oncol. 2019;140:150–158.
- Bakker A, van der Zee J, van Tienhoven G, et al. Temperature and thermal dose during radiotherapy and hyperthermia for recurrent breast cancer are related to clinical outcome and thermal toxicity: a systematic review. Int J Hyperthermia. 2019;36(1):1024–1039.
- Cihoric N, Tsikkinis A, van Rhoon G, et al. Hyperthermia-related clinical trials on cancer treatment within the ClinicalTrials.gov registry. Int J Hyperthermia. 2015;31(6):609–614.
- Datta NR, Gómez Ordóñez S, Gaipl US, et al. Local hyperthermia combined with radiotherapy and-/or chemotherapy: Recent advances and promises for the future. Cancer Treat Rev. 2015;41(9):742–753.
- Ohguri T, Imada H, Yahara K, et al. Concurrent chemoradiotherapy with gemcitabine plus regional hyperthermia for locally advanced pancreatic carcinoma: initial experience. Radiat Med. 2008;26(10):587–596.
- Maluta S, Schaffer M, Pioli F, et al. Regional hyperthermia combined with chemoradiotherapy in primary or recurrent locally advanced pancreatic cancer : an open-label comparative cohort trial. Strahlenther Onkol. 2011;187(10):619–625.
- van der Horst A, Versteijne E, Besselink MGH, et al. The clinical benefit of hyperthermia in pancreatic cancer: a systematic review. Int J Hyperthermia. 2018;34(7):969–979.
- He M, Sun J, Zhao D, et al. Modified-FOLFIRINOX combined with deep regional hyperthermia in pancreatic cancer: a retrospective study in Chinese patients. Int J Hyperthermia. 2019;36(1):394–402.
- Datta NR, Pestalozzi B, Clavien P-A, members of the HEATPAC Trial Group, et al. "HEATPAC" - a phase II randomized study of concurrent thermochemoradiotherapy versus chemoradiotherapy alone in locally advanced pancreatic cancer”. Radiat Oncol. 2017;12(1):183.
- Issels RD. 2012. Hyperthermia European Adjuvant Trial (HEAT). ClinicalTrials.gov. Identifier: NCT01077427. [cited 2020 Jun 7]. Available from: https://clinicaltrials.gov/ct2/show/NCT01077427.
- Helderman R, Löke DR, Verhoeff J, et al. The temperature-dependent effectiveness of platinum-based drugs Mitomycin-C and 5-FU during hyperthermic intraperitoneal chemotherapy (HIPEC) in colorectal cancer cell lines. Cells. 2020;9(8):1775.
- Urano M, Ling CC. Thermal enhancement of melphalan and oxaliplatin cytotoxicity in vitro. Int J Hyperthermia. 2002;18(4):307–315.
- Sapareto SA, Dewey WC. Thermal dose determination in cancer therapy. Int J Radiat Oncol Biol Phys. 1984;10(6):787–800.
- van den Tempel N, Laffeber C, Odijk H, et al. The effect of thermal dose on hyperthermia-mediated inhibition of DNA repair through homologous recombination. Oncotarget. 2017;8(27):44593–44604.
- Dewhirst MW, Vujaskovic Z, Jones E, et al. Re-setting the biologic rationale for thermal therapy. Int J Hyperthermia. 2005;21(8):779–790.
- Frey B, Weiss E-M, Rubner Y, et al. Old and new facts about hyperthermia-induced modulations of the immune system. Int J Hyperthermia. 2012;28(6):528–542.
- Kok HP, Cressman ENK, Brace CL, et al. Heating technology for malignant tumors: a review. Int J Hyperthermia. 2020;37(1):711–741.
- Kok HP, Wust P, Stauffer PR, et al. Current state of the art of regional hyperthermia treatment planning: a review. Radiat Oncol. 2015;10:196.
- Kok HP, Ciampa S, de Kroon-Oldenhof R, et al. Toward online adaptive hyperthermia treatment planning: Correlation between measured and simulated specific absorption rate changes caused by phase steering in patients. Int J Radiat Oncol Biol Phys. 2014;90(2):438–445.
- van Haaren PMA, Kok HP, van den Berg CAT, et al. On verification of hyperthermia treatment planning for cervical carcinoma patients. Int J Hyperthermia. 2007;23(3):303–314.
- Bellizzi GG, Drizdal T, van Rhoon GC, et al. Predictive value of SAR based quality indicators for head and neck hyperthermia treatment quality. Int J Hyperthermia. 2019;36(1):455–4647.
- Kok HP, van Haaren PMA, van de Kamer JB, et al. High-resolution temperature-based optimization for hyperthermia treatment planning. Phys Med Biol. 2005;50(13):3127–3141.
- Kok HP, Korshuize-van Straten L, Bakker A, et al. Online adaptive hyperthermia treatment planning during locoregional heating to suppress treatment-limiting hot spots. Int J Radiat Oncol Biol Phys. 2017;99(4):1039–1047.
- Franckena M, Canters R, Termorshuizen F, et al. Clinical implementation of hyperthermia treatment planning guided steering: a cross over trial to assess its current contribution to treatment quality. Int J Hyperthermia. 2010;26(2):145–157.
- Li Y, Hoisak JDP, Li N, et al. Dosimetric benefit of adaptive re-planning in pancreatic cancer stereotactic body radiotherapy. Med Dosim. 2015;40(4):318–324.
- van der Horst A, Houweling AC, van Tienhoven G, et al. Dosimetric effects of anatomical changes during fractionated photon radiation therapy in pancreatic cancer patients. J Appl Clin Med Phys. 2017;18(6):142–151.
- Houweling AC, Fukata K, Kubota Y, et al. The impact of interfractional anatomical changes on the accumulated dose in carbon ion therapy of pancreatic cancer patients. Radiother Oncol. 2016;119(2):319–325.
- Kok HP, Kotte ANTJ, Crezee J. Planning, optimisation and evaluation of hyperthermia treatments. Int J Hyperthermia. 2017; 33(6):593–607.
- Veiga C, McClelland J, Moinuddin S, et al. Toward adaptive radiotherapy for head and neck patients: feasibility study on using CT-to-CBCT deformable registration for "dose of the day" calculations. Med Phys. 2014;41(3):031703.
- Bol GH, Kotte AN, van der Heide UA, et al. Simultaneous multi-modality ROI delineation in clinical practice. Comput Methods Programs Biomed. 2009;96(2):133–140.
- Zweije R, Kok HP, Bakker A, et al. Technical and clinical evaluation of the ALBA-4D 70MHz loco-regional hyperthermia system. 48th European Microwave Conference (EuMC). 2018; Madrid. p. 328–331.
- Crezee J, van Haaren PM, Westendorp H, et al. Improving locoregional hyperthermia delivery using the 3-D controlled AMC-8 phased array hyperthermia system: a preclinical study. Int J Hyperthermia. 2009;25(7):581–592.
- Kok HP, de Greef M, Borsboom PP,.org/10.3, et al. Improved power steering with double and triple ring waveguide systems: the impact of the operating frequency. Int J Hyperthermia. 2011;27(3):224–239.
- Pennes HH. Analysis of tissue and arterial blood temperatures in the resting human forearm. J Appl Physiol. 1948;1(2):93–122.
- Moritz AR, Henriques FC. Studies of thermal injury: II. The relative importance of time and surface temperature in the causation of cutaneous burns. Am J Pathol. 1947;23(5):695–720.
- Stoll AM, Greene LC. Relationship between pain and tissue damage due to thermal radiation. J Appl Physiol. 1959;14(3):373–382.
- Bakker A, Kolff MW, Holman R, et al. Thermal skin damage during reirradiation and hyperthermia is time-temperature dependent. Int J Radiat Oncol Biol Phys. 2017;98(2):392–399.
- Core Team R. R: A language and environment for statistical computing. Vienna: R Foundation for Statistical Computing; 2015. Available from: http://www.R-project.org/
- Hendifar AE, Petzel MQB, Zimmers TA, Precision Promise Consortium, et al. Pancreas cancer-associated weight loss. Oncologist. 2019;24(5):691–701.
- Okura T, Fujii M, Shiode J, et al. Impact of body mass index on survival of pancreatic cancer patients in Japan. Acta Med Okayama. 2018;72(2):129–135.
- Crezee H, van Leeuwen CM, Oei AL, et al. Thermoradiotherapy planning: integration in routine clinical practice. Int J Hyperthermia. 2016;32(1):41–49.
- Yarmolenko PS, Moon EJ, Landon C, et al. Thresholds for thermal damage to normal tissues: an update. Int J Hyperthermia. 2011;27(4):320–343.
- Wust P, Nadobny J, Seebass M, et al. Influence of patient models and numerical methods on predicted power deposition patterns. Int J Hyperthermia. 1999;15(6):519–540.
- Kok HP, de Kroon-Oldenhof R, Korshuize-van Straten L, et al. RF heating of pancreatic tumours guided by hyperthermia treatment planning and limited thermometry. 48th European Microwave Conference (EuMC). 2018. Madrid:332–335.
- Alderliesten T, Sonke J-J, Bosman PAN. Deformable image registration by multi-objective optimization using a dual-dynamic transformation model to account for large anatomical differences. Proc. of SPIE. 2013;8669:866910.
- van der Horst A, Wognum S, Dávila Fajardo R, et al. Interfractional position variation of pancreatic tumors quantified using intratumoral fiducial markers and daily cone beam computed tomography. Int J Radiat Oncol Biol Phys. 2013;87(1):202–208.
- Canters RA, Franckena M, Paulides MM, et al. Patient positioning in deep hyperthermia: influences of inaccuracies, signal correction possibilities and optimization potential. Phys Med Biol. 2009;54(12):3923–3936.
- Bruggmoser G, Bauchowitz S, Canters R, et al. Guideline for the clinical application, documentation and analysis of clinical studies for regional deep hyperthermia: quality management in regional deep hyperthermia. Strahlenther Onkol. 2012;188(S2):198–211.
- Gellermann J, Hildebrandt B, Issels R, et al. Noninvasive magnetic resonance thermography of soft tissue sarcomas during regional hyperthermia: correlation with response and direct thermometry. Cancer. 2006;107(6):1373–1382.
- Lüdemann L, Wlodarczyk W, Nadobny J, et al. Non-invasive magnetic resonance thermography during regional hyperthermia. Int J Hyperthermia. 2010;26(3):273–282.
- Adibzadeh F, Sumser K, Curto S, et al. Systematic review of pre-clinical and clinical devices for magnetic resonance-guided radiofrequency hyperthermia. Int J Hyperthermia. 2020;37(1):15–27.
- Wu M, Mulder HT, Baron P, et al. Correction of motion-induced susceptibility artifacts and B0 drift during proton resonance frequency shift-based MR thermometry in the pelvis with background field removal methods. Magn Reson Med. 2020;84(5):2495–2511.
- Wu M, Mulder HT, Zur Y, et al. A phase-cycled temperature-sensitive fast spin echo sequence with conductivity bias correction for monitoring of mild RF hyperthermia with PRFS. MAGMA. 2019;32(3):369–380.
- Kothapalli SVVN, Altman MB, Zhu L, et al. Evaluation and selection of anatomic sites for magnetic resonance imaging-guided mild hyperthermia therapy: a healthy volunteer study. Int J Hyperthermia. 2018;34(8):1381–1389.
- Winter L, Oberacker E, Paul K, et al. Magnetic resonance thermometry: methodology, pitfalls and practical solutions. Int J Hyperthermia. 2016;32(1):63–75.