
 ?Mathematical formulae have been encoded as MathML and are displayed in this HTML version using MathJax in order to improve their display. Uncheck the box to turn MathJax off. This feature requires Javascript. Click on a formula to zoom.
Abstract
Purpose
To assess the effect of intracardiac blood flow pulsatility on tissue and blood distributions during radiofrequency (RF) cardiac ablation (RFCA).
Methods
A three-dimensional computer model was used to simulate constant power ablations with an irrigated-tip electrode and three possible catheter orientations (perpendicular, parallel and 45°). Continuous flow and three different pulsatile flow profiles were considered, with four average blood velocity values: 3, 5.5, 8.5 and 24.4 cm/s. The 50 °C contour was used to assess thermal lesion size.
Results
The differences in lesion size between continuous flow and the different pulsatile flow profiles were always less than 1 mm. As regards maximum tissue temperature, the differences between continuous and pulsatile flow were always less than 1 °C, with slightly higher differences in maximum blood temperature, but never over 6 °C. While the progress of maximum tissue temperature was identical for continuous and pulsatile flow, maximum blood temperature with the pulsatile profile showed small amplitude oscillations associated with blood flow pulsatility.
Conclusions
The findings show that intracardiac blood pulsatility has a negligible effect on lesion size and a very limited impact on maximum tissue and blood temperatures, which suggests that future experimental studies based on ex vivo or in silico models can ignore pulsatility in intracardiac blood flow.
1. Introduction
Ex vivo [Citation1,Citation2] and computer [Citation3–7] models are broadly employed to study different technical issues involved in radiofrequency (RF) cardiac ablation (RFCA). During percutaneous RFCA (i.e. with the active electrode placed on the endocardium) the intracardiac blood flow evacuates heat through the electrode-blood and endocardium-blood interfaces. To the best of our knowledge, and despite the fact that the intracardiac blood flow pattern is markedly pulsatile [Citation8,Citation9], all the previous computer models considered a continuous and constant flow of circulating blood. Few previous ex vivo studies have considered pulsatile flow [Citation10–12] and none compared pulsatile and continuous flow but rather pulsatile versus no-flow. To set up the pulsatile flow they also used a roller pump, which is known to be incapable of generating a real physiological flow, and in fact can only be done by complex pumping systems [Citation13,Citation14].
Obviously, clinical studies and those based on in vivo models did take pulsatility into account, as it is inherent to the heartbeat. Since this type of study does not make it possible to keep all the process variables under control (unlike ex vivo and computer studies), the relationship between flow pulsatility and tissue temperature distribution cannot be established. Our objective was thus to use a computer model to assess the effect of considering different blood flow pulsatile profiles (equivalent to those physiological profiles) on temperature distributions and the thermal lesions created in the cardiac tissue by comparing them with the continuous blood flow case. The results of this study are expected to contribute to the information available on the thermal effect of intracardiac blood flow pulsatilty on the thermal lesion created during RFCA, and also perhaps on future ex vivo or computational studies in which blood flow has a relevant thermal impact.
2. Methods
2.1. Model geometry
We used a three-dimensional computer model previously described in [Citation15], which was particularly indicated for our objective as it includes the fluid dynamics problem associated with the movement of intracardiac blood in addition to the electrical and thermal problem. In short, the model consisted of a fragment of cardiac tissue, a volume of blood and a ThermoCool SF active irrigated-tip electrode (Biosense Webster, Diamond Bar, CA, USA), as usually employed in RFCA (see ). The dispersive electrode was modeled as an electrical boundary condition (0 V) on the bottom surface of the cardiac tissue. The holes in the irrigated-tip electrode were not included in the geometry because they require a very fine mesh, which would unnecessarily increase the computational cost. The optimum mesh size at the electrode-tissue interface (0.2 mm) was verified by a convergence test, along with the outer dimensions [Citation15]. The active electrode (in the catheter tip) had an 8 Fr diameter, 3.5 mm length, and 56 small holes on its surface to allow the saline solution to continuously flow outward and mix easily with the blood, due to their similar densities. The effect of saline irrigation was modeled as a flow inlet velocity boundary condition to the blood volume on the electrode surface where the holes are located (see violet surface in ) [Citation15]. As keeping the catheter perpendicular during RFCA is no easy task for the operator due to its length and the beating heart, we considered three catheter positions: perpendicular (as shown in ), parallel and 45°.
Figure 1. Geometry of the computational model with the catheter in perpendicular position (out of scale). Tissue and blood model dimensions (taken from [Citation15]): X = 80 mm, Y = Z = 40 mm, C = 20 mm. Note that XZ-plane is the symmetry plane in the model. The active electrode mimics the multi-holes open-irrigated electrode ThermoCool R SF (Biosense Webster, Diamond Bar, CA, USA). The saline irrigation through the small holes in the electrode-tip is modeled by an inlet velocity boundary condition at the electrode-blood interface. Thermal lesion is assessed by the 50 °C isotherm and its geometry is characterized by: maximum depth (D), maximum width (MW), surface width (SW) and depth at the maximum width (DW) [Citation15].
![Figure 1. Geometry of the computational model with the catheter in perpendicular position (out of scale). Tissue and blood model dimensions (taken from [Citation15]): X = 80 mm, Y = Z = 40 mm, C = 20 mm. Note that XZ-plane is the symmetry plane in the model. The active electrode mimics the multi-holes open-irrigated electrode ThermoCool R SF (Biosense Webster, Diamond Bar, CA, USA). The saline irrigation through the small holes in the electrode-tip is modeled by an inlet velocity boundary condition at the electrode-blood interface. Thermal lesion is assessed by the 50 °C isotherm and its geometry is characterized by: maximum depth (D), maximum width (MW), surface width (SW) and depth at the maximum width (DW) [Citation15].](/cms/asset/2ea24765-8ba1-4e6c-9a8f-97d56e70bfb8/ihyt_a_1890240_f0001_c.jpg)
2.2. Governing equations
The model solved a coupled electric-thermal-flow problem using the Finite Element Method (FEM) with COMSOL Multiphysics software (COMSOL, Burlington, MA, USA). At RF heating frequencies (∼500 kHz) and over the distance of interest, the biological medium can be considered almost totally resistive, so that a quasi-static approach was used to solve electrical problem [Citation16], whose governing equation was:
(1)
(1)
where
is voltage (V),
electrical field vector (V/m) and σ electrical conductivity (S/m). From EquationEquation (1)
(1)
(1) , the distributed heat source is given by
which was later used in the thermal problem as distributed heat source. The governing equation for the thermal problem was the Bioheat equation [Citation15]:
(2)
(2)
where ρ is density (kg/m3), c specific heat (J/kg·K), T temperature (°C), t time (s), k thermal conductivity (W/m·K), QP heat loss caused by blood perfusion (W/m3) and QM metabolic heat generation (W/m3). QP was neglected as blood flow from the coronary arteries does not have significant impact on the temperature distribution [Citation17], while QM was is also insignificant in comparison to the rest of the terms [Citation18]. The last term of EquationEquation (2)
(2)
(2) is the heat loss due to blood motion. The velocity field
(m/s) was described by the incompressible Navier-Stokes Equations of fluid dynamics, comprised of the momentum (EquationEquation (3)
(3)
(3) ) and mass (EquationEquation (4)
(4)
(4) ) equations:
(3)
(3)
(4)
(4)
where P is pressure (Pa), µ blood viscosity (2.1 × 10⁻³ kg/m·s [Citation15]) and F body forces (N/m3), neglected in our model.
2.3. Material properties
shows the properties of the model materials [Citation19,Citation20]. Tissue thermal conductivity (k) was assumed to be constant with temperature since it has been observed that its change with temperature does not have a significant effect on thermal lesions in computer modeling [Citation21]. In contrast, the electrical conductivity (σ) value was assumed to be temperature-dependent with a change of +1.5%/°C [Citation15]. The temperature dependence of specific heat was not considered since it has been experimentally observed that it changes at temperatures over 65 °C and is presumably related to tissue water loss [Citation22,Citation23]. In fact, the relationship between specific heat and temperature is usually only taken into account in computer modeling studies when the tissue reaches 100 °C. The latent heat associated with vaporization is usually modeled as an artificially increased specific heat value in a small temperature range (for example 99 to 100 °C). In our study, as a low power level was deliberately chosen to prevent maximum tissue temperatures from reaching 100 °C, we decided not to include the latent heat of tissue (and therefore any change of specific heat with temperature) or model the sudden drop in σ due to desiccation. The change of specific heat below 100 °C does not seem to be large enough to be considered in modeling studies.
Table 1. Properties of the model materials [Citation19,Citation20].
2.4. Boundary conditions
shows the boundary conditions applied to the model. For the electrical conditions (), a constant power of 9 W, defined as a terminal boundary condition, was applied at the active electrode for 30 s. This condition is specific to COMSOL and means total power can be kept constant throughout the ablation by varying the voltage applied to the electrode in each time-step. The 9 W value is lower than those normally used in clinical practice (∼20 W) but was selected for two reasons: 1) the computer model only included a fragment of the patient’s torso [Citation24,Citation25], and 2) to avoid tissue temperatures close to 100 °C. Note that the power value was not relevant in the context of this study, since the objective was not to reproduce the real conditions of a clinical scenario, but to compare the computed temperature distributions between continuous and pulsatile blood flow. The dispersive electrode was simulated as a 0 V boundary condition on the bottom surface of the model, and a null electrical current condition was set on the other outer boundaries.
Figure 2. Electrical (A) and thermal and blood flow (B) boundary conditions.
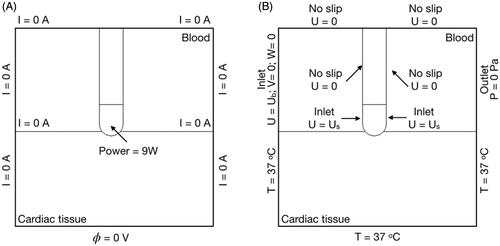
shows the thermal and fluid flow boundary conditions. A null thermal flux was set on the symmetry plane and a constant temperature of 37 °C was set at the outer boundaries. The blood flow was simulated as a velocity inlet condition on the left blood surface and a zero pressure outlet condition on the opposite fluid wall. As with the velocity boundary conditions, saline irrigation was modeled as a velocity inlet condition on the electrode-blood surface. This velocity was calculated as the ratio between the saline irrigation flow rate and the electrode area through which the saline effect was applied. Saline irrigation flow rate was considered to be 8 ml/min, as the clinical value recommended by the manufacturer for multi-hole electrodes [Citation15]. Note that when the catheter orientation was modified, the electrode area in contact with the tissue was also changed and the velocity inlet condition at the electrode surface was accordingly recalculated. Three catheter orientations were considered: perpendicular, 45° and parallel, so that the electrode areas in which the saline irrigation boundary condition was applied were 12.42 mm2, 12.26 mm2 and 10.86 mm2, respectively. The saline irrigation velocities were perpendicular 12.28 mm/s, 45° 10.88 mm/s and parallel 10.74 mm/s. A no-slip condition was applied on the upper surfaces of the fluid volume, on the symmetry plane and the tissue-blood and electrode-blood interfaces [Citation15].
2.5. Modeling intracardiac blood flow pulsatility
Previous RFCA computer modeling studies used a range of blood velocity values: 3, 5.5, 8.5 and 24.4 cm/s [Citation4–7]. We first conducted simulations considering these four constant blood velocity values, i.e. mimicking continuous flow, and then other simulations considering three different pulsatile profiles (P1, P2 and P3), which always had the same average values as those used in the continuous flow simulations. All the cases were simulated for the perpendicular, 45° and parallel catheter orientations. The effect of changing the blood flow direction was also assessed for the 45° and parallel positions, which in practical terms means that five catheter orientations were really considered: 0° (parallel), 45°, 90° (perpendicular), 135° and 180° (parallel).
Since atrial fibrillation RFCA is a common procedure, we considered blood flow profiles measured in the pulmonary vein ostium, which is a common target. Intracardiac blood flow has recently been studied by means of pulsed Doppler, 2 D echocardiography, and more recently, 4 D cardiac magnetic resonance imaging (4 D CMR). A biphasic wave profile has been observed in the left atrium (see ) related to the systolic phase with the mitral valve closed, and the second flow wave is that of the diastole during rapid mitral flow ventricle filling [Citation8,Citation9]. As the mitral valve blood velocity profile also consists of a biphasic wave, the left atrial blood profile thus clearly follows a pulsatile profile. Keren et al. [Citation8] showed that the first peak (J wave) maximum of the pulmonary vein blood flow profile was 44.5 ± 10.3 cm/s, while the second peak (K wave) was 53 ± 15 cm/s in healthy patients. We mathematically simplified the waveforms associated with the real blood flow profile and modeled them as sine waves (see ).
Figure 3. Intracardiac blood flow dynamics (taken from [Citation8] with permission from Wolters Kluwer Health, Inc). The electrocardiogram (ECG) is displayed on the top part of the image. Underneath, three different blood flow profiles are shown: pulmonary artery blood flow (PAF), pulmonary vein blood flow (PVF) and mitral valve blood flow (MVF).
![Figure 3. Intracardiac blood flow dynamics (taken from [Citation8] with permission from Wolters Kluwer Health, Inc). The electrocardiogram (ECG) is displayed on the top part of the image. Underneath, three different blood flow profiles are shown: pulmonary artery blood flow (PAF), pulmonary vein blood flow (PVF) and mitral valve blood flow (MVF).](/cms/asset/43691edb-7b58-40c4-bd4c-f81990c20c98/ihyt_a_1890240_f0003_b.jpg)
Figure 4. Simplified mathematical functions (zoom of the first 5 s) used to simulate the blood flow pulsatile profiles (see text for more details) for a mean velocity of 8.5 cm/s.
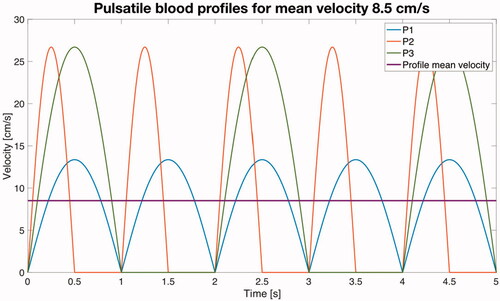
The first pulsatile profile (P1) consisted of an absolute value of a sinusoid wave, i.e. where A is the peak value, t is time and f the frequency of the cardiac rhythm. In the context of electrical engineering this waveform is a full wave rectified sine wave. We assumed f = 1 Hz, which is equivalent to a heart rate of 60 beats per minute (bpm). In order to compare the use of a continuous blood velocity value vs. a pulsatile profile under equal conditions, the value of A was chosen so that the waveform associated with the pulsatile profile had an average value (Vavg) equivalent to the continuous value. Since the average value of an absolute value of a sinusoid wave can be calculated as
(5)
(5)
we can obtain the peak value A associated with each average value. For instance, for a continuous value of 8.5 cm/s, the peak value of the waveform associated with the P1 profile will be A = 8.5/0.636 = 13.37 cm/s (see blue line in ).
As suggested in , the pulses are not strictly consecutive, but there is a null flow period between them. Taking this into consideration, we simulated a second profile (P2) which consisted of a sinusoid wave in which the negative semi-period is null (in electrical engineering this waveform is a half wave rectified sine wave). The frequency of P2 was the same as P1. The relation between the average value of a half wave rectified sine wave and its peak value is Vavg = 0.318·A. For instance, for a continuous value of 8.5 cm/s, the peak value of the waveform associated with the P2 profile will be A = 8.5/0.318 = 26.73 cm/s (see red line in ). The third profile P3 was identical to P2 but with f = 0.5 Hz, which would be equivalent to a 30 bpm heart rate. The relation between average and peak values is the same as in P2 (see line green in ).
2.6. Lesion assessment and criterion for comparative analysis
As thermal myocardium lesions are produced once the tissue temperature reaches ∼50 °C, the 50 °C contour was used to assess thermal lesion size. The lesion geometry was characterized by the following parameters (see ): maximum depth (D), maximum width (MW), depth at the maximum width (DW) and surface width (SW). The maximum temperature reached in the blood and cardiac tissue was also assessed. Differences in lesion depth and width were assumed to be insignificant for values lower than 1 mm, since this value is approximately that of the deviation (±0.5 mm) observed in experimental RFCA studies. Likewise, the differences in maximum tissue or blood temperatures were considered to be insignificant for values lower than 4 °C, since this is approximately the value of the observed deviation (±2 °C) [Citation7].
We also conducted a statistical comparison of the values of maximum temperature reached in tissue and blood of the continuous and pulsatile flows, including all the cases: the four different average values of blood flow (3, 5.5, 8.5 and 24.4 cm/s) and five different catheter orientations (0°, 45°, 90°, 135° and 180°), i.e. a total of 20 cases for each blood flow profile (continuous, P1, P2 and P3). T-tests were conducted on paired samples to assess the similarity between continuous and pulsatile blood flows on average (null hypothesis). The normality of each data set was first checked by the Kolmogorov-Smirnov test.
3. Results
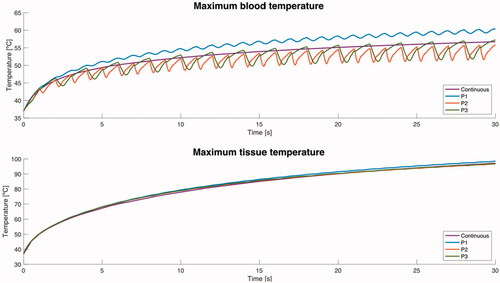
shows the evolution of the maximum tissue and blood temperature during ablation for the different blood flow profiles (average value 8.5 cm/s) with perpendicular catheter. Similar results were obtained for the other positions and velocities (results not shown). We found that the maximum tissue temperature evolved to a more or less stationary state with hardly any fluctuations and behaved similarly in all the blood flow profiles. In contrast, the maximum blood temperature fluctuated at the same frequency as the pulsatile blood profile (obviously with no fluctuations for the continuous profile). Interestingly, maximum blood temperature in the P1 profile always stayed ∼4 °C higher than in the continuous profile, while it was generally lower in profiles P2 and P3 than in the continuous profile (0–5 °C).
Figure 5. Evolution of the maximum value of temperature in tissue and blood during ablation for the different blood flow profiles (average value 8.5 cm/s) with perpendicular orientation.
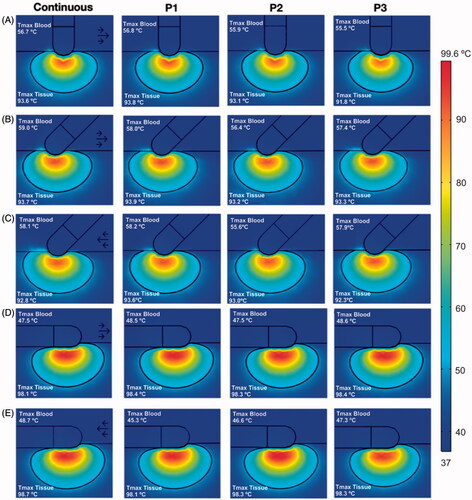
shows the temperature distributions after 30 s of RFCA for continuous flow and the three different pulsatile profiles with an average velocity of 8.5 cm/s. As expected, maximum temperature in the cardiac tissue always stayed lower than 100 °C, while maximum blood temperature was always lower than 80 °C. The shape of thermal lesions created in the cardiac tissue was almost identical for all three pulsatile profiles and continuous flow, suggesting that blood flow pulsatility has little influence on lesion shape. Although the plots of the other blood velocities (3, 5.5 and 24.4 cm/s) are not shown, the general behavior was the same.
Figure 6. Temperature distributions after 30 s of RFCA with a constant power of 9 W for different catheter orientations: perpendicular (A), 45° with blood flow from left to right (B), 45° with blood flow from right to left –opposed– (C), parallel with blood flow from left to right (D), and parallel with blood flow from right to left – opposed – (E). The solid black line shows the 50 °C isotherm. Each plot shows the maximum temperature reached in blood and tissue (Tmax Blood and Tmax Tissue). The plots correspond to the case of 8.5 cm/s for continuous blood flow (first column), and pulsatile blood flow profiles (P1, P2 and P3, see text for more details). Scale in °C.
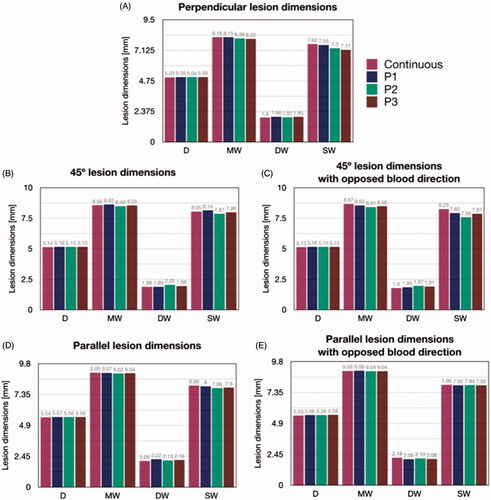
shows the lesion dimensions of the cases in . The maximum depth (D) was practically identical for the different blood flow profiles, regardless of catheter orientation, with a maximum difference of ∼0.5 mm between parallel and perpendicular, so that the differences in lesion depth between continuous or pulsatile blood velocity were negligible (<1 mm). The differences were also insignificant in terms of maximum width (MW) and depth at the maximum width (DW), regardless of catheter orientation, and were always smaller than 0.2 mm. The biggest differences (up to 0.5 mm) in terms of SW were found between continuous flow and the P3 profile at 45° orientation. There was an overall tendency to achieve wider surface lesions at 45° and parallel orientations, compared to than perpendicular orientation. In general, these results confirm that intracardiac blood pulsatility has very little effect on lesion dimensions, as the differences between continuous and pulsatile flow were always lower than 1 mm and the orientation of the blood flow did not have a significant influence on lesion size.
Figure 7. Lesion dimensions (in mm) after 30 s 9 W RFCA for different catheter orientations (A: perpendicular, B: 45°, C: 45° with opposite blood flow direction, D: parallel, E: parallel with opposite blood flow direction) and for different blood velocity profiles (continuous, P1, P2 and P3, all with an average value of 8.5 cm/s) (see text for more details). D: maximum depth; MW: Maximum width; DW: Depth at the maximum width; SW: Surface width.
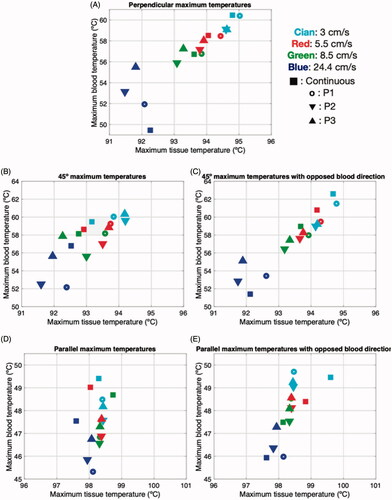
shows the maximum tissue and blood temperatures for the different catheter orientations, average blood velocity and blood flow profiles. In general, the dispersion associated with blood velocity changes was greater in the maximum blood temperature than in the maximum tissue temperature, with little apparent correlation between the variables involved. Regarding the maximum tissue temperature, the differences between using continuous and pulsatile flow were always less than 1 °C, for any average velocity value and regardless of catheter orientation. There were small differences in the maximum blood temperature for continuous or pulsatile flow, with values of up to ∼6 °C for perpendicular and ∼2 °C for parallel (both with a high average velocity, 24 cm/s), showing that the effect of pulsatility on maximum temperatures in tissue and blood is generally very weak.
Figure 8. Maximum temperatures in blood and cardiac tissue after 30 s of RFCA with 9 W for different catheter orientations (A: perpendicular, B: 45°, C: 45° with opposite blood flow direction, D: parallel, E: parallel with opposite blood flow direction), average values of blood velocity (3, 5.5, 8.5 and 24.4 cm/s), and profiles of blood flow (continuous, P1, P2 and P3).
In the comparison of the maximum temperature reached in tissue and blood of the continuous and pulsatile flows, the Kolmogorov-Smirnov tests provided p-values higher than 0.45, so that we concluded that the data did not differ significantly from a normal distribution. The t-test results showed no statistically significant differences between the continuous and pulsatile flows, except for the blood temperature computed with the P2 profile (p = .008).
4. Discussion
Our aim was to study by means of computer modeling the effect of intracardiac blood flow pulsatility on the thermal lesion created during RFCA. Since past ex in vivo and computer models had considered only continuous flow, our objective was relevant to answer the question: How important is it to consider a pulsatile flow in these models? To address this question we used a previously presented computational model [Citation15] and implemented different representative pulsatility intracardiac blood flow profiles. When we compared the results with those obtained from a continuous flow, we did not find any significant differences, either in lesion size (see ) or in maximum temperatures reached in tissue and blood (see and ). Only the maximum temperature in the blood, which could have implications for the formation of thrombi, showed differences of up to 6 °C between pulsed vs. continuous flow. These differences were generally greater between the continuous flow and the P2 profile, which was possibly the cause of the non-similarity of average values in the t-test.
While the evolution of the maximum blood temperature during RFCA did show fluctuations according to flow pulsatility (see ), the maximum tissue temperature did not fluctuate, which was probably why the lesions were nearly identical both with and without pulsatility. Even if fluctuations had appeared in the maximum tissue temperature, a recent study in which the RF power excitation was deliberately oscillated (with a frequency similar to that set here for flow pulsatility) showed that although fluctuations appear in maximum tissue and blood temperatures, lesion size does not seem to be affected [Citation26]. Although it may not seem so in theory, both studies do have a relationship, since both blood flow and RF power are heat exchange mechanisms during RFCA.
Although we only considered 30-s ablations, our temperature progress results () show that the differences between continuous and pulsatile flow in terms of maximum tissue and blood temperature are also negligible during the first seconds of ablation, suggesting that the pulsatility effect can also be ignored in high-power short-duration ablations, such as those recently conducted to treat atrial fibrillation [Citation27].
Although our results do not seem to have a clinical impact in terms of changing the current ablation strategies, they do indicate that future experimental studies based on ex vivo or in silico models should not have to implement intracardiac blood flow pulsatility, which would be an advantage in simplifying the setup.
4.1. Limitations of the study
We used the 50 °C isotherm to estimate the thermal damage contour. Although other methods such as the Arrhenius function have been used in studies in which pulsed RF power was applied [Citation26], the insignificant differences in terms of tissue temperature found between continuous vs. pulsatile blood flow suggest that the conclusions would still be valid when using the Arrhenius function. Likewise, although we only modeled an irrigated electrode with a specific geometry and size, there do not appear to be any physical reasons to suggest that the conclusions will be different for a different electrode.
5. Conclusions
The computer results obtained seem to indicate that intracardiac blood flow pulsatility has no significant impact either on lesion size or on the maximum temperature reached in the tissue. Variations of up to 6 °C can be found in maximum blood temperature only under specific condition when considering or ignoring blood flow pulsatility. Our findings suggest that in future experimental studies based on ex vivo models a continuous flow created by a standard roller or centrifuge pump should be able to mimic a realistic pulsatile flow and would not require complex pumping systems. Likewise, future computer modeling studies would not need to include pulsatility of blood flow.
Disclosure statement
The authors have no conflicts of interest or financial disclosures to make relevant to this submission.
Additional information
Funding
References
- Jain MK, Wolf PD. In vitro temperature map of cardiac ablation demonstrates the effect of flow on lesion development. Ann Biomed Eng. 2000;28(9):1066–1074.
- Cao H, Vorperian VR, Tsai JZ, et al. Temperature measurement within myocardium during in vitro RF catheter ablation. IEEE Trans Biomed Eng. 2000;47(11):1518–1524.
- Tungjitkusolmun S, Vorperian VR, Bhavaraju N, et al. Guidelines for predicting lesion size at common endocardial locations during radio-frequency ablation. IEEE Trans Biomed Eng. 2001;48(2):194–201.
- González-Suárez A, Pérez JJ, Berjano E. Should fluid dynamics be included in computer models of RF cardiac ablation by irrigated-tip electrodes? Biomed Eng Online. 2018;17(1):43.
- Jain MK, Wolf PD. A three-dimensional finite element model of radiofrequency ablation with blood flow and its experimental validation. Ann Biomed Eng. 2000;28(9):1075–1084.
- Schutt D, Berjano EJ, Haemmerich D. Effect of electrode thermal conductivity in cardiac radiofrequency catheter ablation: a computational modeling study. Int J Hyperthermia. 2009;25(2):99–107.
- González-Suárez A, Berjano E. Comparative analysis of different methods of modeling the thermal effect of circulating blood flow during RF cardiac ablation. IEEE Trans Biomed Eng. 2016;63(2):250–259.
- Keren G, Sherez J, Megidish R, et al. Pulmonary venous flow pattern-its relationship to cardiac dynamics. A pulsed Doppler echocardiographic study. Circulation. 1985;71(6):1105–1112. Jun
- Cibis M, Lindahl TL, Ebbers T, et al. Left Atrial 4D Blood Flow Dynamics and Hemostasis following Electrical Cardioversion of Atrial Fibrillation. Front Physiol. 2017;8. DOI: https://doi.org/10.3389/fphys.2017.01052
- Matsudaira K, Nakagawa H, Wittkampf FH, et al. High incidence of thrombus formation without impedance rise during radiofrequency ablation using electrode temperature control. Pacing Clin Electrophysiol. 2003;26(5):1227–1237.
- Demazumder D, Mirotznik MS, Schwartzman D. Biophysics of radiofrequency ablation using an irrigated electrode. J Interv Card Electrophysiol. 2001;5(4):377–389. Dec
- Demazumder D, Mirotznik MS, Schwartzman D. Comparison of irrigated electrode designs for radiofrequency ablation of myocardium. J Interv Card Electrophysiol. 2001;5(4):391–400. Dec
- Tsai W, Savaş O. Flow pumping system for physiological waveforms. Med Biol Eng Comput. 2010;48(2):197–201.
- Chong A, Sun Z, van de Velde L, et al. A novel roller pump for physiological flow. Artif Organs. 2020;44(8):818–826.
- González-Suárez A, Berjano E, Guerra JM, et al. Computational modeling of open-irrigated electrodes for radiofrequency cardiac ablation including blood motion-saline flow interaction. PLoS One. 2016;11(3):e0150356.
- Doss JD. Calculation of electric fields in conductive media. Med Phys. 1982;9(4):566–573.
- Pérez JJ, González-Suárez A, Berjano E. Numerical analysis of thermal impact of intramyocardial capillary blood flow during radiofrequency cardiac ablation. Int J Hyperthermia. 2018 May;34(3):243–249.
- Labonté S. Numerical model for radio-frequency ablation of the endocardium and its experimental validation. IEEE Trans Biomed Eng. 1994;41(2):108–115.
- Hasgall PA, Di Gennaro F, Baumgartner C, et al. IT’IS database for thermal and electromagnetic parameters of biological tissues. Version 4.0, May 15, 2018. Available from: www.itis.ethz.ch/database
- Pérez JJ, Ewertowska E, Berjano E. Computer modeling for radiofrequency bipolar ablation inside ducts and vessels: relation between pullback speed and impedance progress. Lasers Surg Med. 2020;52(9):897–906.
- Trujillo M, Berjano E. Review of the mathematical functions used to model the temperature dependence of electrical and thermal conductivities of biological tissue in radiofrequency ablation. Int J Hyperthermia. 2013;29(6):590–597.
- Rossmanna C, Haemmerich D. Review of temperature dependence of thermal properties, dielectric properties, and perfusion of biological tissues at hyperthermic and ablation temperatures. Crit Rev Biomed Eng. 2014;42(6):467–492.
- Haemmerich D, dos Santos I, Schutt DJ, et al. In vitro measurements of temperature-dependent specific heat of liver tissue. Med Eng Phys. 2006;28(2):194–197. Epub 2005 Jul 5. PMID: 16002318.
- Bhaskaran A, Barry MA, Pouliopoulos J, et al. Circuit impedance could be a crucial factor influencing radiofrequency ablation efficacy and safety: a myocardial phantom study of the problem and its correction. J Cardiovasc Electrophysiol. 2016;27(3):351–357.
- Irastorza RM, Gonzalez-Suarez A, Pérez JJ, et al. Differences in applied electrical power between full thorax models and limited-domain models for RF cardiac ablation. Int J Hyperthermia. 2020;37(1):677–687.
- Pérez JJ, González-Suárez A, Nadal E, et al. Thermal impact of replacing constant voltage by low-frequency sine wave voltage in RF ablation computer modeling. Comput Methods Programs Biomed. 2020;195:105673.
- Shin DG, Ahn J, Han SJ, et al. Efficacy of high-power and short-duration ablation in patients with atrial fibrillation: a prospective randomized controlled trial. Europace. 2020;22(10):1495–1501.