
 ?Mathematical formulae have been encoded as MathML and are displayed in this HTML version using MathJax in order to improve their display. Uncheck the box to turn MathJax off. This feature requires Javascript. Click on a formula to zoom.
Abstract
Background: Treatment quality is important in clinical hyperthermia. Guideline-based treatment protocols are used to determine system settings and treatment strategies to ensure effective tumor heating and prevent unwanted treatment-limiting normal tissue hot spots. Realizing both these goals can prove challenging using generic guideline-based and operator-dependent treatment strategies. Hyperthermia treatment planning (HTP) can be very useful to support treatment strategies. Although HTP is increasingly integrated into the standard clinical workflow, active clinical application is still limited to a small number of hyperthermia centers and should be further stimulated.
Purpose: This paper aims to serve as a practical guide, demonstrating how HTP can be applied in clinical decision making for both superficial and locoregional hyperthermia treatments.
HTP in clinical decision making: Seven problems that occur in daily clinical practice are described and we show how HTP can enhance insight to formulate an adequate treatment strategy. Examples use representative commercially available hyperthermia devices and cover all stages during the clinical workflow. Problems include selecting adequate phase settings, heating ability analysis, hot spot suppression, applicator selection, evaluation of target coverage and heating depth, and predicting possible thermal toxicity in case of an implant. Since we aim to promote a general use of HTP in daily practice, basic simulation strategies are used in these problems, avoiding a need for the application of dedicated advanced optimization routines that are not generally available.
Conclusion: Even fairly basic HTP can facilitate clinical decision making, providing a meaningful and clinically relevant contribution to maintaining and improving treatment quality.
1. Introduction
Hyperthermia therapy is a clinical application of heat (40–43 °C) to malignant tumors, to enhance the effectiveness of radiotherapy and/or chemotherapy. Several randomized trials demonstrated significant improvement in response, control and/or survival by adding hyperthermia, for e.g., locally advanced cervical cancer, bladder cancer, melanoma, head and neck cancer, soft tissue sarcoma and (recurrent) breast cancer [Citation1–5]. Hyperthermia can also be very effective in palliative care, for example in the treatment of painful bone metastases or heavily pretreated patients with breast cancer recurrences [Citation6,Citation7].
Tumor heating can be induced by a variety of external or interstitial techniques, including radiative radiofrequency (RF), microwave (MW), infrared, capacitive, high intensity focused ultrasound (HIFU) and scanned focused ultrasound (SFUS) devices [Citation8,Citation9]. Treatment approaches are subdivided into three broad categories: local, locoregional, or whole body heating. For the abovementioned tumor indications, either local or locoregional hyperthermia is applied. Local hyperthermia can be applied to superficial tumors that penetrate up to ∼4 cm into tissue, such as melanoma and chest wall recurrences. Microwave applicators, operating at frequencies of 434 or 915 MHz, are commonly used for these indications [Citation10,Citation11]. With locoregional hyperthermia, the tumor and its surroundings are heated. This is often used for deep-seated tumors and applied with phased-array systems. These systems operate in the frequency range of 60–120 MHz, and consist of multiple antennas positioned in one to three rings around the patient [Citation12–14]. Focusing heat to the tumor location is realized by selecting adequate phase-amplitude settings of the antennas to create a favorable interference pattern. Capacitive devices operate at a frequency of 8 or 13.56 MHz. Two electrodes (or pairs of electrodes) are used, and the resulting electric fields produced by capacitive coupling with the human body cause heating. A form of power steering can be applied by selecting electrode sizes; the absorbed power is directed toward the center of the distance between the electrodes when the two electrodes have an equal diameter. When the electrodes have different diameters, the power distribution is shifted in the direction of the smaller electrode [Citation15].
Treatment quality is very important in clinical hyperthermia, since several clinical studies demonstrated that higher tumor temperatures result in better tumor control [Citation16–21]. On the other hand, excessive heating of normal tissue usually leads to patient discomfort when temperatures exceed 44–45 °C [Citation22], which may lead to tissue damage and should thus be avoided [Citation23]. The local energy deposition differs significantly for different tissue types, so the absorbed power distributions are heterogeneous and depend strongly on the local anatomy. The temperature elevation depends on this power absorption, but also on blood flow and tissue perfusion, which all affect control over the temperature distribution. Hyperthermia system settings must therefore be optimized to ensure good tumor heating and prevent unwanted treatment-limiting normal tissue hot spots. Following the ESHO quality assurance guidelines, hyperthermia applicators with appropriate effective field size and tissue penetration depth are selected and treatment quality during treatment delivery is monitored by standard on-line thermometry feedback using thermometry probes at or close to the tumor location; system settings are adjusted according to the patient’s tolerance and comfort level [Citation24,Citation25]. When treating large fixated tumors, noninvasive MR-thermometry feedback can be a useful addition to invasive thermometry [Citation8,Citation26–30]. Generalized treatment protocols backed by on-line thermometry are routinely applied [Citation24,Citation25]. These protocols usually consist of methods to establish reasonable initial settings, aiming to direct or focus the energy onto the tumor target, combined with strategies to change system settings when treatment-limiting hot spots limit tumor heating during treatment delivery.
However, the aforementioned generalized treatment strategies are not always sufficient to guarantee optimal treatment delivery. Advanced pretreatment planning would be very helpful to ensure optimal thermal dose delivery as best as possible, similar to treatment planning for radiotherapy treatments. However, the quantitative reliability, i.e., prediction by absolute numbers, of hyperthermia treatment planning (HTP) is limited due to uncertainties in dielectric and thermal tissue properties and a lack of a priori knowledge of the dynamic changes in perfusion levels during hyperthermia [Citation31,Citation32]. In addition, antenna coupling and other inaccuracies (i.e., deviations of adjusted parameters, such as phases) might cause significant differences between planning calculations and real heating patterns [Citation33,Citation34].
There is a clinical role for HTP in guiding treatment delivery, despite aforementioned limitations in the potential of HTP to reliably predict absolute specific absorption rate (SAR) or temperature levels in individual patients. HTP has matured over the years [Citation31] and the guidance of treatment strategies is currently increasingly supported by HTP, which is potentially more effective in identifying system settings that yield the maximum achievable tumor temperature dose [Citation35–37]. A qualitative reliability of HTP has been demonstrated, i.e., heating patterns are correctly predicted, even when the predicted absolute temperature levels are less reliable [Citation38,Citation39]. This qualitative reliability allows practical use in clinical decision making, for example in applicator selection to determine a treatment strategy [Citation40–42], analyzing the feasibility of heating and predicting possible complications [Citation43,Citation44] and reducing the temperature at hot spot locations [Citation37]. The role of HTP in clinical hyperthermia is emerging and integration into the clinical workflow is becoming common practice [Citation31,Citation36,Citation44–47]. Quality assurance guidelines for locoregional hyperthermia have started recommending the use of HTP [Citation25].
Despite all progress in HTP, active clinical use is still only limited to a small number of hyperthermia centers. Since HTP can be a very useful tool to ensure, and even improve, treatment quality, a wider use of HTP in clinical routine should be stimulated. Therefore, this paper aims to serve as a practical guide, demonstrating how day-to-day clinical decision making can be effectively and relatively easily supported by HTP. To this end, we present and discuss several problems that occur in daily clinical practice and we show how HTP can be deployed in specific clinical situations to support and optimize treatment delivery, beyond what can be achieved with standard treatment protocols. For such clinical application, the operators have to formulate a treatment strategy with the equipment available at their institute. Therefore, we assume differences in available equipment for different hyperthermia centers for the clinical cases discussed in this paper. To promote a wide use of HTP in daily routine, dedicated and advanced optimization routines are avoided, since these are currently only available at a few research departments. We thus illustrate how practical use of HTP can enhance insight to facilitate the formulation of adequate treatment strategies with the equipment available, ensuring good treatment quality.
The structure of the paper is as follows: first, we present the different hyperthermia centers considered in this paper and their available equipment. Then we specify the patient models used and the simulation methods. The following section then explains HTP evaluation strategies and clinically relevant metrics for decision making. Finally, we present seven clinical problems and explain how the problem could be evaluated using HTP, followed by a general discussion section.
2. Hyperthermia centers and heating equipment
When using HTP in clinical decision making, a treatment strategy has to be formulated for the specific hyperthermia equipment available at the institute where the patient will be treated. Such equipment is typically a locoregional and/or superficial radiative device, or a capacitive device. Commercially available locoregional phased-array systems are the BSD-2000 systems (Pyrexar Medical, Salt Lake City, USA) and the ALBA-4D system (ALBA Hyperthermia, Rome, Italy) [Citation12–14]. Examples of commonly used superficial radiative devices are the ALBA ON 4000 (ALBA Hyperthermia, Rome, Italy) and the BSD-500 system (Pyrexar Medical, Salt Lake City, USA) [Citation10,Citation11]. A large variety of capacitive heating systems is used worldwide in clinical hyperthermia centers, among which Thermotron RF8 (Yamamoto Vinita Co, Osaka, Japan), Oncotherm (Oncotherm Kft, Budapest, Hungary), HY-DEEP 600 WM (Andromedic s.r.l., Velletri, Italy) and Celsius TCS (Celsius42+ GmbH, Cologne, Germany). Although there are some technical differences between these capacitive systems, the basic heating principle is the same for all these commercially available devices.
To represent clinical reality, we assume four different hyperthermia centers A, B, C and D, each center with a different but representative set of devices, suitable for their respective patient populations. Institute A performs locoregional hyperthermia using the BSD 2000 system with the Sigma-60 applicator, institute B has superficial and locoregional ALBA devices (ALBA-4D and ALBA ON 4000), institute C offers hyperthermia treatments with the capacitive Celsius TCS system and institute D performs superficial hyperthermia using the ALBA ON 4000 system, as shown in . Each device listed in represents a class of devices and the possible strategies we will discuss to evaluate clinical problems can also be applied for similar devices, i.e., other capacitive, superficial or locoregional radiative devices.
Table 1. Hyperthermia institutes and available equipment.
The heating devices in have the following technical specifications:
The locoregional BSD 2000 Sigma-60 applicator [Citation14,Citation48] has eight paired dipole antennas, organized in a single ring with a diameter of 58 cm and a length of 50 cm. The dipole antennas have a length of 45 cm. The frequency range is variable between 60 and 120 MHz. Many institutes use a fixed frequency within this range; in this paper, we selected 90 MHz as an often-used frequency. The space between the applicator and the skin is filled with water in a bolus bag.
The locoregional 70 MHz ALBA-4D system [Citation12,Citation49] has four independent rectangular waveguides (aperture size 20 × 34 cm2), positioned in a ring around the patient. The distance between the waveguides and the patient is filled with water in bolus bags and can be adjusted, such that a fixed distance can be used, independent of the patient’s dimensions. In this paper, we assumed a distance of ∼5 cm.
The capacitive Celsius TCS system. This system operates at 13.56 MHz and uses a pair of circular electrodes. Available sizes are 15 and 25 cm diameter, and an electrode combination is selected depending on the location of the heating target. The electrodes have an integrated water bolus bag.
The superficial 434 MHz ALBA ON 4000 system [Citation10,Citation50]. This system has four different sizes of microstrip applicators, the Alpha (8 × 20 cm2), Beta (15 × 16 cm2), Gamma (20 × 21 cm2) and Delta (29 × 21 cm2) applicators. The effective field sizes (EFS), i.e., the area under the applicator that is covered by the 50% SAR contour, are approximately 4 × 16 cm2, 8 × 12 cm2, 12 × 18 cm2 and 22 × 20 cm2, respectively. A water bolus is integrated in a rubber frame, attached to the applicator and the thickness is variable; in clinical practice the bolus thickness is typically ∼1 cm.
For all heating devices, the water bolus (filled with circulating distilled water) provides both energy coupling into the patient and skin cooling. For locoregional heating aggressive skin cooling is required and the water bolus temperature is typically between 10 °C and 20 °C [Citation51–53]; for superficial heating a relatively high water temperature (>39 °C) is used and the exact temperature level depends on the tumor depth and whether the skin is also involved as target, or not [Citation35].
3. Human models
Without loss of generality, the human models to illustrate the use of HTP for clinical questions were based on the models ‘Duke’ and ‘Ella’ from the Virtual Family data set, as provided by the Foundation for Research on Information Technologies in Society (IT’IS) [Citation54]. These generic realistic IT’IS models serve their purpose for the demonstration in this paper, but one should be aware that patient-specific modeling is always required for the clinical application of HTP.
In routine clinical HTP, patient models are often reconstructed by thresholding Hounsfield Units of a standard CT scan of the patient, which yields a tissue segmentation into muscle, fat, bone, lung and air [Citation55]. The target region is specified by the physician. The voxel models Ella and Duke V1.0 at 1 mm resolution were used as a basis for the HTP models [Citation54]. To mimic routine clinical HTP models, the number of tissue types was reduced to muscle, fat, bone, lung, air and target. Artificial targets were outlined, or organs were considered as target, as representative for each specific clinical case.
The seven examples of clinical cases we discuss in this paper, are distributed over the four centers listed in and cover all stages during the clinical workflow, including selection of adequate phase settings (case 1: institute A, Ella), heating ability analysis (case 2: institute A, Ella), hot spot suppression (case 3: institute B, Duke), applicator selection (case 4: institute C, Duke; case 6: institute D, Duke and case 5: institute B, Ella), evaluation of target coverage and heating depth (case 5: institute B, Ella, and case 6: institute D, Duke), and evaluating the possible risk of thermal toxicity associated to the presence of an implant in the target region (case 7: institute D, Ella). An overview of the different cases, models and institutes is presented in .
Figure 1. Overview of the different clinical example cases, as discussed in this paper to illustrate clinical decision making facilitated by HTP. A treatment strategy should be formulated for the specific equipment available at the institute concerned. Patient models used in these examples were based on the virtual family models Duke and Ella [Citation54].
![Figure 1. Overview of the different clinical example cases, as discussed in this paper to illustrate clinical decision making facilitated by HTP. A treatment strategy should be formulated for the specific equipment available at the institute concerned. Patient models used in these examples were based on the virtual family models Duke and Ella [Citation54].](/cms/asset/8fcedb5c-afaa-4d2e-a444-14efc7e98a06/ihyt_a_1903583_f0001_c.jpg)
4. Treatment planning simulations
To stimulate a general clinical use of HTP, which can be easily implemented into the clinical work flow in any hyperthermia center, we will use only basic SAR and temperature simulations to illustrate clinical problem evaluation by HTP. Such basic simulations do not necessarily require sophisticated software routines, and thus allow a wide applicability.
Any treatment planning or simulation software package, either finite-difference or finite-element based, would thus be suitable for this purpose. Without loss of generality, all SAR and temperature simulations were performed using Plan2Heat, a dedicated in-house developed software package, which uses voxel-based finite difference calculations [Citation55]. The resolution applied for all locoregional and superficial simulations was 2.5 × 2.5 × 2.5 mm3 and 2 × 2 × 1 mm3, respectively. Downscaling was performed using a winner-take-all method [Citation55,Citation56], which means that a voxel in the downscaled grid is assigned the properties of the tissue type that occurs most frequently in the corresponding voxels in the original grid. The patient model is then combined with the applicator model, yielding a model for SAR and temperature calculations. Dielectric and thermal tissue properties at specific frequencies were assigned from the literature, as summarized in and .
Table 2. Values of the dielectric properties at 13.56 MHz, 70 MHz, 90 MHz and 434 MHz used in the simulations [Citation57].
Table 3. Values of the density and thermal properties used in the treatment planning simulations [Citation58].
4.1. SAR simulations
For radiative heating, as performed with the BSD Sigma-60 applicator, ALBA-4D and ALBA ON 4000 systems, the SAR was determined from electromagnetic field simulations performed using the Finite Difference Time Domain method, with a perfectly matched layer boundary condition [Citation59]. Electric fields were calculated for each antenna (or antenna pair) separately, with unit amplitude and zero phase. This allows easy superpositioning to calculate the power distribution for any phase-amplitude setting in phased array systems. The total E-field () is then calculated as:
(1)
(1)
where N is the number of independent antennas,
is the E-field generated by antenna i and vi is the complex input (amplitude and phase) of antenna (or antenna pair) i. From this electric field distribution the SAR (W/kg) is calculated:
(2)
(2)
with σ (S/m) the electric conductivity and ρ (kg/m3) the tissue density.
For capacitive hyperthermia, as performed with the Celsius TCS system, a quasi-static formulation of Maxwell’s equations was used to calculate the power deposition [Citation41,Citation60]. This quasi-static formulation yields an elliptic partial differential equation to be solved for the potential V [Citation61], and the electric field vector can be written as The SAR is again defined by EquationEquation (2)
(2)
(2) . The electrode plates were kept at a constant potential of 1 V and −1 V. The boundaries of the simulation domain were fixed at zero potential.
4.2. Temperature simulations
Thermal simulations were based on Pennes’ bioheat equation, describing the temperature as dependent on thermal conductivity, perfusion and SAR [Citation62].
(3)
(3)
with c the specific heat capacity (J/kg/°C), k (W/m/°C) the thermal conductivity, cb the specific heat capacity of blood, Wb (kg/m3/s) the volumetric perfusion rate and Tart the local arterial or body core temperature, which was assumed 37 °C. Note that perfusion rate is also often expressed in the literature in ml/100 g/min, which corresponds roughly to 6·Wb for muscle-like tissues. The metabolic heat rate is considered negligible since it is very small compared to the power deposition by the heating device. Surrounding water bolus and air were modeled as fixed temperature boundary conditions. The ambient air temperature was assumed 20 °C; bolus temperatures depended on the specific application (10–18 °C for locoregional heating and 41 °C for superficial heating). Steady-state temperature distributions were calculated and hyperthermia-enhanced perfusion values were used, as taken from the literature (), along with other thermal properties [Citation58,Citation63,Citation64]. For the bladder filling, a factor 10 enhanced thermal conductivity was implemented to mimic convective heat flow in urine [Citation65–67].
5. HTP evaluation strategies and clinically relevant metrics
Clinical decision making facilitated by HTP involves evaluation of a certain treatment strategy or comparison of different treatment strategies. For superficial hyperthermia, this typically concerns the evaluation of the heating quality. For locoregional hyperthermia with phased array systems, HTP can be helpful to evaluate the effect of phase-amplitude adjustments on the predicted heating patterns. The phase and amplitude settings determine the interference pattern (EquationEquation (1)(1)
(1) ) and the phase settings mainly determine the focusing to the target.
HTP evaluations can be based either on SAR or temperature predictions, or a combination. The preferred evaluation method depends also on the clinical problem for which decision making is required. For applications analyzing target coverage and focusing ability, SAR-based evaluation is most straightforward. Analysis using the 1 cc averaged SAR is often preferred over the direct calculated voxel-based SAR, since this avoids that single voxel SAR peak hot spots affect conclusions. Clinically relevant and commonly used SAR evaluation metrics to assess the heating quality are the average target SAR, the hot spot target ratio (HTQ), and target coverage (TC) [Citation68–71]:
The average target SAR is a useful parameter to evaluate the power absorption in the target, and thereby the heating quality, when the power level is fixed. Average target SAR has been demonstrated to correlate with T50 for locoregional hyperthermia in e.g., cervical cancer patients, with T50 the temperature exceeded by 50% of the temperature measurements in the target volume during steady state [Citation69].
The HTQ can be used to evaluate the ratio between target and normal tissue heating to compare different strategies and identify the strategy with the lowest risk of hot spots. The HTQ is defined as [Citation69]:
(4)
The target coverage TCx, defined as the part of the target volume covered by x% of the maximum overall SAR [Citation69], identifies the heating effectiveness of the target relative to the maximum SAR in the patient. This is also useful to compare different treatment strategies. TC25 and TC50 are often used and clinical studies by Myerson et al. and Lee et al. have shown that TC25 is a prognostic factor in superficial hyperthermia [Citation70,Citation71].
For some other problems, such as steering in response to hot spots, both SAR and temperature evaluations could be helpful, but the use of temperature might be more practical. For example, in case of a hot spot at a fat-muscle interface, the contrast in thermal properties, with fat having a low thermal conductivity and perfusion compared to muscle, influences the local temperature. It is not straightforward to determine the level of SAR reduction needed to realize a sufficient and specific reduction in hot spot temperature. Furthermore, the effects of bolus cooling are not reflected by SAR modeling. Although SAR is correlated to temperature, thermal modeling will be essential to make an adequate decision when the thermal effects of e.g., bolus cooling or unfavorable thermal properties of an implant (no perfusion, low thermal conductivity) might significantly influence the results. The achieved temperature during clinical hyperthermia is a prognostic factor for treatment outcome, as has been demonstrated in several studies, for superficial as well as locoregional hyperthermia [Citation16–21]. Achieved temperatures during treatment are usually reported by the indexed temperatures
T90, T50, and T10, i.e., the temperature exceeded by 90%, 50% and 10% of the temperature measurements during steady state, respectively.
Therefore, indexed temperatures are also used for qualitative evaluation of HTP results.
6. Examples of HTP facilitating clinical decision making
In this section, the seven cases, as summarized in , are discussed. A common trait in all cases is that HTP can assist clinical decision making when experience-based treatment strategies might fall short in ensuring effective tumor heating and avoiding treatment-limiting hot spots. In all cases, the principle is that the operator sets out a logical decision-making strategy using planning/simulations as a tool to evaluate and compare treatment options or settings. Although simulations are performed for a specific hyperthermia applicator, as available in the institute concerned, the presented possible evaluation methods are generally applicable and can be performed with any heating device.
6.1. Case 1: selection of phase settings
6.1.1. Clinical problem
A non-muscle invasive bladder cancer patient is treated at institute A with chemotherapy (Mitomycin C) and simultaneous locoregional hyperthermia, applied with the Sigma-60 applicator. According to standard clinical practice at the institute, hyperthermia treatments are started with equal amplitudes for all antenna pairs. The operator wants to determine initial phase settings that yield the best focusing to the bladder target region. The patient is treated in supine position.
6.1.2. Possible problem evaluation using either an E-field probe or HTP
A fast and robust patient-specific clinical optimization procedure is determining phase settings using an E-Field probe, positioned at or close to the tumour location [Citation73]. Because of the dimensions of the probe (∼5 mm diameter), it is not possible to position the probe in the bladder and the probe is usually positioned in the rectum or vagina. Before the start of treatment, a phase sweep is then performed for each individual antenna pair combined with a reference (i.e., phase 0°) to determine the optimal phase settings, yielding a maximum signal registered by the E-Field probe. In case the probe cannot be positioned at the exact tumour location, such as for bladder cancer patients, a slight adjustment of the phase settings will be applied manually to account for the distance between probe and tumour location [Citation73].
However, if institute A does not have an E-field probe, this procedure can also be mimicked using SAR-based HTP. Suppose the top antenna pair is chosen as reference, then each antenna pair combination is switched on pair-wise: top + bottom, top + left and top + right. A full phase sweep from −180° to +180°, with steps of 5°, is simulated per active antenna pair combination at an arbitrary fixed power level and SAR distributions are calculated for each setting using EquationEquations (1)(1)
(1) and Equation(2)
(2)
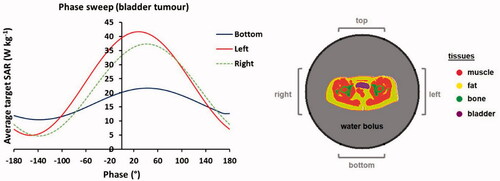
(2) . The average SAR in the target (i.e., bladder) region is determined for each setting and the resulting phase settings corresponding to the maximum SAR are determined as optimal phase settings. This procedure resulted in top:bottom:left:right (°) = 0:40:30:40, as can be observed in . Note that a phase delay of about 40° of the top compared to the bottom antenna shifts the SAR focus toward the more ventrally located bladder. This is a well-known rule of thumb for the use of annular-phased-array systems in this frequency range, which is consistent with this planning evaluation.
Figure 2. Simulated phase sweep optimization procedure for focusing to the bladder target region. The graph shows simulated average SAR values in the bladder for a phase sweep with the bottom, left and right antenna pairs of the Sigma-60 applicator, where the top antenna pair served as reference, i.e., phase 0°. This resulted in optimal phase settings of top:bottom:left:right (°) = 0:40:30:40.
During hyperthermia treatments of pelvic tumors, thermometry probes are usually positioned in the bladder, vagina and rectum. These probes can be used to verify adequate focusing on-line at the start of the hyperthermia treatment, by performing temperature rise measurements after a 60 s power pulse [Citation73]. The measured temperature rise is approximately proportional to SAR, because the influence of thermal conduction, convection and perfusion are very small during this short power pulse at the start of treatment, since all tissues are initially still at baseline temperature. Bottom phase shifts of e.g., −40°, 0° and 40° with respect to the optimized bottom phase can be applied to evaluate which settings yield the highest temperature rise in the target region and validate focusing. These temperature rise measurements to verify adequate focusing are also part of the standard clinical procedure at the Amsterdam UMC [Citation39,Citation73].
A similar phase sweep procedure can also be applied in case of a multiple-ring locoregional heating system, where after phase optimization within each antenna ring, the phase of each ring is optimized with respect to a reference ring [Citation73].
6.2. Case 2: heating ability
6.2.1. Clinical problem
A locally advanced cervical cancer patient is to be treated at institute A with radiotherapy and concurrent cisplatin-based chemotherapy, according to the standard clinical practice. There are no contra-indications for platinum-based chemotherapy, but the patient would prefer treatment with radiotherapy and hyperthermia, because of the risk of chemotherapy-related toxicity. This is considered a good option since the clinical outcome of thermoradiotherapy would be comparable to the standard chemoradiotherapy [Citation74]. However, since hyperthermia treatment quality depends on the achieved temperatures [Citation16,Citation21], the question is whether this patient is expected to be easy to heat or difficult to heat with the equipment available at institute A, the locoregional BSD Sigma-60 applicator. Establishing the ability to heat will help to decide whether thermoradiotherapy is indeed an acceptable equally effective alternative for chemoradiotherapy for this specific patient. The clinician prefers to avoid organizing a hyperthermia test-session to establish the heating ability to avoid unnecessary burden for the patient.
6.2.2. Possible problem evaluation using HTP
As demonstrated by Sreenivasa et al., HTP can be helpful to predict the heating ability of a patient [Citation44]. Simulations should then be performed and evaluated for clinical phase-amplitude and power settings. According to clinical practice at institute A, equal amplitudes are applied and phases are optimized using an E-field probe positioned in the vagina. As described in case 1, this procedure can be mimicked by a numerical phase sweep to obtain adequate phase settings for focusing to the tumour. A power level of 600 W is assumed, as commonly applied for pelvic heating [Citation75,Citation76]. shows the result of this phase sweep optimization. This indicates that tumour SAR values are relatively low, which is more or less independent of the phase setting and thus a pronounced focus would be difficult to achieve. shows a transversal slice of the predicted clinically optimized SAR distribution of this patient through the center of the tumour, with an average predicted tumour SAR of 12.8 W/kg.
Figure 3. (A) Result of a mimicked clinical phase sweep optimization procedure, for heating with the Sigma-60 applicator. (B) Predicted SAR distribution for the optimized phase settings and an example of the correlation between predicted average SAR and measured T50 tumor temperatures for cervical cancer patients treated at institute A with the Sigma-60 applicator. The green contour in the SAR distribution indicates the target region.
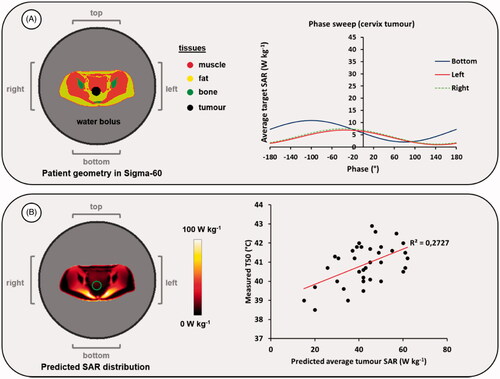
Since the average target SAR correlates with the indexed temperature T50 [Citation69], which in turn correlates with clinical outcome [Citation21], a decision could be further assisted by using the correlation between predicted average SAR and reported steady-state T50 temperatures for cervical cancer patients previously treated and planned at institute A, as illustrated in . Although the correlation in is rather weak, a predicted average SAR of 12.8 W/kg for this patient will most likely indicate that the heating ability of this patient is not very high. Literature data show that cervical cancer patients with a T50 higher than 40.5 °C have a better clinical outcome than patients with a T50 lower than 40.5 °C [Citation21]. The clinically achievable T50 will probably be much lower than 40.5 °C and thus radiochemotherapy might be preferable to ensure a good clinical outcome.
Alternatively, a similar analysis could be performed for the correlation between predicted and measured target temperatures or other indicators. Note that the data points and the correlation in are only meant as an illustration to support this example. To ensure reliable decision making, sufficient data from patients treated at the department concerned should always be used for evaluation. HTP results should only be used to assist the decision making and evaluate treatment options. HTP only provides a rough indication whether a patient is expected to be ‘easy to heat’ or ‘difficult to heat’. In case of doubt about the heating ability, the option of performing a hyperthermia test-session should always be considered. The eventually achieved temperatures in the target will be largely determined by the tumor perfusion, which varies significantly between patients, and also by the tolerated total power, which depends on numerous clinical factors. This includes a reactive perfusion elevation in hot spot regions, which might differ between patients, resulting in varying patient tolerance. This also explains the large spread in points in and the rather weak correlation.
6.3. Case 3: hot spot suppression
6.3.1. Clinical problem
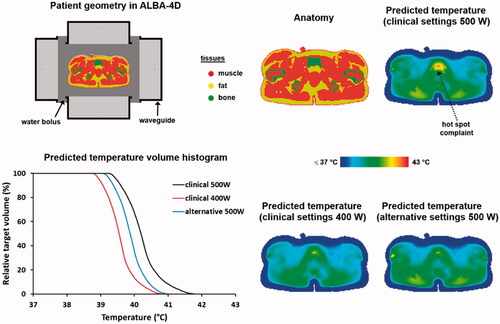
A patient with a locally advanced recurrent rectum tumour is treated at institute B with re-irradiation combined with locoregional hyperthermia, applied with the ALBA-4D system. The patient is treated in supine position. A bolus temperature of about 12 °C is applied for skin cooling [Citation51]. Equal amplitudes were used and phases as resulting from a phase sweep optimization were applied to focus the energy onto the tumour, which were top:bottom:left:right (°) = 75:0:70:60. Note that a phase delay of the bottom compared to the top antenna shifts the SAR focus dorsal towards the rectum, similar to the ventral shift toward the bladder using a phase delay of the top antenna in case 1. During the first treatment session, a severe hot spot complication (burning sensation) occurred near the pubic bone and the operator decided to reduce the total power from 500 first to 450 W and eventually to 400 W, which is probably suboptimal and unfortunately resulted also in decreasing the measured tumour T90 with 0.8 °C. This decrease should be avoided in the next session since clinical results for hyperthermia in treatment of rectum tumours have shown a correlation between T90 and clinical outcome [Citation19]. The operator needs a possible steering strategy to avoid the hot spot complaint in the next treatment session while maintaining adequate tumour heating.
6.3.2. Possible problem evaluation using HTP
To determine a strategy to avoid this hot spot complaint while maintaining adequate target heating, changes in predicted temperature distributions can be evaluated for several possible adjustments of phase-amplitude settings. For the treatment settings mentioned above, the predicted hot spot temperature at 500 W is 42.5 °C, and after reducing the power by 100 W this predicted temperature at the hot spot location was reduced to 41.4 °C. The predicted tumour T90 by HTP was 39.6 °C, which decreased by 0.5 °C to 39.1 °C, as indicated in . HTP is not quantitatively reliable to predict exact temperature levels, but qualitative reliability allows the prediction of SAR/temperature changes as a result of phase-amplitude steering [Citation37,Citation38,Citation77]. Aim is thus to find settings that reduce the predicted hot spot and T90 temperatures by about 1 °C and 0 °C, respectively. Maintaining equal tumour heating might prove difficult, but the predicted decrease in T90 should at least be less than 0.5 °C, i.e., the predicted decrease for the treatment settings. Moreover, we should also avoid introducing new hot spots. The predicted overall maximum tissue temperature (44.8 °C) was in the lower back, which is close to the level at which a hot spot sensation would be experienced, but it was not indicated as a hot spot by the patient. The exact temperature level of this predicted overall maximum is not quantitatively reliable and might in reality thus be somewhat higher, or in this case lower, since the patient reported no complaint. However, to avoid the risk of inducing a hot spot, the predicted temperature at this location should preferably not increase further.
Table 4. Predicted temperatures (tumor T90, pubic bone hot spot temperature and overall maximum temperature in the patient volume, which was located at the lower back) after adjusting power and phase settings to resolve a hot spot at the pubic bone.
Since the hot spot/burning sensation was near the pubic bone, which is close to the top antenna, a logical first strategy to explore would be to reduce the power delivery of the top antenna and compensate that by the other antennas to keep the same amount of total power directed at the tumor. As observed in the first three rows of the alternative settings in , this indeed reduces the hot spot temperature to some extent without reducing T90, but at the same time the overall maximum predicted temperature at the back is increased, yielding a risk for a new hot spot. When the power emitted by the top antenna is reduced by half, the temperature at the original hot spot location is reduced by approximately 0.5 °C, but the maximum predicted temperature at the back is increased by 0.5 °C. Thus, a next step is required to further reduce the temperature at the pubic bone and to avoid the risk of new hot spots. Reduction of the power delivery of the bottom antenna would probably help to reduce the increased temperature at the back, but this would also have a negative impact on the tumor temperature, since the bottom antenna is very close to the target region and thus effective for target heating.
Therefore, additional phase steering strategies are evaluated to further reduce the temperature at the pubic bone and to slightly compensate for the increased temperature at the back as a result of the increased amount of power delivered by the bottom and lateral antennas. The wavelength in muscle tissue at 70 MHz is approximately 50 cm, which means that 15° phase change will induce a small focus shift of about 1 cm [Citation12]. Thus, by slightly lowering the phases of the lateral antennas a slight defocusing is realized, which indeed has the effect of both reducing the hot spot temperature and the overall maximum. With power ratios top:bottom:left:right = 0.5:1:1:1 and phases top:bottom:left:right (°) = 75:0:40:30, a slightly higher decrease in hot spot temperature is predicted, compared to reducing the total power. The predicted decrease in tumor T90 is minimal and the maximum predicted temperature did not increase. shows a transversal slice of the predicted temperature distribution through the location of the hot spot near the pubic bone for the original and the alternative settings, as well as predicted tumor temperature volume histograms. The overall heating pattern did not change significantly, so the risk of introducing hot spots at other potential hot spot locations, such as the hip bones, is also considered minimal.
Figure 4. Predicted temperature distributions and temperature volume histograms for clinical settings yielding a hot spot complaint near the pubic bone, clinical settings with reduced power to resolve the hot spot complaint and alternative settings determined with help of HTP to also resolve the hot spot complaint, but with a higher thermal dose in the tumor as with the clinical settings with reduced power.
Note that amplitude steering in response to relatively superficially located burning sensation hot spots is a clinically proven strategy, which also has been confirmed in previous clinical HTP studies [Citation78]. In case of more deep-seated pressure-like hot spot complaints phase steering should be explored [Citation78]. Since HTP is only qualitatively reliable, the predicted maximum temperature at the back will not necessarily materialize at the predicted level and will thus not necessarily lead to clinical hot spot complaints. During treatment the operator has the possibility to further evaluate the effect of different alternative settings based on on-line tumor temperature readings and patient tolerance. For example, starting with prescribed power ratios 0.5:1:1:1 and phases (°) 75:0:40:30, when complaints remain absent, the operator can try to slightly increase the tumor temperature further by using phases (°) 75:0:55:45, which possibly also yields sufficient hot spot temperature reduction, and see whether this slight increase in normal tissue temperature is tolerated by the patient or not.
6.4. Case 4: applicator selection
6.4.1. Clinical problem
A patient with muscle invasive bladder cancer is treated at institute C with radiotherapy plus hyperthermia, applied with the capacitive Celsius TCS system. Two combinations of top and bottom electrode sizes are possible: 25 cm + 25 cm and 15 cm + 25 cm. Because of the location of the bladder, a smaller top electrode probably yields a better SAR coverage in the target, but that analysis does not take possible normal tissue effects into account. The question is which combination of electrodes yields the most favourable heating of the bladder, also taking into consideration the possible incidence of normal tissue hot spots.
6.4.2. Possible problem evaluation using HTP
To answer the aforementioned question, simulations can be performed for a setup with both electrode combinations. The 1 cc average SAR distribution is calculated and the SAR values in the bladder and normal tissues are evaluated. The most effective electrode combination should result in the best possible target heating and the lowest risk of hot spots in normal tissue. A commonly used measure to evaluate this, is the hot spot target quotient (HTQ), as defined in EquationEquation (4)(4)
(4) [Citation68,Citation69]. Following Canters et al., we use SAR0.1 as SARhotspot for pelvic heating [Citation68]. The lower the HTQ, the more favourable the heating ratio of the target compared to normal tissues and thus the lower the risk of treatment limiting hot spots. To evaluate the HTQ the predicted SAR distributions were normalized to an arbitrary power of 100 W absorbed in the patient for both configurations. summarizes the specific SAR values. A setup with two electrodes of 25 cm diameter yields a slightly better HTQ, but the difference is very small (23.7 vs 25.6). The average predicted SAR in the bladder is 3.6 W/kg and 6 W/kg, for electrode combinations 25 cm + 25 cm and 15 cm + 25 cm, respectively, which means that the best focusing is achieved using the 15 cm diameter top electrode. However, the risk of normal tissue hot spots could also be higher, since the superficial SAR maximum increases when using a small top electrode, as observed in .
Figure 5. Predicted SAR (A) and temperature (B) distributions for two different electrode combinations, when heating a bladder cancer patient. The black contour in the temperature distributions indicates the bladder target. For temperature evaluation, the bolus temperatures at both ends of the clinically applied range were simulated (i.e., 18 °C and 10 °C) to ensure a robust conclusion regarding the optimal electrode combination, independent of the water temperature. Power was scaled such that the overall maximum predicted tissue temperature reached 45 °C. The displayed slice is at the central target location to visualize the effectiveness of target heating for different treatment setups with the same normal tissue constraints; the 45 °C maximum is not visible in this slice.
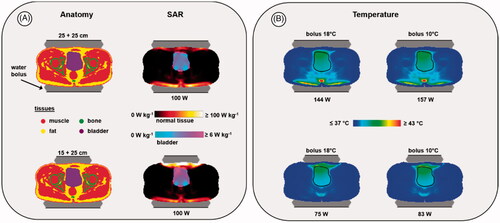
Table 5. Predicted SAR values and HTQ for two different electrode combinations when heating a bladder cancer patient. Total power was normalized to an arbitrary level of 100 W absorbed in the patient.
To minimize superficial hot spots, bolus cooling is applied during treatments with a bolus temperature usually varying between 10 °C and 18 °C [Citation53]. A lower temperature will be more effective to suppress hot spots, but despite aggressive skin cooling, treatment limiting hot spots at the superficial fat layer can still occur [Citation41,Citation79]. In clinical practice, typically, the first treatment session starts with a bolus temperature of 18 °C, which is gradually reduced to 10 °C during later sessions [Citation53]. Treatment starts with a relatively low output power, which is gradually increased depending on patient tolerance. Tolerated power is usually limited to 200 W and beyond 150 W the risk of hot spots is substantially increased, such that patient feedback is required at certain intervals to continue the treatment. Pain sensations usually occur when the temperature exceeds 45 °C [Citation22].
To evaluate the risk of treatment limiting hot spots, temperature simulations can provide additional insight. To ensure a robust conclusion, predicted temperature distributions are evaluated for bolus temperatures at both ends of the clinically applied range (i.e., 18 °C and 10 °C). During treatment, power will usually be increased until patient tolerance is reached. To mimic this, in the simulations the amount of power is scaled such that for each situation the same maximum predicted tissue temperature is achieved. We chose the threshold for pain sensation (45 °C), but conclusions about differences in heating effectiveness will not be affected by the selected maximum temperature level. shows the predicted indexed temperatures and the predicted distributions. The combination of two 25 cm electrodes yields an additional risk of dorsal hot spots for both a relatively low and relatively high bolus temperature. Moreover, although in theory a slightly higher T90 could be achieved with the 25 cm + 25 cm combination, approximately twice as much power would be required to realize similar target temperatures as with a 25 cm + 15 cm electrode combination. This would require an output power level that exceeds 150 W, yielding a substantial risk that patient tolerance will be a limiting factor. Based on this analysis, the combination of a 25 cm and a 15 cm electrode would be preferable for this patient. This conclusion would be valid for any bolus temperature in the clinically applied range between 10 °C and 18 °C.
Table 6. Predicted indexed target temperatures for two different electrode combinations when heating a bladder cancer patient.
6.5. Case 5: evaluation of the heating depth
6.5.1. Clinical problem
A patient with a recurrent melanoma on the left upper leg is treated at institute B with hyperthermia plus radiotherapy. The tumor is about 5 cm in diameter and extends up to 3.8 cm under the skin. Superficial hyperthermia is usually applied for tumors up to 3–4 cm below the skin surface [Citation80], so treatment with the ALBA ON 4000 system would be scheduled. However, since this tumor depth is close to the upper limit for superficial heating, the physician doubts whether this technique is the best choice and wonders whether a better treatment quality could be realized with the locoregional ALBA-4D system, which is also available at institute B.
6.5.2. Possible problem evaluation using HTP
To evaluate the heating quality for superficial and deep heating, simulations can be performed for both the ALBA ON 4000 and the ALBA-4D system. For the ALBA ON 4000, the Beta applicator is selected, since its effective field size (EFS = 8 × 12 cm2) covers the tumor area. Because the target is located superficially, for the ALBA-4D system heating with only the top antenna activated would be sufficient. To avoid unnecessary heating of the tumor-free leg and an additional risk of normal tissue hot spots, the tumor-free leg would then be shielded with a dry towel. The 1 cc average SAR distribution is calculated and the maximum SAR is normalized to 100%. To characterize the SAR distribution in the target we evaluate the TC25, i.e., the target coverage above 25% of the maximum SAR. This TC25 should exceed 75% to ensure adequate treatment [Citation72,Citation81].
Predicted normalized SAR distributions are shown in and TC25 values are 100% and 94% for the Beta applicator and the ALBA-4D, respectively. However, the TC50 value for the ALBA-4D is only 14%, which is much lower than for the Beta applicator (80%). This is partly explained by the fact that the ALBA-4D waveguide covers a larger region and the maximum SAR (100%) is outside the target region. Since the penetration depth for the ALBA-4D at 70 MHz is larger compared to the 434 MHz Beta applicator, a larger region will be heated and the thermal gradient to depth might be lower, yielding an improved temperature distribution. Therefore, additional evaluation of the predicted temperature distribution would be helpful. This will also show whether the maximum SAR at the skin could be a limitation for adequate target heating. Temperature simulations are performed, assuming a 41 °C water bolus for both systems. A relatively high water bolus temperature was chosen because the tumor starts at the level of the skin [Citation35]. During treatment, superficial and invasive temperatures will be continuously monitored by superficial and interstitial thermometry probes, positioned on the skin and in the target region, respectively. Power will be increased until a temperature maximum is reached, as specified in the treatment protocol. For superficial hyperthermia, the risk of thermal toxicity was found to increase significantly beyond 43.5 °C [Citation82]. Therefore, in the simulations power was scaled for each case, such that the maximum predicted temperature did not exceed 43.5 °C. However, the exact level of the maximum temperature allowed in the simulations will not affect conclusions about differences in heating ability for locoregional and superficial hyperthermia.
Figure 6. Predicted normalized SAR and temperature distributions, temperature-volume histograms and indexed temperatures for heating a melanoma in the upper leg using the superficial ALBA ON 4000 system, or the locoregional ALBA-4D system using only the top waveguide. The green and black contours in the SAR and temperature distributions represent the tumor target.
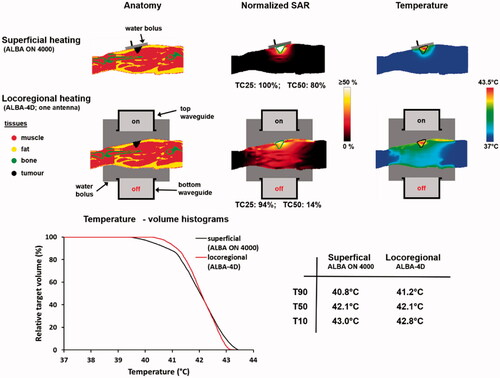
also shows the predicted temperature distributions and temperature volume histograms for both heating strategies. Adequate heating can be achieved using both ALBA ON 4000 and ALBA-4D and the predicted T50 is about 42 °C for both treatment setups. However, although for the ALBA-4D the maximum predicted temperature of 43.5 °C is indeed outside the target region, a slightly higher T90 is predicted (41.2 °C vs. 40.8 °C), because of the better penetration depth at 70 MHz. In case predicted heating would be unsatisfactory, further evaluation of a locoregional heating strategy with two (top, bottom) or three (top, bottom, left) active waveguides could be considered.
Since some improvement in minimum temperature, and thereby in heating quality, can be expected using the ALBA-4D, this would in principle be preferred. However, in case the physician considers locoregional hyperthermia too burdensome for the patient, or in case the patient would have been treated at institute D, where only superficial equipment is available, adequate treatment with the ALBA ON 4000 could also be ensured, since predicted TC25 is optimal (100%) and predicted temperatures are relatively high, with similar predicted T50 temperatures as when considering the ALBA-4D. According to the QA guidelines for superficial hyperthermia the minimum goal is to reach a T90 of 40 °C and a T50 exceeding 41 °C throughout the target volume for 60 min, allowing maximum temperatures of 43–45 °C [Citation24].
6.6. Case 6: evaluation of the target coverage
6.6.1. Clinical problem
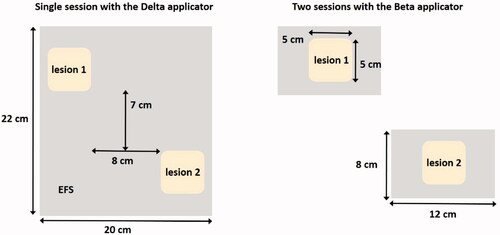
A patient with two recurrent melanoma lesions on the back is treated with hyperthermia plus radiotherapy at institute D. Both lesions extend up to 1 cm under the skin and the dimensions of each lesion are approximately 5 × 5 cm2. The distance between outer margins of the lesions in cranial-caudal and left-right direction is about 7 and 8 cm, respectively. The ALBA ON 4000 provides four different sizes of applicators. Considering the effective field size (EFS), the Beta applicator (EFS = 8 × 12 cm2) could adequately cover each individual lesion. However, this would require two separate treatment sessions, and thus a doubling of the total number of treatment sessions over the treatment course, which is an additional burden for both the patient and the treatment team. Alternatively, the Delta applicator (EFS = 20 × 22 cm2) could cover both lesions simultaneously. A schematic representation of both treatment options is shown in . The physician wants to ensure optimal treatment quality, so the question is whether a single session with the Delta applicator would yield a good quality treatment, or whether two separate sessions with the Beta applicator would be preferable.
Figure 7. Two possible treatment strategies for heating two melanoma lesions; a single session using the ALBA-4000 ON Delta applicator, or two sessions using the Beta applicator.
6.6.2. Possible problem evaluation using HTP
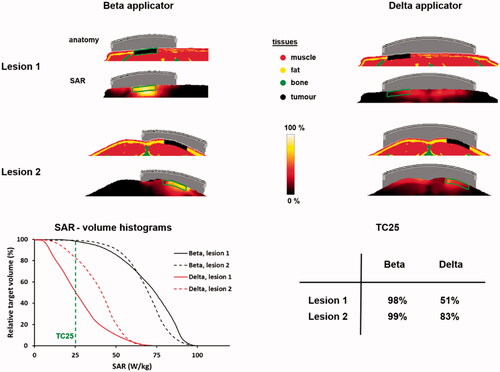
To evaluate target coverage for both heating strategies, SAR distributions can be calculated for the ALBA ON 4000 Delta and Beta applicators positioned on the tumor lesions. The 1 cc average SAR distribution is calculated and the maximum SAR is normalized to 100% for each treatment scenario. To characterize the SAR distribution in the target we evaluate the TC25, i.e., the target coverage above 25% of the maximum SAR. This TC25 should exceed 75% to ensure adequate treatment [Citation72,Citation81]. The TC25 is evaluated per lesion and compared for treatment with the Beta and Delta applicator.
shows the predicted normalized SAR distributions and SAR volume histograms. Coverage realized with two separate heating sessions with the Beta applicator is predicted to be substantially better compared to a single session with a larger Delta applicator. The predicted TC25 values for the two sessions with the Beta applicator are close to 100%. The TC25 values predicted for the Delta applicator are significantly lower (51–83%). Although the coverage for lesion 2 could be considered adequate, lesion 1 has a TC25 far below 75%. The difference in 50% SAR coverage (TC50) for the Beta and Delta applicators is even larger, as can be observed from the SAR-volume histograms in . This large difference is explained by the fact that there is some distance between lesions, which makes that antenna positioning for the Delta applicator is suboptimal since the lesions are not located centrally in the EFS region of the applicator (). Moreover, using a separate antenna for each lesion yields a more flexible power adjustment to realize optimal target coverage for both lesions.
Figure 8. Predicted normalized SAR distributions and SAR-volume histograms for heating two melanoma lesions as in , in two sessions using the ALBA ON 4000 Beta applicator, or in one single session using the Delta applicator. The green contours in the SAR distributions represent the tumor target.
6.7. Case 7: possible problems with a silicone breast implant
6.7.1. Clinical problem
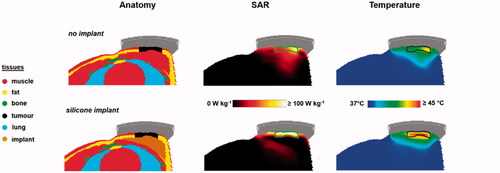
A patient with a recurrent tumor in a breast with a silicone implant is scheduled for re-irradiation combined with superficial hyperthermia treatment, using the ALBA ON 4000 system (Beta applicator) at institute D. The implant is located directly behind the tumor and the dimensions of the tumor are 6 × 6 cm, starting at the skin and reaching up to 1.5 cm depth. Since the silicone implant has a very low electrical conductivity and permittivity (), the implant-tissue interface yields inhomogeneous dielectric properties and as a result the SAR at this interface could be enhanced. This could cause hot spots since the implant is not perfused and has a low thermal conductivity, which obstructs heat removal. The question is whether severe hot spots can be expected at the implant-tissue interface and whether and where positioning of (additional) invasive thermometry probes would be desired for thermometry feedback to avoid thermal toxicity.
6.7.2. Possible problem evaluation using HTP
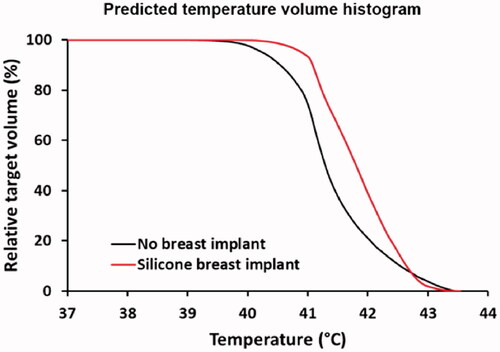
For evaluation of the possible impact of a silicone breast implant, simulations can be compared with a reference situation, where the silicone implant is replaced with muscle-equivalent tissue (mammary gland). Absorbed power in the patient is scaled to an arbitrary value of 15 W for both cases, to allow a direct comparison. Temperature simulations are performed, assuming a 41 °C water bolus. A relatively high water bolus temperature was chosen because the tumor starts at the level of the skin [Citation35]. shows the predicted 1 cc averaged SAR and temperature distributions for both the situation with the silicone implant and the reference situation. Because of the loss-less material, a negligible power absorption is observed in the implant itself. When calculating the temperature distribution the maximum temperature at the implant-tissue interface is 45.8 °C, which is about 2.5 °C higher compared to the maximum temperature for the reference situation without an implant (max 43.4 °C). This can cause serious overheating and clinical data have shown that to prevent thermal toxicity during superficial hyperthermia, the maximum temperature should not exceed 43.5 °C [Citation82].
Figure 9. Predicted SAR and temperature distributions in case of a silicone breast implant, compared to a reference situation (top) without a breast implant. A total amount of absorbed power of 15 W was assumed. The green and black contours in the SAR and temperature distributions represent the tumor target.
Therefore, adjustment of the power level would be necessary and shows predicted temperature volume histograms for the tumor target with adjusted power levels, such that the maximum overall tissue temperature does not exceed 43.5 °C. Predicted tumor T90 levels are 40.5 °C and 41.1 °C, for the reference case and with an implant, respectively. Scaled absorbed power levels were 15.4 W and 9.9 W, without and with an implant, respectively. Thus, adequate tumor heating is well feasible in the case of a silicone breast implant, but reducing the power levels would be necessary to avoid thermal toxicity. The maximum tolerable power level depends on numerous clinical factors, including also the reactive perfusion elevation. This maximum tolerated power is thus on forehand unknown and difficult to predict using standard (superficial) thermometry feedback only. Invasive thermometry is always recommended to monitor treatment quality since thermal dose parameters derived from invasively measured temperatures correlate with treatment outcome [Citation17]. Especially in case of a silicone breast implant, additional invasive thermometry probes at the tissue-implant interface are warranted for direct feedback during treatment to avoid thermal toxicity. These probes should be positioned as close as possible to the tissue-implant interface, depending on the local anatomy.
Figure 10. Predicted temperature volume histograms in case of a silicone breast implant, compared to a reference situation without a breast implant. Power was scaled such that the maximum temperature did not exceed 43.5 °C.
7. Discussion
This paper demonstrated how HTP can be used to facilitate clinical decision making. Clinical decision making in hyperthermia treatment delivery generally relies on the selection of hyperthermia applicators with appropriate effective field size and tissue penetration depth, followed by application of generalized treatment protocols and appropriate treatment control protocols. Treatment protocols are applied to ensure appropriate system settings (amplitude, phase, water bolus temperature) and a control protocol prescribes adjustments in case treatment limiting hot spots occur. Traditionally, these decisions are based on basic physics insights, even when increasingly supported by HTP. However, these basic physics insights may fall short for specific clinical cases. When more insight is needed than provided by standard treatment protocols, HTP can be a very valuable addition. We aimed to stimulate a general and accessible use of HTP in daily clinical practice. Therefore, basic simulation strategies were used, avoiding advanced optimization routines and dedicated tools that are often still under research and only available at a small number of research departments. It is not the rationale of this paper to provide guidelines or protocols on how HTP should be used, but to serve as illustration and inspiration on how HTP can be helpful in decision making and enhance insight in clinical routine. Seven problems that occur in daily clinical practice were presented and discussed. Although this number is not exhaustive, based on the examples shown in this paper, similar strategies can be formulated for individual clinical problems and when deemed necessary also adaptations to the proposed evaluation can be made, depending on the specific problem and/or the availability of more dedicated HTP tools.
7.1. Requirements on HTP modeling and validation for clinical decision making
Generic patient models derived from the Virtual Family data set were used in this paper to illustrate the use of HTP. However, patient-specific HTP is of course essential to account for the individual anatomy related to the problem, when using HTP in daily practice for clinical decision making. The patient anatomy largely determines the occurrence of hot spots and heating ability of the target, which is different from patient to patient. Therefore, presented results cannot be generalized, not even for problems identical to those discussed in this paper, and models for HTP predictions should always be generated from recent CT or MR scans of the patient (preferably in treatment position) to perform patient-specific simulations. Furthermore, to ensure reliable translation of HTP predictions to the clinic, it is important that the treatment setup and patient positioning considered in the simulations should match the actual treatment as close as possible [Citation83–85].
In this paper, we used Plan2Heat for HTP, but any other treatment planning or simulation package suitable for electromagnetic/thermal simulations could be used, such as Sigma HyperPlan (Dr. Sennewald Medizintechnik. GmbH), Sim4Life (SPEAG, Zurich, Switzerland), COMSOL (www.comsol.com), Ansys High Frequency Structural Simulator (HFSS; www.ansys.com) and CST STUDIO SUITE (www.cst.com). However, before starting clinical use, validation of any user-defined applicator model is essential. This requires the comparison of simulations with phantom or clinical measurements to verify that predicted patterns are correct within the measurement uncertainty [Citation86–89]. For relatively simple heating systems analytical solutions can be used for validation of the predicted heating patterns [Citation90].
Most clinical decision making applications presented in this paper involve applicator selection (cases 4–6) and pretreatment evaluation (cases 1, 2, 6, and 7). These applications require qualitatively correct predictions of the heating patterns and the use of a single well-defined patient anatomy. In these applications uncertainties in dielectric and thermal tissue properties, affecting the quantitative reliability of the absolute SAR/temperature levels predicted by HTP, are not a major issue and the qualitative reliability of HTP predictions is sufficient to compare different setups or treatment strategies. To evaluate whether patients are easy to heat or difficult to heat, as in case 2, it is essential that simulation results are compared to similar results and clinical data from the same institute, with the same tissue properties used for all HTP simulations. When applying adaptive HTP to suppress hot spots and improve treatment quality (case 3), additional validation is required demonstrating a correlation between measured and simulated changes in SAR/temperature after phase-amplitude steering [Citation38,Citation39].
7.2. HTP for other clinical cases and training purposes
As mentioned above, our seven cases were by no means exhaustive. Some other common clinical cases where HTP can be useful were not discussed in this paper as they had been discussed extensively in the literature. These include for example evaluation of the impact of the presence of metal wires or implants and adapting the heating depth by optimizing the water bolus temperature [Citation42,Citation43,Citation91]. Metal implants yield a risk of hot spots because of the high electrical conductivity. An HTP study thoroughly evaluated the impact of the presence of metal and silicone port-a-cath implants in the treatment region for superficial hyperthermia treatments [Citation43]. Results showed that a metal port-a-cath yields severe local SAR hot spots and tremendously affects the SAR coverage, independent of the location in the hyperthermia treatment field. A silicone port-a-cath was predicted to have a much lower impact on the treatment quality. Significant reduction of the effective treatment volume was only observed when the silicone port-a-cath was located centrally below the applicator. De Bruijne et al. evaluated the impact of sternum cerclage wires in the superficial hyperthermia treatment field [Citation42]. Based on HTP calculations, they concluded that cerclage wires are no contraindication for superficial hyperthermia, provided that the main E-field direction is parallel to the sternum; otherwise severe hot spots can be expected. The physics and risks of implant heating due to electromagnetic fields is extensively described in a review paper by Winter et al. [Citation92] They also show that one-dimensional implants yield a risk in case of RF heating, as these implants tend to exhibit the so-called antenna effect, i.e., a pronounced maximum of the scattered E-field at their distal ends. Most critical are implant lengths around a quarter to half the RF wavelength in tissue [Citation92].
Another issue in which HTP was demonstrated helpful in the literature is the selection of the appropriate water bolus temperature in order to achieve the desired heating depth for superficial hyperthermia. Bolus temperatures during superficial hyperthermia are typically around 40 °C. The optimal water bolus temperature depends on the target depth and whether the skin is involved or not. When using a relatively low bolus temperature (<40 °C), the superficial skin temperature is reduced, thereby shifting the maximum tissue temperature to a deeper location and thus increasing the effective heating depth. HTP can be very helpful to recommend a water bolus temperature such that optimal target coverage is expected [Citation35,Citation91]. Van der Gaag et al. performed an HTP study for superficial hyperthermia to develop guidelines for the water bolus temperature selection in clinical practice, based on the patient-specific target depth and applicator arrays used [Citation35]. In general, the optimal water bolus temperature was found to decrease with increasing number of applicators used in the antenna array, as well as with increasing target depth from the skin [Citation35]. For locoregional hyperthermia, more aggressive skin cooling is required and thus the bolus temperatures are much lower; usually between 10 °C and 20 °C [Citation51,Citation52]. When using capacitive heating systems, sometimes even extremely low bolus temperatures or dedicated overlay boluses with a temperature close to 0 °C are applied to reduce high temperatures in superficial fat layers that might result in treatment limiting hot spots [Citation93,Citation94]. Precooling can also be applied to reduce heating of the subcutaneous fat layers [Citation95,Citation96].
Basic HTP simulations have more applications besides clinical decision making. Well-trained technicians and physicians are essential to ensure good quality hyperthermia treatment delivery, but reaching this level of expertise generally requires a long learning curve. HTP can be a very effective education and training method to become more familiar with fundamental heating properties of different heating equipment. Simulation of phantom setups can provide essential insight in the generated heating patterns. In the case of a phased array system HTP can illustrate basic steering strategies. Evaluation of realistic treatment scenarios using HTP provides insight in treatment optimization. Therefore, realistic clinical examples, like the cases presented in this paper, would be very useful for training purposes.
7.3. Future perspectives regarding clinical use of HTP
Facilitating clinical decision making is an important and very useful application of HTP, but the ultimate goal in clinical use of HTP is full treatment guidance. This is very challenging and requires validation of the superiority of HTP-guided steering over experience-based steering in a clinical setting. Feasibility of SAR-based HTP-guided steering was demonstrated by a cross-over trial comparing HTP-guided steering and steering based on empirical steering guidelines [Citation78]. Comparable tumor temperatures for both HTP-guided steering and empirical steering were registered in the first half of the treatment sessions in the treatment course. However, about 0.5 °C lower tumor temperatures were registered with HTP-based steering in the second half of the treatment sessions. This might be due to anatomical changes during the treatment course, that are not reflected by the planning CT scan made at the start of treatment.
Practical and robust re-optimization methods are thus needed for on-line use during hyperthermia treatments. Adaptive HTP considers changes in SAR/temperature as a result of phase-amplitude steering, rather than absolute SAR/temperature levels, which makes HTP less sensitive to e.g., uncertainties in dielectric properties [Citation39]. Correlations between measured and simulated changes in SAR/temperature have been demonstrated, both at the start of treatment and during the steady state period [Citation38,Citation39]. Feasibility of temperature-based adaptive HTP to suppress treatment limiting hot spots was demonstrated in a study with eight patients with pelvic tumors treated with the AMC-4/AMC-8 system. HTP was used to determine alternative system settings in case of hot spot complaints and results showed that all patient-reported hot spots were resolved with minimal changes in the measured tumor temperatures. An additional feasibility study in three patients, yielding a representative patient selection regarding both patient sizes (slender/thin vs. obese) and tumor location (central vs. eccentric), demonstrated that on-line adaptive HTP can realize an improvement in measured tumor temperatures by at least 0.5 °C [Citation77]. Further research is ongoing to evaluate the effectivity of on-line HTP during clinical hyperthermia.
8. Conclusion
Insight and decision-making in daily clinical problems or questions for superficial and locoregional hyperthermia, can be greatly enhanced and facilitated by the use of basic HTP simulations. Applications include for example: selection of adequate phase settings, heating ability analysis, hot spot suppression, applicator selection, evaluation of target coverage and heating depth, and predicting possible thermal toxicity in case of an implant. HTP is not yet sufficiently quantitatively reliable to predict exact SAR and temperature levels, but the present qualitative reliability can be supportive to formulate adequate treatment strategies, especially in cases where more insight is needed than provided by standard treatment protocols. Furthermore, HTP can help to design treatment protocols and is an effective tool for education and training for hyperthermia technicians and physicians, to become more familiar with fundamental heating properties of different heating equipment and provide insight in treatment optimization. This way, HTP provides a meaningful and clinically relevant contribution to maintaining and improving treatment quality.
Acknowledgments
The authors would like to thank B. Zilles and Dr. M. Göger-Neff from the University Hospital LMU Munich, Department of Medicine III, for reading the manuscript.
Disclosure statement
No potential conflict of interest was reported by the author(s).
Additional information
Funding
References
- Overgaard J, González González D, Hulshof MCCM, et al. Randomised trial of hyperthermia as adjuvant to radiotherapy for recurrent or metastatic malignant melanoma. European Society for Hyperthermic Oncology. Lancet. 1995;345(8949):540–543.
- Vernon CC, Hand JW, Field SB, et al. Radiotherapy with or without hyperthermia in the treatment of superficial localized breast cancer: results from five randomized controlled trials. International Collaborative Hyperthermia Group. Int J Radiat Oncol Biol Phys. 1996;35:731–744.
- Van der Zee J, González González D, Van Rhoon GC, et al. Comparison of radiotherapy alone with radiotherapy plus hyperthermia in locally advanced pelvic tumours: a prospective, randomised, multicentre trial. Dutch Deep Hyperthermia Group. Lancet. 2000;355(9210):1119–1125.
- Issels RD, Lindner LH, Verweij J, et al. Effect of neoadjuvant chemotherapy plus regional hyperthermia on long-term outcomes among patients with localized high-risk soft tissue sarcoma: the EORTC 62961-ESHO 95 randomized clinical trial. JAMA Oncol. 2018;4(4):483–492.
- Huilgol NG, Gupta S, Sridhar CR. Hyperthermia with radiation in the treatment of locally advanced head and neck cancer: a report of randomized trial. J Can Res Ther. 2010;6(4):492–496.
- Notter M, Piazena H, Vaupel P. Hypofractionated re-irradiation of large-sized recurrent breast cancer with thermography-controlled, contact-free water-filtered infra-red-A hyperthermia: a retrospective study of 73 patients. Int J Hyperthermia. 2017;33(2):227–236.
- Chi MS, Yang KL, Chang YC, et al. Comparing the effectiveness of combined external beam radiation and hyperthermia versus external beam radiation alone in treating patients with painful bony metastases: a phase 3 prospective, randomized, controlled trial. Int J Radiat Oncol Biol Phys. 2018;100(1):78–87.
- Kok HP, Cressman ENK, Ceelen W, et al. Heating technology for malignant tumors: a review. Int J Hyperthermia. 2020;37(1):711–741.
- Paulides MM, Dobsicek Trefna H, Curto S, et al. Recent technological advancements in radiofrequency- and microwave-mediated hyperthermia for enhancing drug delivery. Adv Drug Deliv Rev. 2020;163–164:3–18.
- Gabriele P, Ferrara T, Baiotto B, et al. Radio hyperthermia for re-treatment of superficial tumours. Int J Hyperthermia. 2009;25(3):189–198.
- Puric E, Heuberger J, Lomax N, et al. The benefit of thermoradiotherapy in the treatment of superficially localized tumors: experience with BSD 500 microwave hyperthermia system. Strahlentherapie Und Onkologie. 2009;185:648–648.
- Zweije R, Kok HP, Bakker A, et al. Technical and clinical evaluation of the ALBA-4D 70MHz loco-regional hyperthermia system. Proceedings of the 48th European Microwave Conference. 2018. p. 328–331.
- Fatehi D, van Rhoon GC. SAR characteristics of the Sigma-60-Ellipse applicator. Int J Hyperthermia. 2008;24(4):347–356.
- Van Rhoon GC, Van Der Heuvel DJ, Ameziane A, et al. Characterization of the SAR-distribution of the Sigma-60 applicator for regional hyperthermia using a Schottky diode sheet. Int J Hyperthermia. 2003;19(6):642–654.
- Abe M, Hiraoka M, Takahashi M, et al. Multi-institutional studies on hyperthermia using an 8-MHz radiofrequency capacitive heating device (Thermotron RF-8) in combination with radiation for cancer therapy. Cancer. 1986;58(8):1589–1595.
- Franckena M, Fatehi D, de Bruijne M, et al. Hyperthermia dose-effect relationship in 420 patients with cervical cancer treated with combined radiotherapy and hyperthermia. Eur J Cancer. 2009;45(11):1969–1978.
- Bakker A, Van der Zee J, van Tienhoven G, et al. Temperature and thermal dose during radiotherapy and hyperthermia for recurrent breast cancer are related to clinical outcome and thermal toxicity: a systematic review. Int J Hyperthermia. 2019;36(1):1024–1039.
- Overgaard J, Gonzalez DG, Hulshof MCCH, et al. Hyperthermia as an adjuvant to radiation therapy of recurrent or metastatic malignant melanoma. A multicentre randomized trial by the European Society for Hyperthermic Oncology. International Journal of Hyperthermia. 1996;12(1):3–20.
- Wust P, Rau B, Gellerman J, et al. Radiochemotherapy and hyperthermia in the treatment of rectal cancer. Recent Results Cancer Res. 1998;146:175–191.
- Rau B, Wust P, Tilly W, et al. Preoperative radiochemotherapy in locally advanced or recurrent rectal cancer: regional radiofrequency hyperthermia correlates with clinical parameters. Int J Radiat Oncol Biol Phys. 2000;48(2):381–391.
- Kroesen M, Mulder HT, Van Holthe JML, Aangeenbrug AA, et al. Confirmation of thermal dose as a predictor of local control in cervical carcinoma patients treated with state-of-the-art radiation therapy and hyperthermia. Radiother Oncol. 2019;140:150–158.
- Stoll AM, Greene LC. Relationship between pain and tissue damage due to thermal radiation. J Appl Physiol. 1959;14(3):373–382.
- Yarmolenko PS, Moon EJ, Landon C, et al. Thresholds for thermal damage to normal tissues: an update. Int J Hyperthermia. 2011;27(4):320–343.
- Trefna HD, Crezee H, Schmidt M, et al. Quality assurance guidelines for superficial hyperthermia clinical trials: I. Clinical requirements. International Journal of Hyperthermia. 2017;33(4):471–482.
- Bruggmoser G, Bauchowitz S, Canters R, et al. Guideline for the clinical application, documentation and analysis of clinical studies for regional deep hyperthermia: quality management in regional deep hyperthermia. Strahlenther Onkol. 2012;188(Suppl 2):198–211.
- Stakhursky VL, Arabe O, Cheng KS, et al. Real-time MRI-guided hyperthermia treatment using a fast adaptive algorithm. Phys Med Biol. 2009;54(7):2131–2145.
- Datta NR, Kok HP, Crezee H, et al. Integrating loco-regional hyperthermia into the current oncology practice: SWOT and TOWS analyses. Front Oncol. 2020;10:819.
- Gellermann J, Hildebrandt B, Issels R, et al. Noninvasive magnetic resonance thermography of soft tissue sarcomas during regional hyperthermia: correlation with response and direct thermometry. Cancer. 2006;107(6):1373–1382.
- Gellermann J, Wlodarczyk W, Hildebrandt B, et al. Noninvasive magnetic resonance thermography of recurrent rectal carcinoma in a 1.5 Tesla hybrid system. Cancer Res. 2005;65(13):5872–5880.
- van Rhoon GC, Wust P. Introduction: non-invasive thermometry for thermotherapy. Int J Hyperthermia. 2005;21(6):489–495.
- Kok HP, Wust P, Stauffer PR, et al. Current state of the art of regional hyperthermia treatment planning: a review. Radiat Oncol. 2015;10:196
- De Greef M, Kok HP, Correia D, et al. Uncertainty in hyperthermia treatment planning: the need for robust system design. Phys Med Biol. 2011;56(11):3233–3250.
- Wust P, Beck R, Berger J, et al. Electric field distributions in a phased-array applicator with 12 channels: measurements and numerical simulations. Med Phys. 2000;27(11):2565–2579.
- Wust P, Weihrauch M. Hyperthermia classic commentary: 'Simulation studies promote technological development of radiofrequency phased array hyperthermia' by Peter Wust et al. International Journal of Hyperthermia 1996;12:477-494. Int J Hyperthermia. 2009;25(7):529–532.
- Van der Gaag ML, de Bruijne M, Samaras T, et al. Development of a guideline for the water bolus temperature in superficial hyperthermia. Int J Hyperthermia. 2006;22(8):637–656.
- Canters RA, Paulides MM, Franckena MF, van der Zee J, et al. Implementation of treatment planning in the routine clinical procedure of regional hyperthermia treatment of cervical cancer: an overview and the Rotterdam experience. Int J Hyperthermia. 2012;28(6):570–581.
- Kok HP, Korshuize - van Straten L, Bakker A, et al. Online adaptive hyperthermia treatment planning during locoregional heating to suppress treatment-limiting hot spots. Int J Radiat Oncol Biol Phys. 2017;99(4):1039–1047.
- Kok HP, Schooneveldt G, Bakker A, et al. Predictive value of simulated SAR and temperature for changes in measured temperature after phase-amplitude steering during locoregional hyperthermia treatments. Int J Hyperthermia. 2018;35(1):330–339.
- Kok HP, Ciampa S, De Kroon-Oldenhof R, et al. Toward on-line adaptive hyperthermia treatment planning: correlation between measured and simulated specific absorption rate changes caused by phase steering in patients. Int J Radiat Oncol Biol Phys. 2014;90(2):438–445.
- Kok HP, Crezee J. A comparison of the heating characteristics of capacitive and radiative superficial hyperthermia. Int J Hyperthermia. 2017;33(4):378–386.
- Kok HP, Navarro F, Strigari L, et al. Locoregional hyperthermia of deep-seated tumours applied with capacitive and radiative systems: a simulation study. Int J Hyperthermia. 2018;34(6):714–730.
- de Bruijne M, Wielheesen DH, Van der Zee J, et al. Benefits of superficial hyperthermia treatment planning: five case studies. Int J Hyperthermia. 2007;23(5):417–429.
- Trujillo-Romero CJ, Paulides MM, Drizdal T, et al. Impact of silicone and metal port-a-cath implants on superficial hyperthermia treatment quality. Int J Hyperthermia. 2015;31(1):15–22.
- Sreenivasa G, Gellermann J, Rau B, et al. Clinical use of the hyperthermia treatment planning system HyperPlan to predict effectiveness and toxicity. Int J Radiat Oncol Biol Phys. 2003;55(2):407–419.
- Kok HP, Crezee J. Hyperthermia treatment planning: clinical application and ongoing developments. IEEE J Electromagn RF Microwaves Med Biol. 2020. DOI:https://doi.org/10.1109/JERM.2020.3032838
- Li Z, Vogel M, Maccarini PF, et al. Improved hyperthermia treatment control using SAR/temperature simulation and PRFS magnetic resonance thermal imaging. Int J Hyperthermia. 2011;27(1):86–99.
- Prasad B, Kim JK, Kim S. Role of simulations in the treatment planning of radiofrequency hyperthermia therapy in clinics. J Oncol. 2019;2019:9685476
- Turner PF, Tumeh A, Schaefermeyer T. BSD-2000 approach for deep local and regional hyperthermia: physics and technology. Strahlenther Onkol. 1989;165(10):738–741.
- van Dijk JDP, Schneider CJ, van Os RM, et al. Results of deep body hyperthermia with large waveguide radiators. Adv Exp Med Biol. 1990;267:315–319.
- Gelvich EA, Mazokhin VN. Contact flexible microstrip applicators (CFMA) in a range from microwaves up to short waves. IEEE Trans Biomed Eng. 2002;49(9):1015–1023.
- Van Haaren PMA, Kok HP, Van den Berg CAT, et al. On verification of hyperthermia treatment planning for cervical carcinoma patients. Int J Hyperthermia. 2007;23(3):303–314.
- Fatehi D, van der Zee J, Van Rhoon GC. Intra-patient comparison between two annular phased array applicators, Sigma-60 and Sigma-Eye: applied RF powers and intraluminally measured temperatures. Int J Hyperthermia. 2011;27(3):214–223.
- The gentle power of hyperthermia TCS – Tumor Cell Solution for regional hyperthermia therapy. 2020. [cited 2020 Nov]. https://pdf.medicalexpo.com/pdf/celsius-42/tcs-tumor-cell-solution/121368-194331.html.
- Christ A, Kainz W, Hahn EG, et al. The virtual family-development of surface-based anatomical models of two adults and two children for dosimetric simulations . Phys Med Biol. 2010;55(2):N23–N38.
- Kok HP, Kotte ANTJ, Crezee J. Planning, optimisation and evaluation of hyperthermia treatments. Int J Hyperthermia. 2017;33(6):593–607.
- James BJ, Sullivan DM. Creation of 3-dimensional patient models for hyperthermia treatment planning. IEEE Trans Biomed Eng. 1992;39(3):238–242.
- Gabriel S, Lau RW, Gabriel C. The dielectric properties of biological tissues: II. Measurements in the frequency range 10 Hz to 20 GHz. Phys Med Biol. 1996;41(11):2251–2269.
- ESHO Taskgroup Committee. Treatment planning and modelling in hyperthermia, a task group report of the European Society for Hyperthermic Oncology. Rome (Italy): Tor Vergata; 1992.
- Berenger JP. A perfectly matched layer for the absorption of electromagnetic-waves. Comput Phys. 1994;114(2):185–200.
- Kroeze H, van de Kamer JB, de Leeuw AA, et al. Treatment planning for capacitive regional hyperthermia. Int J Hyperthermia. 2003;19(1):58–73.
- de Bree J, van der Koijk JF, Lagendijk JJW. A 3-D SAR model for current source interstitial hyperthermia. IEEE Trans Biomed Eng. 1996;43(10):1038–1045.
- Pennes HH. Analysis of tissue and arterial blood temperatures in the resting human forearm. J Appl Physiol. 1948;1(2):93–122. 1948.
- Cheng KS, Yuan Y, Li Z, et al. The performance of a reduced-order adaptive controller when used in multi-antenna hyperthermia treatments with nonlinear temperature-dependent perfusion. Phys Med Biol. 2009;54(7):1979–1995.
- Hasgall PA, Di Gennaro F, Baumgarter C, et al. IT’IS database for thermal and electromagnetic parameters of biological tissues. Version 3.0. 2015. www.itis.ethz.ch/database.
- Yuan Y, Cheng KS, Craciunescu OI, et al. Utility of treatment planning for thermochemotherapy treatment of nonmuscle invasive bladder carcinoma. Med Phys. 2012;39(3):1170–1181.
- Schooneveldt G, Dobsicek Trefna H, Persson M, et al. Hyperthermia treatment planning including convective flow in cerebrospinal fluid for brain tumour hyperthermia treatment using a novel dedicated paediatric brain applicator. Cancers (Basel. 2019;11(8):1183.
- Gavazzi S, van Lier A, Zachiu C, et al. Advanced patient-specific hyperthermia treatment planning. Int J Hyperthermia. 2020;37(1):992–1007.
- Canters RAM, Franckena M, van der Zee J, et al. Optimizing deep hyperthermia treatments: are locations of patient pain complaints correlated with modelled SAR peak locations? Phys Med Biol. 2011;56(2):439–451.
- Canters RA, Wust P, Bakker JF, et al. A literature survey on indicators for characterisation and optimisation of SAR distributions in deep hyperthermia, a plea for standardisation. Int J Hyperthermia. 2009;25(7):593–608.
- Lee HK, Antell AG, Perez CA, et al. Superficial hyperthermia and irradiation for recurrent breast carcinoma of the chest wall: prognostic factors in 196 tumors. Int J Radiat Oncol Biol Phys. 1998;40(2):365–375.
- Myerson RJ, Perez CA, Emami B, et al. Tumor control in long-term survivors following superficial hyperthermia. Int J Radiat Oncol Biol Phys. 1990;18(5):1123–1129.
- Rijnen Z, Bakker JF, Canters RA, et al. Clinical integration of software tool VEDO for adaptive and quantitative application of phased array hyperthermia in the head and neck. Int J Hyperthermia. 2013;29(3):181–193.
- Crezee J, Zweije R, and, Kok HP. Patient-specific set-up procedures for treatment optimisation in locoregional hyperthermia. 14th European Conference on Antennas and Propagation (EuCAP), Copenhagen, Denmark, 2020. p. 1–5.
- Lutgens LC, Koper PC, Jobsen JJ, et al. Radiation therapy combined with hyperthermia versus cisplatin for locally advanced cervical cancer: results of the randomized RADCHOC trial. Radiother Oncol. 2016;120(3):378–382.
- Beck M, Ghadjar P, Weihrauch M, et al. Regional hyperthermia of the abdomen, a pilot study towards the treatment of peritoneal carcinomatosis. Radiat Oncol. 2015;10:157
- Fatehi D, van der Zee J, de Bruijne M, et al. RF-power and temperature data analysis of 444 patients with primary cervical cancer: deep hyperthermia using the Sigma-60 applicator is reproducible. Int J Hyperthermia. 2007;23(8):623–643.
- Kok HP, Korshuize-van Straten L, Bakker A, et al. Feasibility of on-line temperature-based hyperthermia treatment planning to improve tumour temperatures during locoregional hyperthermia. Int J Hyperthermia. 2018;34(7):1082–1091.
- Franckena M, Canters R, Termorshuizen F, et al. Clinical implementation of hyperthermia treatment planning guided steering: a cross over trial to assess its current contribution to treatment quality. Int J Hyperthermia. 2010;26(2):145–157.
- Hiraoka M, Jo S, Akuta K, et al. Radiofrequency capacitive hyperthermia for deep-seated tumors. I. Studies on thermometry. Cancer. 1987;60(1):121–127.
- Van Rhoon GC. External electromagnetic methods and devices. In: Moros EG, Hendee WR, editors. Physics of thermal therapy: fundamentals and clinical applications. Boca Raton (FL): CRC Press, Taylor & Francis Group; 2013. p. 139–158.
- Drizdal T, Paulides MM, van Holthe N, et al. Hyperthermia treatment planning guided applicator selection for sub-superficial head and neck tumors heating. Int J Hyperthermia. 2018;34(6):704–713.
- Bakker A, Kolff MW, Holman R, et al. Thermal skin damage during reirradiation and hyperthermia is time-temperature dependent. Int J Radiat Oncol Biol Phys. 2017;98(2):392–399.
- Canters RA, Franckena M, Paulides MM, et al. Patient positioning in deep hyperthermia: influences of inaccuracies, signal correction possibilities and optimization potential. Phys Med Biol. 2009;54(12):3923–3936.
- Aklan B, Gierse P, Hartmann J, et al. Influence of patient mispositioning on SAR distribution and simulated temperature in regional deep hyperthermia. Phys Med Biol. 2017;62(12):4929–4945.
- De Greef M, Kok HP, Bel A, et al. 3D versus 2D steering in patient anatomies: a comparison using hyperthermia treatment planning. Int J Hyperthermia. 2011;27(1):74–85.
- Van Haaren P, Kok P, Van Stam G, et al. SAR measurements and FDTD calculations in inhomogeneous phantom models. 9th International Congress on Hyperthermic Oncology, St. Louis, USA, 2004. Abstracts. p. 167.
- Wiersma J, van Dijk JDP. RF hyperthermia array modelling; validation by means of measured EM-field distributions. Int J Hyperthermia. 2001;17(1):63–81.
- Kok HP, Correia D, De Greef M, et al. SAR deposition by curved CFMA-434 applicators for superficial hyperthermia: measurements and simulations. Int J Hyperthermia. 2010;26:171–184.
- Gellermann J, Wust P, Stalling D, et al. Clinical evaluation and verification of the hyperthermia treatment planning system hyperplan. Int J Radiat Oncol Biol Phys. 2000;47(4):1145–1156.
- Kroeze H, Kokubo M, van de Kamer JB, et al. Comparison of a capacitive and a cavity slot radiative applicator for regional hyperthermia. Jpn J Hyperthermic Oncol. 2002;18(2):75–91.
- Kok HP, Groen J, Bakker A, et al. Modelling Curved contact flexible microstrip applicators for patient-specific superficial hyperthermia treatment planning. Cancers (Basel. 2020;12(3):656.
- Winter L, Seifert F, Zilberti L, et al. MRI-related heating of implants and devices: a review. J Magn Reson Imaging. 2020. DOI:https://doi.org/10.1002/jmri.27194
- Ohguri T, Imada H, Yahara K, et al. Effect of 8-MHz radiofrequency-capacitive regional hyperthermia with strong superficial cooling for unresectable or recurrent colorectal cancer. Int J Hyperthermia. 2004;20(5):465–475.
- Kato H, Hyodo K, Akasaka N, et al. Optimization of bolus for capacitive type heating. Jpn J Hyperthermic Oncol. 1997;13(1):10–17.
- Rhee JG, Lee CK, Osborn J, et al. Precooling prevents overheating of subcutaneous fat in the use of RF capacitive heating. Int J Radiat Oncol Biol Phys. 1991;20(5):1009–1015.
- van Rhoon GC, van der Zee J, Broekmeyer-Reurink MP, et al. Radiofrequency capacitive heating of deep-seated tumours using pre-cooling of the subcutaneous tissues: results on thermometry in Dutch patients. Int J Hyperthermia. 1992;8(6):843–854.