
Abstract
Objective
To evaluate the role of quantitative MRI parameters in predicting HIFU ablation results for uterine fibroids.
Material and methods
A total of 245 patients with uterine fibroids who underwent HIFU treatment in Chongqing Haifu Hospital were reviewed retrospectively. The patients were divided into two groups according to the non-perfused volume (NPV) ratio which was either higher or lower than 80%. The MRI parameters were measured, and a logistical regression analysis was performed to investigate the potential predictors associated with the NPV ratio. Receiver operating characteristics (ROC) analysis was used to determine the cut off value for MRI parameters in predicting a high NPV ratio.
Results
The subcutaneous fat thickness in the group of patients with an NPV ratio over 80% was significantly thinner than that in the group of patients with an NPV ratio less than 80% (15 mm versus 21 mm). The signal intensity ratio of fibroids to skeletal muscle on T2WI was significantly lower in the group of patients with an NPV ratio over 80% compared with the group with an NPV ratio lower than 80% (2.46 versus 3.23). The signal intensity ratio of fibroid to skeletal muscle correlated negatively with the NPV ratio and positively with the energy efficiency factor (EEF). The cut off value of signal intensity ratio of fibroid to muscle for predicting the NPV ratio over 80% is 3.045.
Conclusion
The signal intensity ratio of fibroid to skeletal muscle on T2WI can be used as a factor for predicting the effectiveness of HIFU ablation of uterine fibroids.
Introduction
Uterine fibroids are the most common benign gynecological tumors in women of reproductive age. The prevalence of uterine fibroids varies across races and ranges from 20% to 80% [Citation1]. Approximately half the patients have symptoms of menorrhagia, pelvic pain or infertility. Conventional treatment for uterine fibroids includes hysterectomy, myomectomy, and uterine artery embolization (UAE) [Citation2,Citation3]. Hysterectomy is a definitive treatment for uterine fibroids. However, it is not suitable for patients who wish to retain their uterus. Myomectomy is a treatment of choice for patients wishing to conceive, but the reintervention rate is high [Citation4]. Uterine artery embolization (UAE) is an alternative treatment for uterine fibroids but severe adverse effects have limited its application [Citation5]. High-intensity focused ultrasound (HIFU) has been widely used as a noninvasive treatment in the management of uterine fibroids. Previous studies have demonstrated that this technique is safe and effective in the treatment of uterine fibroids [Citation6–8]. However, in clinical practice, it was found that HIFU is not suitable for some patients. Therefore, optimization of these indicators is the key to achieving better results.
Magnetic resonance imaging (MRI) offers the best soft tissue resolution. It plays an important role not only in the diagnosis of uterine fibroids but also in patient selection and the evaluation of HIFU treatment results. Certain studies have demonstrated that the non-perfused volume ratio is related to long-term symptom relief [Citation9–11]. Further studies have shown that the signal intensity of the fibroids on T2-weighted imaging (T2WI), and the degree of contrast enhancement of the uterine fibroids, can be used as determining factors in predicting the efficacy of HIFU treatment [Citation9–14]. However, the signal intensity on T2WI and the degree of contrast enhancement were mainly evaluated on a visual level in previous studies; this is not a quantitative judgment and may lead to inaccurate results [Citation15]. Recently, several studies have investigated the role of dynamic contrast-enhanced (DCE) parameters and quantitative signal intensity in predicting HIFU treatment outcomes. The quantitative values may be affected by various parameter settings and by interval between the injection of the contrast media and the commencement of scanning [Citation10,Citation14,Citation16]. Therefore, it is beneficial to adopt the signal intensity ratio of fibroid to skeletal muscle on T2WI and contrast enhancement ratio of fibroid to myometrium to investigate the role of the quantitative MRI parameters in predicting HIFU ablation results.
Materials and methods
The protocol for this retrospective study was approved by the ethics committee at our institute and the requirement for informed consent was waived.
Patients
A total of 245 patients with symptomatic uterine fibroids, who underwent HIFU treatment in Chongqing Haifu Hospital from January 2016 to May 2018, were reviewed retrospectively.
Inclusion criteria were the following: (1) patients had symptomatic fibroids requiring treatment; (2) patients could lie in a prone-position for at least 1 h and were able to communicate with the nurse or physician during the procedure; (3) the size of the dominant fibroid was smaller than 15 cm in diameter.
Exclusion criteria: (1) menstruating, pregnant, or lactating women; (2) patients with contraindications to MRI (allergic to contrast, metal foreign bodies in treatment area, e.g., IUCD, Filshie clips); (3) patients with suspected or confirmed uterine malignancy.
Based on the NPV ratio, the patients were divided into two groups: (1) group 1: patients with an NPV ratio equal to or greater than 80%; (2) group 2: patients with an NPV ratio lower than 80%.
MRI examinations
MR imaging examinations were performed using a Magnetom 1.5 T MR system (Umr570, United Imaging Company, Shanghai, China). Patients underwent MRI scans before and one day after HIFU treatment, using a standardized protocol.
T2-weighted imaging and T1-weighted imaging before and after administration of gadolinium were obtained in three planes. Typical parameters used for T2WI were as follows: TR 5300 ms/TE 88 ms, voxel size 1.7 × 0.75 × 5.0 mm, slice thickness 5 mm. Typical parameters used for T1WI were as follows: TR 214 ms/TE 10 ms, voxel size 1.13 × 0.79 × 5.0 mm, and slice thickness 5 mm. For contrast-enhanced images, T1-weighted VIBE-sequence started soon after an intravenous injection of gadolinium (0.1 mmol/kg of body weight, Gadovist, Bayer Schering Pharma, Germany). The parameters for contrast-enhanced images were as follows: TR 3.94 ms/TE 1.84 ms, voxel size 1.62 × 1.22 × 4.0 mm, and slice thickness 4 mm.
MRI assessment
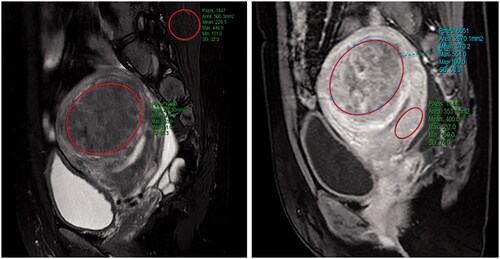
The following data were obtained: (1) baseline parameters of uterine fibroids, including the location of the uterus and fibroids, the volume of the uterus and fibroids, the distance from the ventral side of the fibroids to the abdominal skin, and the distance from the dorsal side of the fibroids to the sacrum and the abdominal wall thickness (); (2) the signal intensity parameters on T2WI included signal intensity value of uterine fibroids and skeletal muscle; the contrast-enhanced signal intensity value of uterine fibroids and the myometrium. For homogeneous fibroids, the regions of interest (ROIs) were drawn on the largest cross-section area along the outline of the fibroid. For heterogeneous fibroids, the degenerating areas and blood vessels in the fibroids were not drawn in the ROIs. Parameters for normal myometrium were calculated by three ROIs ().
Figure 1. Sagittal view of MRI from a patient with uterine fibroid showed subcutaneous fat thickness (a); abdominal wall thickness (b); distance from the posterior surface of fibroid to the sacrococcyx (c).
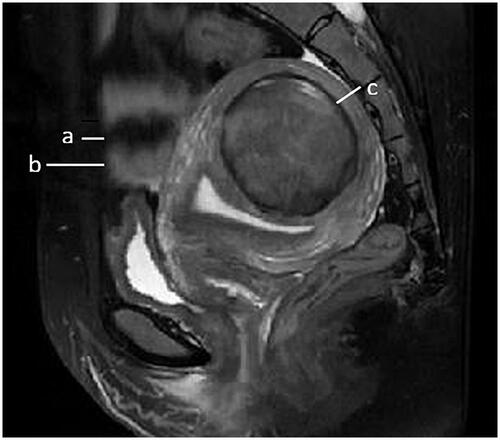
Figure 2. The measurements of MR parameters. A quantitative MR image was analyzed drawing an ROI within area of the fibroid, skeletal muscle, and the myometrium on one of the MR images. The software automatically calculate the quantitative parameters. (A) Signal intensity value of uterine fibroids and skeletal muscle; (B) the contrast-enhance signal intensity value of uterine fibroids and the myometrium.
High-intensity focused ultrasound ablation
HIFU treatment was performed under conscious sedation. A JC 200 HIFU tumor therapeutic system (Chongqing Haifu Medical Technology, Chongqing, China) was used for the procedure. This system contains an ultrasound imaging device (MyLab 70, Esaote, Genova, Italy) situated in the center of the transducer, to provide real-time imaging for monitoring the treatment. The patients were placed in a prone position, with the abdominal wall immersed in degassed water. The treatment began on the inferior surface of the fibroid, moved toward the superior surface, and then from the posterior area to the anterior area of the fibroid. The focus was kept at least 1.5 cm away from the endometrium and boundary of the fibroid. During the procedure, the sonication power was regulated according to the feedback from the patient and the changing grayscale on the ultrasound imaging. The treatment was terminated when the hyperechoic area covered the entire fibroid, or the enhanced ultrasound showed no blood flow in the fibroid. Sonication power, treatment time (defined as the time from the first sonication to the last sonication), sonication time, treatment intensity (seconds of sonification per hour of treatment), and treatment efficiency (mm3/s, ablated volume per second) were recorded.
Statistical analysis
The data were analyzed using SPSS software (SPSS21.0, IBM Company, Chicago, IL). The normally distributed data are reported using mean ± standard deviation; the skewed data distribution was reported using the median and the interquartile range. Comparisons of baseline characteristics of the fibroids, HIFU treatment parameters, and therapeutic results between both groups were performed using Chi-square test, Fisher exact tests, or Mann–Whitney U test, respectively. A linear regression analysis model was created using energy efficiency factor (EEF) to predict the difficulty of HIFU treatment. Logistical regression analysis was carried out on baseline parameters, T2WI signal intensity ratio, and contrast enhanced T1WI signal intensity ratio, to investigate the potential predictors for an NPV ratio. Receiver operating characteristic (ROC) curve analysis was performed to determine the best parameter for predicting the ablation efficacy and for seeking an optimal cut off value to predict the NPV ratio of 80%. A p < 0.05 was defined as statistically significant.
Results
Baseline characteristics
The characteristics of the 245 patients enrolled in this study are shown in . The median subcutaneous fat thickness in the group of patients with NPV ratio equal to or greater than 80% was 15 (range: 4–19) mm, while it was 21 (range: 4–42) mm in the group of patients with an NPV ratio less than 80%. The subcutaneous fat thickness was significantly thinner in the group of patients with an NPV ratio equal to or greater than 80%. The median signal intensity ratio of fibroid to skeletal muscle on T2WI was 2.46 (range: 1.0–80) in the group of patients with an NPV ratio equal to or greater than 80%, and it was 3.23 (range: 0.6–6.5) in the group of patients with an NPV ratio lower than 80%. The signal intensity ratio of fibroids to skeletal muscle on the T2WI was significantly lower in the group of patients with an NPV ratio equal to or greater than 80%, compared to the group of patients with an NPV ratio lower than 80%. No other significant differences in baseline characteristics were observed between the two groups.
Table 1. Comparison of baseline characteristics between patients with an NPV ratio equal to or greater than 80% and patients with an NPV ratio less than 80%.
HIFU ablation evaluation
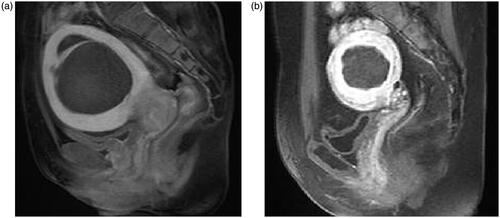
After one session of HIFU treatment, an NPV ratio equivalent to or greater than 80% was achieved in the fibroids of 147 patients. The remaining 98 patients had an NPV ratio lower than 80%. The median NPV ratio in the group of patients with an NPV ratio equivalent to or greater than 80% was 94.7% (range: 80–100%), while it was 67.1% (range: 6.3–79.9%) in the patients with an NPV ratio of less than 80% ().
Figure 3. T1-weighted MR image obtained one day after HIFU treatment. (a) NPV ratio of at least 80%; (b) NPV ratio less than 80%.
The median acoustic sonication power used was 400 W in both groups. The median treatment time measured from the first sonication to the last sonication was 60 (range: 15–220) min in the group of patients with an NPV ratio equal to or greater than 80%, while it was 80 (range: 20–203) min in the group of patients with an NPV ratio lower than 80%. The median sonication time was 519 (range: 130–2401) s in the group with an NPV ratio equal to or greater than 80%, while it was 811 (range: 150–3000) s in the group with an NPV ratio lower than 80% (p < 0.005). The median sonication energy used for the fibroids in the group with an NPV ratio equal to or greater than 80% was 207.6 (range: 52–960.4) kJ, while it was 324.6 (range: 60–1200) kJ in the group of patients with an NPV ratio lower than 80% (p < 0.005). The treatment efficiency was 601 (range: 243–1162) cm3/h in the group of patients with an NPV ratio equal to or greater than 80%, and it was 625 (range: 256–1194) cm3/h in the group of patients with an NPV ratio lower than 80%. The energy efficiency factor (EEF) was 1.57 (range: 0.06–17.56) J/mm3 in the group of patients with an NPV ratio equal to or greater than 80%, and it was 2.52 (range: 0.17–81.12) J/mm3 in the group of patients with an NPV ratio lower than 80% (p < 0.05) ().
Table 2. Comparison of HIFU treatment results between patients with an NPV ratio equal to or greater than 80% and patients with an NPV ratio less than 80%.
Analysis of factors influencing NPV ratio
In this model, data were suitable for logistical regression analysis. To divide the data into two groups, an NPV ratio of 80% was set as a dependent variable.
Factors that could possibly affect each group’s treatment results are the following: baseline characteristics of patients, signal intensity ratio of fibroid to skeletal muscle on T2WI, and ratio of relative enhancement of fibroid to myometrium. These were set as independent variables. The results of logistical analysis revealed that T2WI signal intensity ratio of fibroid to skeletal muscle was a significant predictor. Uterine fibroids with a higher T2WI signal intensity ratio of fibroid to skeletal muscle predicted a lower NPV ratio ().
Table 3. Logistical analysis of independent factors associated with an NPV ratio equal to or greater than 80% and an NPV ratio less than 80%.
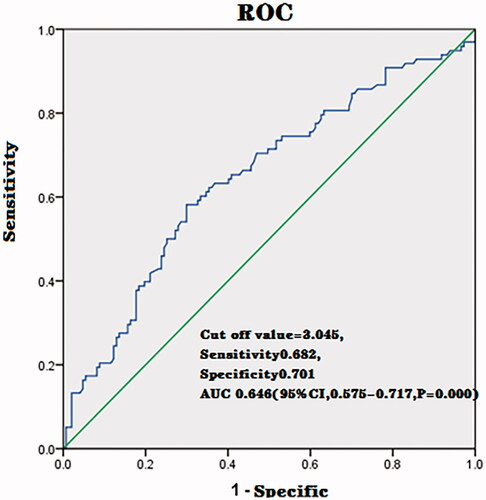
The ROC analysis revealed that the cut off value for predicting the achievement of NPV ratio of at least 80% was 3.045 (AUC, 0.646; sensitivity, 0.682; specificity, 0.701; 95%CI, 0.575–0.717, p = 0.000) ().
Figure 4. The ROC curves of the prediction model in predicting the treatment outcome of HIFU ablation with an immediate NPV ratio of at least 80%.
Relationship between the influencing factors and EEF
EEF is a factor often used to evaluate the difficulty in HIFU treatment. We further considered EEF as a dependent variable; these factors include age, BMI, abdominal wall thickness, abdominal wall scar, volume of fibroid lesion, the distance from the dorsal surface of the uterine fibroid lesion to the sacrum, locations of fibroid and uterus, T2 signal intensity ratio of fibroid to skeletal muscle. CE-T1 ratio of fibroid to myometrium was used as an independent variable to build a multiple linear regression model. The results of the analysis showed that there was a positive linear relationship between the EEF and T2 signal intensity ratio of fibroid to skeletal muscle; and a negative linear relationship between the EEF and the volume of the fibroid ().
Table 4. Coefficient of multivariable regression model of EEF.
External validation
To validate the model, we prospectively enrolled 78 patients from Suining Central Hospital, Mianyang Central Hospital, and Third Xiangya Hospital of Central South University between November 2020 and December 2020. The baseline characteristics are summarized in .
Table 5. Comparison of baseline characteristics between the internal and external group of patients.
According to the cut off value of signal intensity ratio of fibroid to skeletal muscle obtained in the model, 39 patients had a signal intensity ratio of fibroid to skeletal muscle greater than 3.045, while the remaining 39 patients had a signal intensity ratio of fibroid to skeletal muscle equivalent to or lower than 3.045. We further compared the HIFU treatment parameters, as shown in . The median acoustic sonication power used was 400 W in both groups. The median treatment time was 85 (range: 17–203) min in the group of patients with signal intensity ratio of fibroid to skeletal muscle equivalent to or greater than 3.045, while it was 53 (range: 26–131) min in the group of patients with a signal intensity ratio of fibroid to skeletal muscle equivalent to or lower than 3.045 (p < 0.05). The median sonication time was 900 (range: 136–3031) s in the group with a signal intensity ratio of fibroid to skeletal muscle greater than 3.045, while it was 461 (range: 166–1680) seconds in the group with a signal intensity ratio of fibroid to skeletal muscle equivalent to or lower than 3.045 (p < 0.005). The median sonication energy used for the fibroids in the group with a signal intensity ratio of fibroid to skeletal muscle greater than 3.045 was 360 (range: 39.9–1210) kJ, while it was160 (range: 36–672) kJ in the group of patients with a signal intensity ratio of fibroid to skeletal muscle equivalent to or lower than 3.045 (p < 0.005). The treatment efficiency was 605 (range: 300–990) cm3/h in the group of patients with a signal intensity ratio of fibroid to skeletal muscle greater than 3.045, and it was 483 (range: 301–1000) cm3/h in the group of patients with a signal intensity ratio of fibroid to skeletal muscle equivalent to or lower than 3.045. The EEF was 3.22 (range: 0.21–13.44) J/mm3 in the group of patients with a signal intensity ratio of fibroid to skeletal muscle greater than 3.045, and it was 1.28 (range: 0.07–9.62) J/mm3 in the group of patients with a signal intensity ratio of fibroid to skeletal muscle equivalent to or lower than 3.045 (p < 0.05). The average NPV ratio achieved in the group of patients with a signal intensity ratio of fibroid to skeletal muscle greater than 3.045 was 72.6% (range: 30.6–100%), while it was 89.4% (range: 57.3–100%) in the group of patients with a signal intensity ratio of fibroid to skeletal muscle equivalent to or lower than 3.045. A significant difference between the two groups in NPV ratio was observed (p < 0.05) ().
Table 6. Comparison of treatment results between patients with an SI ratio of fibroid to muscle greater than 3.045 and patients with an SI ratio of fibroid to muscle equal to or less than 3.045 in external validation group.
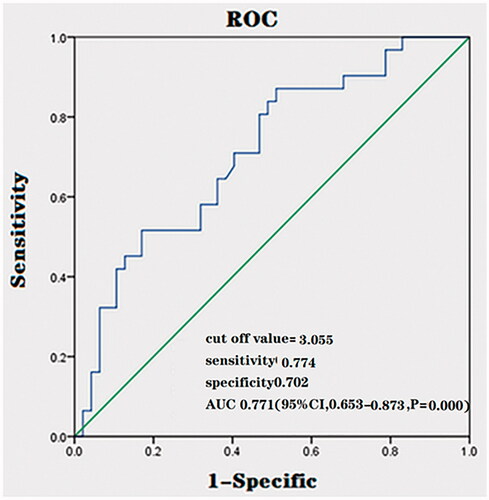
We also performed ROC analysis on the external validation data and it revealed that the cut off value for predicting an NPV ratio of at least 80% was 3.055 (AUC, 0.763; sensitivity, 0.774; specificity, 0.702; 95%CI, 0.653–0.873, p = 0.000) (). The ROC curves of the prediction model for the external validation cohort are similar to previous ROC curves of the prediction model that we established.
Figure 5. The ROC curves of the validation model in predicting the treatment outcome of HIFU with an immediate NPV ratio over 80%.
Discussion
The NPV ratio is considered as a predictor of long-term symptom relief in patients with uterine fibroids, following HIFU treatment. The previous studies have shown that several factors may affect the NPV ratio [Citation17,Citation18]. In this study, we divided the patients into two groups based on the NPV ratio. The NPV ratio was either lower or greater than 80%. In practice, we found a high NPV ratio can be achieved by delivering more acoustic energy during the HIFU treatment. Initially, a comparison between the HIFU treatment parameters within the two groups found that the median NPV ratio was 94.7% in the group of patients with an NPV ratio equal or greater than 80%, while it was just 67.1% in the group of patients with an NPV ratio lower than 80%. However, the treatment and sonication time was significantly shorter, the treatment efficiency, total energy used, and EEF was significantly less in the group of patients with an NPV ratio equal to or greater than 80% than that in the group of patients with an NPV ratio lower than 80%. The results, thus, indicated that the high NPV ratio achieved in the group with NPV ratio equal to or greater than 80% was more likely related to baseline characteristics, not the treatment parameters in this study.
MRI offers high resolution of soft tissue. The appearance of uterine fibroids on MRI varies according to the quantity of fibrous tissue and smooth skeletal muscle in the lesions. The previous studies on MRI suggested that the T2 signal intensity of the uterine fibroids is a crucial factor in reflecting heat deposition of HIFU [Citation19,Citation20]. Uterine fibroids with high T2 signal intensity are often considered to be cellular in type or have a rich blood supply [Citation21]. Based on the principle of HIFU ablation, tumors with less fibrous tissue and richer blood supply are less sensitive to HIFU, and, thus, more energy deposition is required at the focal point [Citation22]. A comparison was then made of the baseline characteristics of patients within the two groups and it was found that the signal intensity ratio of fibroid to skeletal muscle on T2WI was significantly lower in the group of patients with an NPV ratio equal to or greater than 80%, compared with the group of patients with an NPV ratio lower than 80%. Furthermore, the logistical analysis showed that the NPV ratio negatively correlated with the T2WI signal intensity ratio of fibroid to skeletal muscle. This is consistent with previous studies [Citation5,Citation17].
The abdominal wall thickness is another factor affecting the NPV ratio of HIFU treatment for uterine fibroids because the thick abdominal wall can cause attenuation of ultrasound beams [Citation16]. During HIFU treatment, the ultrasound beams penetrate through the cutaneous, subcutaneous, and other intermediate tissue layers before reaching the fibroid. Every interface in the acoustic pathway may cause reflection and scattering of ultrasound beams. The deeper the ultrasound goes, the more acoustic energy lost [Citation23]. In this study, we found the patients with thinner subcutaneous fat thickness were more likely to achieve a high NPV ratio. However, the logistical analysis showed no significant difference in subcutaneous fat thickness between the two groups. This phenomenon may be explained by the relatively small number of subjects in this study.
The main therapeutic effect of HIFU treatment for uterine fibroids is thermal effect [Citation24,Citation25]. Several studies have shown that the degree of perfusion on contrast-enhancement MRI has a negative relationship to the NPV ratio of fibroids [Citation18,Citation19,Citation26,Citation27]. The characteristics of blood perfusion in uterine fibroids were assessed subjectively by comparing the enhancement intensity of the fibroid and myometrium. This may be affected by some subjective factors and is, thus, unable to directly reflect perfusion. Therefore, it is important to accurately assess blood perfusion of uterine fibroids before HIFU to predict the ablative outcome of the fibroids. In clinical practice, the multiple-phase contrast-enhanced MRI is still a standard scan in most hospitals. In this study, we quantify the enhancement intensity of fibroid and myometrium and calculate the enhancement ratio of fibroid to myometrium, to investigate the relationship between the blood supply and HIFU ablation efficacy. However, we did not find a significant difference between the two groups. It may be caused by the manual injection of Gd-contrast medium in this study, which might have affected the results.
The ROC curve analysis was performed to estimate the probability of a patient achieving an NPV ratio of at least 80% in HIFU treatment of uterine fibroids. The results indicated that the T2WI signal intensity ratio was the best indicator for predicting treatment efficacy. In this study, the cut off value of the signal intensity ratio of fibroid to skeletal muscle was 3.045. If the signal intensity ratio of fibroid to skeletal muscle is lower than 3.045, it would be more likely to achieve an NPV ratio of over 80%. Therefore, the signal intensity ratio of fibroid to skeletal muscle can be used to predict the possibility of achieving an NPV ratio of at least 80%.
EEF is defined as the amount of ultrasound energy required to ablate 1 mm3 of uterine fibroid tissue. It can be considered as the quantitative index in determining a successful HIFU treatment for uterine fibroids. In this study, we found that EEF correlated negatively with the volume of fibroids, while it correlated positively with the signal intensity ratio of fibroid to skeletal muscle on T2WI. The negative correlation with the volume of fibroids can be explained by the so-called ‘damage-damage’ interference effects because the necrotic area in the fibroid changed the ‘acoustic environment’ of the fibroid and thus contributes to the ultrasonic energy deposition [Citation28]. On the other hand, the uterine fibroids with a high signal intensity ratio of fibroid to skeletal muscle on T2WI, are more difficult to treat with HIFU. It is also evident that even if more energy is delivered to the fibroid, with a high signal intensity ratio of fibroid to skeletal muscle, it remains difficult to achieve a high NPV ratio.
To validate this model, we performed an external validation. A total of 78 patients with uterine fibroids treated with HIFU in other hospitals were enrolled. The prediction performance was validated to have a comparatively high accuracy value. The mean NPV ratio of patients with a signal intensity ratio of fibroid to skeletal muscle greater than 3.045 was 72.6%, while a mean NPV ratio of 89.4% was achieved in the patients with a signal intensity ratio of fibroid to skeletal muscle equivalent to or lower than 3.045. Thus, the prediction model with the suggested cut off value tends to be reasonable in predicting the NPV ratio. We further performed ROC analysis on the external validation data. The ROC curves of the prediction model for the external validation cohort were similar to previous ROC curves of the prediction model that we established. The cut off value for predicting an NPV ratio of at least 80% was 3.055 (AUC, 0.763; sensitivity, 0.774; specificity, 0.702; 95%CI, 0.653–0.873, p = 0.000) in the ROC curves of the prediction model for the external validation cohort (). The prediction rate was higher in the ROC curves of the prediction model for the external validation cohort than in the previously established prediction model. Therefore, our results demonstrated that the prediction performance was validated. In this study, the prediction rate in the prediction model was low perhaps due to the interference of other related factors. Several studies have shown that subcutaneous fat thickness, location of the fibroids, and size of the fibroids may also be related to NPV ratio [Citation17,Citation18]. In clinical practice, other factors should be considered when using this model to predict the NPV ratio.
This study is limited because it is retrospective, and some unknown factors may affect the results. It is also limited because the HIFU treatment was performed by different doctors and thus some bias may occur. Third, the injection of Gd-contrast medium was manual which may affect the values of contrast enhancement. Therefore, a large-scale multicenter prospective study, with standard protocol, should be performed to confirm the findings. Furthermore, evidence from a systemic review or meta-analysis, including various validation studies, may be required to confirm the cut off values in predicting the ablation efficacy of HIFU.
In conclusion, the results demonstrate that there is a significant correlation between the quantitative MRI parameters of T2WI signal intensity ratio of fibroid to skeletal muscle and the immediate NPV ratio following the HIFU treatment of symptomatic uterine fibroids. The T2WI signal intensity ratio of fibroid to skeletal muscle was positively correlated with EEF. Therefore, the quantitative MRI parameters of T2WI signal intensity ratio of fibroid to skeletal muscle can be considered as the quantitative index to evaluate the level of difficulty in HIFU treatment of uterine fibroids and also in predicting the NPV ratio of uterine fibroids that can be achieved.
Disclosure statement
Lian Zhang and Zhibiao Wang are senior consultants to Chongqing Haifu. The other authors have no conflict of interests to declare.
References
- Baird DD, David BD, Michael CH, et al. High cumulative incidence of uterine leiomyoma in black and white women: ultrasound evidence. Am J Obstet Gynecol. 2003;188:100–107.
- Clarke-Pearson DL, Geller EJ. Complications of hysterectomy. Obstet Gynecol. 2013;121(3):654–673.
- Toor SS, Jaberi A, Macdonald DB, et al. Complication rates and effectiveness of uterine artery embolization in the treatment of symptomatic leiomyomas: a systematic review and meta-analysis. AJR Am J Roentgenol. 2012;199(5):1153–1163.
- Nishiyama S, Saito M, Sato K, et al. High recurrence rate of uterine fibroids on transvaginal ultrasound after abdominal myomectomy in Japanese women. Gynecol Obstet Invest. 2006;61(3):155–159.
- Froeling V, Meckelburg K, Scheurig-Muenkler C, et al. Midterm results after uterine artery embolization versus MR-guided high-intensity focused ultrasound treatment for symptomatic uterine fibroids. Cardiovasc Intervent Radiol. 2013;36(6):1508–1513.
- Liu X, Tang J, Luo Y, et al. Comparison of high-intensity focused ultrasound ablation and secondary myomectomy for recurrent symptomatic uterine fibroids following myomectomy: a retrospective study. BJOG: Int J Obstet Gynecol. 2020;127:1422–1428.
- Chen J, Li Y, Wang Z, et al. Evaluation of high-intensity focused ultrasound ablation for uterine fibroids: an IDEAL prospective exploration study. BJOG: Int J Obstet Gynaecol. 2018;125(3):354–364.
- Li W, Jiang Z, Deng X, et al. Long-term follow-up outcome and reintervention analysis of ultrasound-guided high intensity focused ultrasound treatment for uterine fibroids. International journal of hyperthermia: the official journal of European Society for Hyperthermic Oncology. Int J Hyperthermia. 2020;37(1):1046–1051.
- Mindjuk I, Trumm CG, Herzog P, et al. MRI predictors of clinical success in MR-guided focused ultrasound (MRgFUS) treatments of uterine fibroids: results from a single centre. Eur Radiol. 2015;25(5):1317–1328.
- Keserci B, Duc NM. The role of T1 perfusion-based classification in magnetic resonance-guided high-intensity focused ultrasound ablation of uterine fibroids. Eur Radiol. 2017;27(12):5299–5308.
- Cheng H, Wang C, Tian J. Correlation between uterine fibroids with various magnetic resonance imaging features and therapeutic effects of high-intensity focused ultrasound ablation. Pak J Med Sci. 2015;31:869–873.
- Thiburce AC, Frulio N, Hocquelet A, et al. Magnetic resonance-guided high-intensity focused ultrasound for uterine fibroids: mid-term outcomes of 36 patients treated with the Sonalleve system. Int J Hyperthermia. 2015;31(7):764–770.
- Kim Y-s, Lim HK, Park MJ, et al. Screening magnetic resonance imaging-based prediction model for assessing immediate therapeutic response to magnetic resonance imaging-guided high-intensity focused ultrasound ablation of uterine fibroids. Invest Radiol. 2016;51(1):15–24.
- Kim Y-s, Lee J-W, Choi CH, et al. Uterine fibroids: correlation of T2 signal intensity with semiquantitative perfusion MR parameters in patients screened for MR-guided high-intensity focused ultrasound ablation. Radiology. 2016;278(3):925–935.
- Park JJ, Kim CK, Park SY, et al. Assessment of early response to concurrent chemoradiotherapy in cervical cancer: value of diffusion-weighted and dynamic contrast-enhanced MR imaging. Magn Reson Imaging. 2014;32(8):993–1000.
- Kim Y-s, Kim B-G, Rhim H, et al. Uterine fibroids: semiquantitative perfusion MR imaging parameters associated with the intraprocedural and immediate postprocedural treatment efficiencies of MR imaging–guided high-intensity focused ultrasound ablation. Radiology. 2014;273(2):462–471.
- Suomi V, Komar G, Sainio T, et al. Comprehensive feature selection for classifying the treatment outcome of high-intensity ultrasound therapy in uterine fibroids. Sci Rep. 2019;9(1):10907.
- Liu Z, Gong C, Liu Y, et al. Establishment of a scoring system for predicting the difficulty level of high-intensity focussed ultrasound ablation of uterine fibroids. Int J Hyperthermia. 2018;34(1):77–86.
- Funaki K, Fukunishi H, Funaki T, et al. Magnetic resonance-guided focused ultrasound surgery for uterine fibroids: relationship between the therapeutic effects and signal intensity of pre-existing T2-weighted MR images. Am J Obstet Gynecol. 2007;196(2):184.e181–184.e186.
- Ronit M, Yael I, Shlomo CE, et al. MR-guided focus ultrasound (MRgFUS) for symptomatic uterine fibroids: predictors of treatment success†. Hum Reprod. 2012;27:3425–3431.
- Ikink ME, Voogt MJ, Verkooijen HM, et al. Mid-term clinical efficacy of a volumetric magnetic resonance-guided high-intensity focused ultrasound technique for treatment of symptomatic uterine fibroids. Eur Radiol. 2013;23(11):3054–3061.
- Ikink ME, van Breugel JMM, Schubert G, et al. Volumetric MR-guided high-intensity focused ultrasound with direct skin cooling for the treatment of symptomatic uterine fibroids: proof-of-concept study. Proc Int Soc Magn Reson Med. 2014;2014:684250.
- Baker KG, Robertson VJ, Duck FA. A review of therapeutic ultrasound: biophysical effects. Phys Ther. 2001;81(7):1351–1358.
- Divya S, Kohi M. Updates on MR-guided focused ultrasound for symptomatic uterine fibroids. Semin Intervent Radiol. 2018;35(1):17–22.
- Trimboli P, Bini F, Marinozzi F, et al. High-intensity focused ultrasound (HIFU) therapy for benign thyroid nodules without anesthesia or sedation. Endocrine. 2018;61(2):210–215.
- Fan H-J, Cun J-P, Zhao W, et al. Factors affecting effects of ultrasound guided high intensity focused ultrasound for single uterine fibroids: a retrospective analysis. Int J Hyperthermia. 2018;35(1):534–540.
- Fan H-J, Zhang C, Lei H-T, et al. Ultrasound-guided high-intensity focused ultrasound in the treatment of uterine fibroids. Medicine. 2019;98(10):e14566.
- Chen L, Haar GT, Hill CR. Influence of ablated tissue on the formation of high-intensity focused ultrasound lesions. Ultrasound Med Biol. 1997;23(6):921–931.