
 ?Mathematical formulae have been encoded as MathML and are displayed in this HTML version using MathJax in order to improve their display. Uncheck the box to turn MathJax off. This feature requires Javascript. Click on a formula to zoom.
Abstract
Purpose
While the standard setting during radiofrequency catheter ablation (RFCA) consists of applying low power for long times, a new setting based on high power and short duration (HPSD) has recently been suggested as safer and more effective. Our aim was to compare the electrical and thermal performance of standard vs. HPSD settings, especially to assess the effect of the catheter orientation.
Methods
A 3D computational model was built based on a coupled electric-thermal-flow problem. Standard (20 W–45 s and 30 W–30 s) and HPSD settings (70 W–7 s and 90 W–4 s) were compared. Since the model only included a cardiac tissue fragment, the power values were adjusted to 80% of the clinical values (15, 23, 53 and 69 W). Three catheter-tissue orientations were considered (90°, 45° and 0°). Thermal lesions were assessed by the Arrhenius equation. Safety was assessed by checking the occurrence of steam pops (100 °C in tissue) and thrombus formation (80 °C in blood).
Results
The computed thermal lesions were in close agreement with the experimental data in the literature, in particular with in vivo studies. HPSD created shallower and wider lesions than standard settings, especially with the catheter at 45°. Steam pops occurred earlier with HPSD, regardless of catheter orientation.
Conclusion
HPSD seems to be more effective in cases that need shallow and extensive lesions, especially when the catheter is at 0° or at 45°, as used in pulmonary vein isolation.
1. Introduction
Cardiac arrhythmia is a heart rhythm disturbance caused by an electrical malfunction of a group of cells. The correct electrical activity of the cardiac cells controls the heartbeat and thus correct blood circulation. Radiofrequency (RF) cardiac ablation (RFCA) is a minimally invasive technique used to eliminate some cardiac arrhythmias and consists of delivering an RF current (∼500 kHz) through a percutaneous catheter whose tip has a metal electrode which is placed over the tissue responsible for the arrhythmia. The RF current raises the temperature and creates a thermal lesion by coagulative necrosis, which extends approximately along the tissue subjected to >50 °C.
Although RFCA can be considered an effective and safe procedure, serious clinical complications can occur due to excessive heating, as temperatures over 80 °C at the electrode-blood interface can cause coagulum by denaturation and blood proteins adhering to the electrode tip [Citation1,Citation2]. Irrigated-tip electrodes have mitigated this complication, since they keep the electrode-tissue interface relatively cool. However, when tissue temperature reaches ∼100 °C, water boils and steam pops are produced inside the tissue [Citation3]. When the trapped steam pressure is high enough, there is an explosive rupture with tissue disruption and hemorrhage, which is potentially hazardous in ablations on a thin layer of myocardium (such as the atrium wall). However, it is still impossible to predict when steam pops will occur in a clinical scenario.
There is no general agreement on the most appropriate power setting and duration for constant power RFCA. It is reasonable to assume that the ideal setting will depend on the individual patient, along with the conditions around the target zone. Although the standard setting used with irrigated-tip electrodes to ablate atrial fibrillation consists of 20–30 W power and relatively long duration (45–60 s), recent studies [Citation4–7] have explored the feasibility of new settings based on high-power (70–90 W) and short-duration (4–7 s) (HPSD), with the aim of creating transmural lesions with fewer complications than at the standard setting. The essential difference between both settings has to do with the thermodynamic response. In the standard setting, the tissue directly heated by RF power (which extends 1–2 mm around the electrode) heats deeper layers by thermal conduction [Citation5]. When the RF power is switched off, the lesion expands very little during the cooling down period, while HPSD creates a larger area of directly heated tissue [Citation5] and the lesion continues growing by thermal conduction due to thermal latency during the cool-down [Citation8].
In terms of effectiveness, some in vivo studies conducted on a porcine model compare the performance of standard setting vs. HPSD for Pulmonary Vein Isolation (PVI) [Citation4–6]. Overall, these studies reported that the HPSD lesions were significantly wider than and of similar depth to the standard settings, suggesting that HPSD is better for PVI due to increased lesion-to-lesion uniformity and linear continuity, given the larger lesion diameter. This difference between the HPSD and standard settings in terms of surface width were confirmed in an ex vivo study with single ablations on porcine leg muscle [Citation7]. However, this study also concluded that HPSD creates significantly shallower lesions than the standard setting. There is therefore still some uncertainty about the differences between HPSD and standard protocol in terms of thermal lesion depth and surface width. Computational modeling can provide useful information on this issue since it can make a controlled study of the differences between standard and HPSD settings with different catheter orientation, which is difficult to do in vivo. Computer modeling can also provide information on the temperature distributions in the tissue, which is crucial to assessing the possibility of steam pops. Regarding safety, and closely related to this, a higher incidence of steam pops was found with HPSD with no temperature limitation during power control [Citation4,Citation5]. The risk of steam pops appears to be reduced by using HPSD under temperature control [Citation6]. It was also seen that higher contact forces than 40 g between electrode and tissue caused a higher incidence of steam pops [Citation5]. Those in vivo and ex vivo studies assessed safety of HPSD only in terms of number of steam pops, without any appraisal of the physical causes due to the difficulty of mapping experimentally the evolution of temperature distributions in tissue and blood during ablation (e.g., to accurately determine the time when tissue reaches 100 °C). However, these issues can be accurately studied by computational modeling.
The main objective of our study was to compare the standard setting vs. HPSD in terms of efficacy (maximum lesion width and depth) and safety (minimum overheating of tissue and blood, which could involve clinical complications such as thrombus and steam pops). The study was based on 3D computer modeling since this can simulate the real clinical scenario more accurately, for instance by analyzing the effect of catheter orientation with respect to the tissue surface and by modeling the effect of blood flow and saline irrigation in the cardiac chamber.
2. Methods
2.1. Model geometry
The 3D model consisted of a fragment of cardiac tissue adjacent to a volume of blood (cardiac chamber) and an open-irrigated electrode of the type used in clinical practice to ablate atrial fibrillation (see ). The dispersive electrode was modeled as an electrical boundary condition on the bottom surface of the cardiac tissue. The XZ-plane was the symmetry plane and hence only half the domain was considered. The geometry and dimensions were taken from [Citation9], which had previously been estimated by the convergence test to avoid boundary effects. We initially considered a catheter placed perpendicularly on the tissue surface and inserted to a depth of 0.5 mm and later considered another two orientations: 45° and 0° (parallel). shows a detail of the meshing with the catheter at 45°.
Figure 1. (A) Geometry of the computational model with the catheter in the orientation position (figure not to scale): X = 80 mm, Y = Z = 40 mm, C = 20 mm [Citation9]. Note that XZ-plane is the symmetry plane in the model. The active electrode mimics the multi-hole open irrigated electrode ThermoCool® SF (Biosense Webster, Diamond Bar, CA, USA). Saline irrigation through the small holes in the electrode-tip is modeled by an inlet velocity boundary condition at the electrode-blood interface. Thermal lesion is assessed by the Arrhenius equation (Ω = 1) and its geometry is characterized by: maximum depth (D), maximum width (MW), surface width (SW) and depth at the maximum width (DW). (B) 3D perspective view of the model showing the meshing (case of 45° orientation).
![Figure 1. (A) Geometry of the computational model with the catheter in the orientation position (figure not to scale): X = 80 mm, Y = Z = 40 mm, C = 20 mm [Citation9]. Note that XZ-plane is the symmetry plane in the model. The active electrode mimics the multi-hole open irrigated electrode ThermoCool® SF (Biosense Webster, Diamond Bar, CA, USA). Saline irrigation through the small holes in the electrode-tip is modeled by an inlet velocity boundary condition at the electrode-blood interface. Thermal lesion is assessed by the Arrhenius equation (Ω = 1) and its geometry is characterized by: maximum depth (D), maximum width (MW), surface width (SW) and depth at the maximum width (DW). (B) 3D perspective view of the model showing the meshing (case of 45° orientation).](/cms/asset/2e01d9b1-8f1c-4d3b-b4fe-814cb15383c3/ihyt_a_1909148_f0001_c.jpg)
The electrode design mimicked the Thermocool SF® electrode (Biosense Webster, Diamond Bar, CA, USA) which is a commercial 8 Fr 3.5 mm open-irrigated electrode with multi-holes on its surface. The saline solution flows through the holes and mixes with the blood. We assumed the saline-blood mix to be homogeneous since both liquids have similar densities. The saline flow effect was thus modeled as an inlet boundary condition at the electrode surface [Citation9]. The details of the irrigation holes were not physically included in the model since they are very small and would require a very fine computational mesh and high computational complexity. The whole region of holes in the electrode was assumed to be an inlet boundary condition (see violet zone in ). No irrigation was assumed at the holes at the tissue-electrode interface, as the tissue is expected to block the saline flow.
2.2. Governing equations
The model was based on a coupled electric-thermal-flow problem solved numerically by the Finite Element Method (FEM) on COMSOL Multiphysics (COMSOL, Burlington, MA, USA) and MATLAB (The MathWorks, Natick, MA, USA). Over the distance of interest at RF ablation frequencies (∼500 kHz) the biological medium can be considered almost totally resistive and a quasi-static approach can therefore be used to solve the electrical problem [Citation10]. The governing equation for the electrical problem was the modified Laplace’s Equation in which electrical conductivity σ (S/m) depends on temperature:
(1)
(1)
where
is the voltage (V) and E is the vector electric field E (V/m). From EquationEquation (1)
(1)
(1) , the distributed heat source qRF is calculated by:
(2)
(2)
where |E| is the module of the vector electric field E (V/m). The distributed heat source qRF was then coupled in the Bioheat EquationEquation (3)
(3)
(3) , which is the governing equation for the thermal problem. The Bioheat Equation was modified by the enthalpy method [Citation11] in order to model the phase change associated with tissue vaporization (∼100 °C).
(3)
(3)
where
is density (kg/m3), h enthalpy, t time (s), k thermal conductivity (W/m·K), c specific heat (J/kg·K), T temperature (°C), Qp the heat loss caused by blood perfusion (W/m3) and Qm the metabolic heat generation (W/m3). Qp was ignored since its effect is negligible for ablations shorter than 1 min [Citation12]. Qm was also neglected because it is insignificant in comparison to the rest of the terms. The last term of EquationEquation (3)
(3)
(3) is the heat loss due to blood motion. The velocity field u (m/s) was described by the incompressible Navier-Stokes fluid dynamics equations, comprised by the momentum (4) and mass (5) equations:
(4)
(4)
(5)
(5)
where P is the pressure (Pa), μ blood viscosity (2.1 × 10⁻³ kg/m·s) [Citation9], and F body forces (N/m3) which were neglected in our model.
2.3. Material properties
The thermal and electrical properties of the materials were extracted from [Citation9] and [Citation13] and are shown in . The initial temperature was 37 °C for the tissue and blood volume and 22 °C for the electrode-tip (saline irrigation at room temperature) [Citation9]. The electrical and thermal conductivities were defined by the temperature-dependent piecewise functions to consider tissue vaporization [Citation9]. The σ value rose by +1.5%/°C [Citation14] between 0 and 100 °C, decreased linearly 4 orders of magnitude between 100 and 105 °C (to model tissue desiccation) [Citation15] and then remained constant, while the k value rose by +0.12%/°C up to 100 °C and then remained constant [Citation16].
Table 1. Properties of the model materials [Citation9,Citation13].
2.4. Boundary conditions
shows the boundary conditions of the electric, thermal and flow problems. For the electrical problem (), all the outer model surfaces (except the bottom) were fixed to zero electric flux. The voltage on the bottom surface was set to 0 V to mimic the dispersive electrode. A constant power ablation mode was modeled, the most commonly used ablation mode in clinical practice for open-irrigated electrodes [Citation9]. To apply constant RF power, the electrical current was adjusted by calculating the electrical impedance. We conducted a total of 12 simulations: 2 based on the standard settings (20 W–45 s and 30 W–30 s) and 2 based on HPSD (70 W–7 s and 90 W–4 s, as in [Citation4–7]). Three catheter orientations were considered for each setting: perpendicular, 45° and parallel. The power applied in the protocols was not the setting used in clinical practice, since we only modeled a fragment of the cardiac tissue and not the entire thorax [Citation17]. Electric currents flow from the active electrode to the dispersive electrode on the patient’s leg or back in a monopolar RFCA arrangement. As the total impedance of the circuit in this scenario depends on the elements included (lungs, muscle, skin, etc.), which is not the same impedance as in our model, the applied power was corrected according to [Citation18]
(6)
(6)
where Z0 is the initial impedance of the model, Zoptimal is set at 120 Ω (as in [Citation18]), Pinitial is the power used in clinical practice and Pcorrected is the adjusted power in the computational model. An average power of 15.38, 23.05, 53.53, 68.70 W was applied in the 20 W–45 s, 30 W–30 s, 70 W–7 s and 90 W–4 s settings, respectively, which represented a reduction of ∼23% with respect to the power used in clinical practice, which is almost the same as the power correction factor proposed in [Citation17].
Figure 2. Electrical (A), thermal (B) and flow (C) boundary conditions applied in the model.
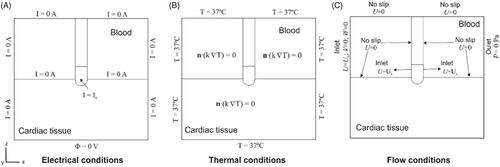
For the thermal boundary conditions () a null thermal flux was used on the symmetry plane and a constant temperature of 37 °C was set on the outer model surfaces. For the flow boundary conditions (), an inlet velocity boundary condition was applied on the left surface of the blood volume to impose a blood flow velocity (in x-direction) of 0.1 m/s as in [Citation9]. An outlet boundary condition of zero pressure was fixed on the right surface of the blood volume. The saline irrigation flow was assumed as an inlet velocity boundary condition applied to the whole area of the electrode-tip around the holes, except in the part inserted in the tissue (see violet zone in ). The saline velocity condition was calculated as the ratio between the saline irrigation flow rate and the electrode area with saline flow. The irrigation area of the electrode depends on its location with respect to the tissue, while the irrigation flow rate varies according to the power applied. Three catheter orientations were considered: perpendicular (90°), 45° and parallel (0°), so that the electrode areas in which the saline irrigation boundary condition was applied were 12.42 mm2, 12.26 mm2 and 10.86 mm2, respectively (while insertion depth was 0.5 mm in all cases). As the ThermoCool® SF manufacturer recommends an irrigation flow rate of 8 ml/min for RF power below 30 W [Citation9], 8 ml/min was used for 20 W and 30 W cases and 15 ml/min for 70 W and 90 W. A no-slip condition was also applied on the upper surfaces of the fluid volume, the symmetry plane and the tissue-blood and electrode-blood interfaces.
2.5. Lesion assessment
In standard settings of more than 30 s, the 50 °C isotherm is normally used to estimate the lesion boundary since this value is assumed to cause cell necrosis at these heating durations [Citation19]. However, this approach is only appropriate when the lesion gets to its stationary state after the RF application. This does not occur with HPSD settings, at which the lesion is expected to keep on growing due to thermal latency [Citation8]. In these cases, the Arrhenius model (EquationEquation (7)(7)
(7) ), which relates exposure time to temperature [Citation20], has to be used instead of the 50 °C isotherm.
(7)
(7)
where Ω(T,t) is the degree of thermal damage, R is the universal gas constant, A is the frequency factor (7.39 × 1039s–1) and ΔE is the activation energy (2.577 × 10⁵ J/mol). The values for A and ΔE were taken from [Citation8]. The isoline Ω = 1, which represents a 63% of cells dead [Citation20], was used to compute the thermal damage contour.
2.6. Model validation
In order to assess the accuracy of the computational model in terms of reproducing the thermal lesions with HPSD settings, we planned a set of computer simulations mimicking the ex vivo experimental conditions used by Bourier et al. [Citation7], i.e., a perpendicular catheter and initial impedance of around 100 Ω. Since Bourier et al. used a limited-domain experimental model, no power correction was considered in this set of simulations, so that the cases considered were: one standard setting (30 W/30 s) and three HPSD settings (50 W/13 s, 60 W/10 s, 70 W/7 s). The lesion sizes reported by Bourier et al. were compared to those obtained from computer simulations using the isoline Ω = 1 after enough cooling time to ensure that the lesion did not grow further due to thermal latency.
2.7. Assessment of effectiveness and safety
The effectiveness of each setting was assessed by its capacity to create deep and wide lesions, which were characterized by the following parameters (see ) [Citation21,Citation22]: maximum depth (D) and surface width (SW). The thermal lesions computed with standard and HPSD settings were compared with data from previous experimental studies [Citation4–7,Citation23,Citation24] and lesion growth was measured 1 min after RF power switch-off.
The safety was assessed by overheating episodes in tissue and blood. Tissue overheating is known to cause intramural gas (steam pops) that can break through the tissue surface. Although there is no mathematical model available to reproduce the steam pop phenomenon, they are known to be associated with temperatures around 100 °C and sudden impedance increases [Citation25]. We therefore analyzed the impedance evolution and the time at which tissue temperature reached 100 °C. For blood overheating we checked whether the maximum blood temperature reached 80 °C, at which thrombi can form [Citation1,Citation2].
3. Results
3.1. Comparison with ex vivo experiments
shows a comparison between computational and ex vivo experimental lesions (taken from [Citation7]) at standard and HPSD settings with the catheter in the perpendicular orientation, while the experimental and computational lesion shapes are compared in . The computed lesions were generally found to be ∼1–1.5 mm deeper and ∼1–2.3 mm narrower than the experimental ones. In spite of these differences in absolute terms, the computational model was able to predict wider and shallower lesions as the RF pulse is shorter and the power is greater (see ).
Figure 3. Thermal lesion contours from the ex vivo experiments performed by Bouriel et al. [Citation7] (A) and from simulations computed by the Arrhenius contour Ω = 1 after a 1-min cooling period (B) with one standard setting (30 W/30 s) and three HPSD settings (50 W/13 s, 60 W/10 s, 70 W/7 s).
![Figure 3. Thermal lesion contours from the ex vivo experiments performed by Bouriel et al. [Citation7] (A) and from simulations computed by the Arrhenius contour Ω = 1 after a 1-min cooling period (B) with one standard setting (30 W/30 s) and three HPSD settings (50 W/13 s, 60 W/10 s, 70 W/7 s).](/cms/asset/47b96062-f633-4117-a5e8-5b13c7f8406b/ihyt_a_1909148_f0003_c.jpg)
Table 2. Comparison between computer (FEM) and experimental (EXP) lesion sizes.
3.2. Effect of the ablation protocol and catheter orientation on thermal lesion
show the cardiac tissue and blood temperature distributions after the application of standard and HPSD settings with the catheter perpendicular, at 45° and parallel, respectively. The lesion contour was assessed by the Arrhenius contour Ω = 1 after RF application, and for HPSD it was also assessed after a 60 s cooling to assess extra thermal expansion by thermal latency. shows the thermal lesion dimensions obtained with the catheter perpendicular, at 45° and parallel for the standard and HPSD settings. The HPSD lesion dimensions (, cases C and D) were assessed at RF power switch-off and after a cooling period to assess the extra growth due to thermal latency. In fact, this extra growth during the cooling period was observed only in depth, never in surface width (see ). At 70 W–7 s, the depth increased by +0.5, +0.3 and +1.0 mm with the catheter parallel, at 45° and perpendicular, respectively, and at 90 W–4 s, it increased by +0.8, +0.2 and +1.1 mm ().
Figure 4. Temperature distribution (°C) and thermal lesions created in cardiac tissue with the catheter in the perpendicular orientation by a standard ablation protocol of 20 W–45 s (A) and 30 W–30 s (B), and also an HP-SD ablation protocol of 70 W–7 s (C) and 90 W–4 s (D). The thermal lesion was assessed by the Arrhenius contour Ω = 1 after RF ablation time (red solid line in A and B and black solid line in C and D together with ablation time) and after the extra thermal expansion caused by thermal latency in the cooling period (red line in C and D together with the minimum time required to reach it.).
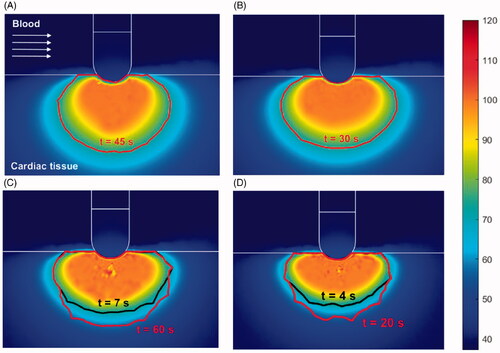
Figure 5. Temperature distribution (°C) and thermal lesions created in cardiac tissue with the catheter at 45° to the tissue by a standard ablation protocol of 20 W–45 s (A) and 30 W–30 s (B), and also a HP-SD ablation protocol of 70 W–7 s (C) and 90 W–4 s (D). The thermal lesion was assessed by the Arrhenius contour Ω = 1 after the RF ablation time (red solid line in A and B and black solid line in C and D together with ablation time) and after the extra thermal expansion caused by thermal latency in the cooling period (red solid line in C and D together with the minimum time required to reach it).
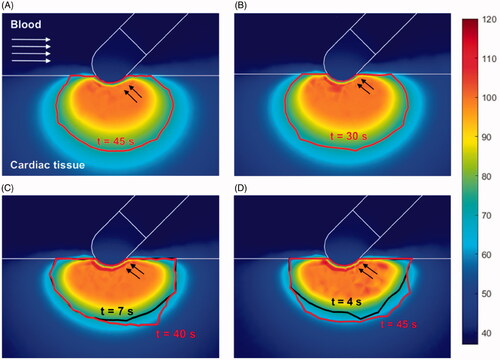
Figure 6. Temperature distribution (°C) and thermal lesions created in cardiac tissue with the catheter in the parallel orientation by a standard ablation protocol of 20 W–45 s (A) and 30 W–30 s (B), and also a HP-SD ablation protocol of 70 W–7 s (C) and 90 W–4 s (D). The thermal lesion was assessed by the Arrhenius contour Ω = 1 at the end RF ablation time (red solid line in A and B and black solid line in C and D together with the ablation time) and after the extra thermal expansion caused by thermal latency in the cooling period (red solid line in C and D together with the minimum time required to reach it).
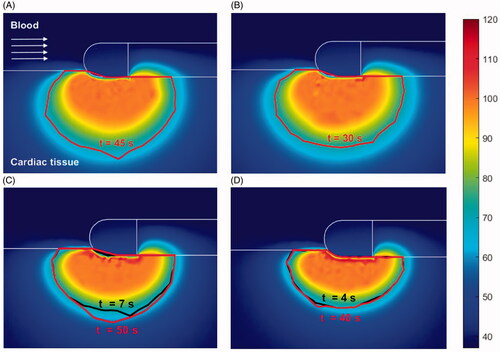
Figure 7. Lesion dimensions (D: maximum depth, MW: maximum width, SW: surface width, and DW: depth at the maximum width) obtained with standard and HP-SD ablation protocols with the catheter in perpendicular orientation, at 45° and parallel. In HP-SD ablation protocols, lesion dimensions are assessed after RF ablation and after the cooling period (white legend).
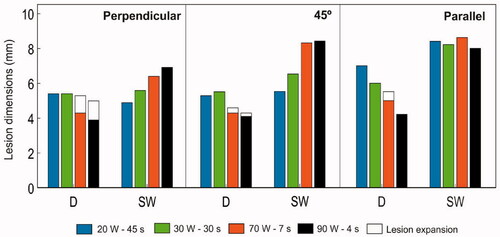
Although the standard settings generally created deeper (D) lesions than the HPSD, this was really highly dependent on the catheter orientation (see ). For instance, when it was perpendicular there were hardly any differences in the depth (5.4 mm with standard setting vs. 5.3 mm and 5.0 with 70 W–7 s and 90 W–4 s, respectively) but surface width (SW) increased considerably, from 4.9 mm with 20 W–45 s to 6.9 mm with 90 W–4 s. In contrast, when parallel there were hardly any differences in the surface width (values between 8.0 and 8.6 mm regardless of the power setting) while the depth was significantly reduced, from 7.0 mm with 20 W–45 s to 4.2 mm with 90 W–4 s. The 45° orientation showed intermediate behavior between the two extreme perpendicular and parallel cases. In fact, the optimal setting, i.e. the one that would provide the highest SW/D ratio would be 90 W–4 s at 45° (SW/D = 2.0), followed by 90 W–4 s when parallel (SW/D = 1.9), and far from 90 W–4 s when perpendicular.
In absolute terms, the deepest lesions were achieved with the standard setting and a parallel catheter (6.0–7.0 mm), and the shallowest ones with 90 W–4 s when parallel and at 45° (4.2–4.3 mm). HPSD created wider surface lesions than the standard settings but only with a perpendicular catheter and at 45°, with a more pronounced effect at 45° than in the perpendicular orientation. With the catheter perpendicular surface width was 4.9 mm with 20 W–45 s and rose to 6.9 mm with 90 W–4 s, at 45° orientation width was 5.5 mm with 20 W–45 s and rose to to 8.4 mm with 90 W–4 s. Interestingly, HPSD and standard settings created similar surface lesion widths with a parallel catheter: 8.4, 8.2, 8.6 and 8.0 mm for 20 W–45 s, 30 W–30 s, 70 W–7 s and 90 W–4 s, respectively.
3.3. Impedance evolution during RF ablation
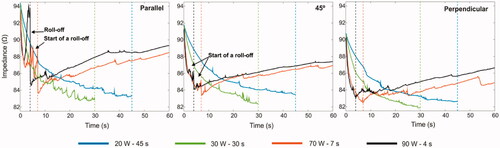
shows impedance evolution at standard and HPSD settings with the catheter parallel, at 45° and perpendicular. The sharpest increase in impedance (even exceeding the initial value) occurred at 3.5 s with 90 W–4 s and the catheter parallel (see ). This coincided with the total desiccation of the tissue below the electrode, i.e. tissue temperature higher than 100 °C (see ). At 70 W–7 s with the same catheter orientation there was only a gradual increase of impedance starting at ∼5 s, but never reaching the initial value. HPSD settings with the catheter at 45° did not show these impedance rises but small sporadic fluctuations, suggesting partial desiccation below the electrode (see ). The fluctuation amplitudes were even smaller with the perpendicular catheter.
Figure 8. Impedance evolution during each ablation mode with catheter orientations at parallel, 45° and perpendicular to the tissue surface. Dashed lines show the end of the ablations. HP-SD simulations (orange and black solid lines) continued for 1 min after RF power was switched off.
3.4. Overheating in tissue and blood
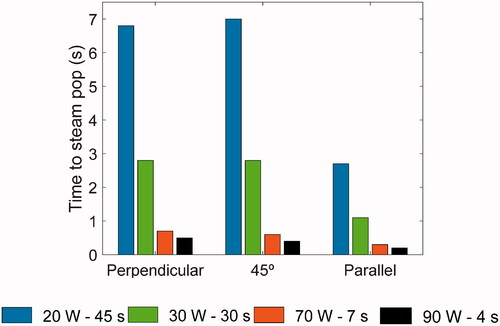
As can be seen in , blood temperature was always below 80 °C, regardless of catheter orientation, which suggests that no thrombi formed on the electrode surface. shows the minimum time required to reach a temperature of 100 °C at any point inside the cardiac tissue, which indicates the likelihood of steam pops. There was a strong negative correlation between power and duration: in all catheter orientations 100 °C was reached sooner as power increased. There were no significant differences in the time to reach 100 °C with the catheter at 90° and 45°. However, this occurred sooner at 0° than in the other orientations, regardless of the setting used (e.g., at 90 W–4 s the time was 0.3 s less at 0° than 90°, while at 20 W–45 s it was 4.1 s less at 0° than 90°).
Figure 9. Minimum time (s) required to reach a temperature of 100 °C in cardiac tissue for the ablation protocols and catheter orientations.
4. Discussion
4.1. Comparison with experimental data
As far as we know this is the first modeling study of an irrigated-tip electrode that compares standard vs. HPSD settings in terms of effectiveness (lesion size) and safety (minimum overheating to avoid clinical complications such as steam pops and thrombi). Although these issues have been assessed in previous experimental studies [Citation4–6], none of them considered the effect of the catheter orientation. The first step was to compare the computational results with those reported in experimental studies to assess how a state-of-the-art computer model can predict lesion size under standard and HPSD conditions. A comparison with the ex vivo results from Bourier et al. [Citation7] showed a low prediction capability in absolute terms, despite trying to reproduce the same conditions as in the ex vivo experiments. We checked that if we had computed the lesion size using Ω = 4.6 instead of 1.0 the lesion dimensions would be just 0.3–0.6 mm smaller, so this does not seem to be the reason for the disagreement between the computational and experimental results. The disagreement could be due to the method used by Bourier et al. to measure lesion size (by digital caliper). Note that while the usual technique in experimental studies is to perform a staining procedure before measuring (e.g., with tetrazolium chloride) to identify mitochondrial enzyme activity (i.e. viable cells) [Citation25], staining was not performed in the cited study and the ablated samples were measured manually [Citation7]. Despite the fact that the model offers greater prediction errors than Bourier et al. (up to 1.5 mm in depth and up to 2.3 mm in surface width), it should be noted that the model was able to reproduce the trend found in most studies of shallower and wider surface-lesions as power increased and the duration shortened.
Interestingly, we found better agreement when our results mimicking in vivo conditions (i.e. including different catheter orientations and power correction) were compared with those obtained from in vivo studies [Citation4–6]. For instance, Barkagan et al. [Citation4] conducted in vivo ablations with a standard setting (30 W–30 s) and HPSD (90 W–4 s) and reported surface widths of 5.6 ± 2.5 mm and 8.6 ± 3.1 mm, respectively. Our computational results were always within these ranges, with surface widths between 5.6 and 8.2 mm with standard setting (30 W–30 s) and between 6.9 and 8.4 mm with HPSD (90 W–4 s), depending on the catheter orientation. They reported similar depths between standard and HPSD, while our simulations showed very little difference in depth between standard (values between 5.4 and 6.0 mm depending on catheter orientation) and HPSD setting (values between 4.2 and 5.0 mm depending on catheter orientation).
Leshem et al. [Citation5] conducted in vivo ablations with a standard setting (25 W–20 s) and HPSD (90 W–4 s), and reported proportionally smaller lesions than ours: surface width 6.02 ± 0.2 mm with HPSD (90 W–4 s) and 4.43 ± 1.0 mm with a standard setting (25 W–20 s) vs. 6.9–8.4 mm with HPSD (90 W–4 s) and 5.6–8.2 mm or 4.9–8.4 mm with standard settings of 30 W–30 s or 20 W–45 s respectively in our simulations considering different catheter orientations. This discrepancy could be explained by the fact that in standard mode lesion size depends mainly on ablation duration and they only considered 20 s (at 25 W) compared with 45 s (and 20 W) or 30 s (and 30 W) in our simulations. They also employed constant power with a 65 °C maximum temperature to avoid tissue overheating, which was not considered in our simulations. In fact, our results showed higher tissue temperatures, especially with HPSD, probably due to not including this temperature cutoff. They also did not find differences in depth between standard and HPSD setting (3.58 ± 0.3 mm vs. 3.53 ± 0.6 mm), while Takigawa et al. [Citation6] reported lesions with greater surface width in HPSD with the 60 °C temperature control (90 W–4 s) than with the standard setting (30 W–30 s): 6.0 mm vs. 4.6 mm. They also reported less transmurality with HPSD, which suggests shallower lesions.
4.2. Effect of catheter orientation on thermal latency
One of the issues studied was the lesion growth during post-ablation cooling with HPSD. Although this issue has been studied by Irastorza et al. [Citation8], their model had serious limitations which have been overcome in the present study: (1) the catheter was considered only in the perpendicular orientation, which is unrealistic as regards clinical practice; (2) the thermal effect of circulating blood was modeled by thermal convection coefficients, which provide an unrealistic blood temperature distribution and make it impossible to explore the risk of thrombus formation [Citation26]; (3) the irrigated-tip electrode was only modeled approximately by setting a constant temperature of 40 °C at the electrode tip; and (4) a constant voltage ablation mode was used instead of constant power, which is the most frequently used in clinical practice with irrigated-tip electrodes to treat atrial fibrillation.
In this regard, our results confirm that lesion growth during cooling is only relevant for HPSD and that the higher the power the larger the growth and mainly affecting depth, not the surface width, which could be explained by the presence of the circulating blood in the cardiac chamber, which implies a strong heat evacuation mechanism during cooling and impedes a surface lesion (note that the study by Irastorza et al. [Citation8] used thermal convection coefficients to model the thermal effect of blood flow, which only enables the model to predict lesion depth correctly but not surface width [Citation26]).
Our results also suggest that lesion growth is significant only with a perpendicular catheter and to a lesser extent when it is parallel or at 45° (see ). This is due to lesion growth being limited to deeper areas when parallel or at 45° as practically all the tissue below the electrode (in particular when parallel) is desiccated (>100 °C) (see and , cases C–D).
4.3. Effect of catheter orientation on lesion size and tissue temperature
Overall, our results suggest that lesions are larger when the catheter is parallel to the tissue, although there is still some controversy as to whether lesion dimensions are affected by this factor. Some experimental studies [Citation23,Citation24] found larger dimensions with a parallel catheter, while others [Citation27,Citation28] reported smaller lesions in this factor. This difference could possibly be due to the numerous variables involved in the different experimental studies, making the results difficult to reproduce. In this regard, our results are in line with those reported in [Citation23,Citation24]. Interestingly, ours also show that standard settings create deeper lesions when the catheter is parallel, but almost no differences with respect to HPSD settings when it is perpendicular (see ). We think that this difference could be caused by the tissue desiccation during HPSD ablation with the parallel catheter, which hinders the extra lesion growth (see ). The ablations performed with a parallel catheter generally tended to overheat the tissue, regardless of the power applied, possibly due to the relative position of the two areas prone to focus the RF power (creating the so-called edge effect) with respect to the tissue surface. These areas are the the electrode tip and where the electrode joins the plastic section [Citation19]. With a perpendicular orientation only the tip of the catheter would create this edge effect in the cardiac tissue, while the parallel orientation the edge effect is double, overheating the tissue in two mentioned areas.
Regarding overheating, by comparing impedance evolution and the times at which the tissue reached 100 °C at each setting (i.e. indicated the time at which a steam pop occurs), our results indicate that both the catheter orientation and the power applied play a crucial role in steam pops (see ). HPSD ablations with a parallel catheter had the shortest times to steam pop formation (just 0.2 s at 90 W) with significant tissue desiccation around the electrode tip (completely surrounding the electrode at 90 W). However, we found that tissue temperature reached 100 °C at all ablation settings and catheter orientations and occurred later at standard settings with a perpendicular catheter (e.g., 6.8 s with 20 W–45 s), which suggests that it would be necessary to include a temperature control to regulate the applied power, as in recent studies [Citation4,Citation5,Citation29,Citation30].
4.5. Clinical implications
Although it has been reported in previous experimental studies that HPSD creates shallower and wider surface lesions than the standard settings, our results suggest that this behavior could be highly influenced by the catheter orientation. While a perpendicular orientation is easily controllable under ex vivo conditions [Citation7], this may not be the case in clinical practice, where a more oblique or parallel orientation may be used. Our computer results can be analyzed from many points of view, but in the context of RFCA of the posterior atrial wall, where the aim is to achieve shallow lesions to avoid damage to the esophagus (i.e. minimize depth, D) with an extensive surface to avoid gaps that would maintain the arrhythmia (i.e. maximize surface width, SW). Keeping this in mind, our results suggest that the optimal setting in terms of maximizing the SW/D ratio is 90 W–4 s at 45°, since this angle represents an intermediate case between perpendicular and parallel and could combine the advantage of perpendicular orientation to achieve HPSD to create wider surface lesions with the advantage of the parallel orientation to create shallower lesions (see results in Section 3.2).
As a disadvantage, our results also suggest that HPSD causes temperatures of 100 °C earlier than the standard settings. However, given the short duration of the power application, this should not necessarily lead to a greater incidence of steam pops. Although the causes and their negative consequences of this phenomenon (disruption of the tissue surface or even cardiac perforation) have not been clearly established to date, it is reasonable to think that reaching ∼100 °C should not be the only factor, since intramyocardial gas could diffuse through the tissue surface without generating micro-explosions [Citation25], thus minimizing the risks. In any case, the state of the art of computational RFCA modeling does not yet allow us to study these issues.
4.6. Limitations of the study
The main limitation of this computational study was the absence of validation in terms of temperature reached in tissue and blood due to the absence of experimental data on point temperatures. Despite this, the model can reproduce the behavior of the standard and HPSD modes in terms of lesion geometry. There are also discrepancies between some experimental and computational results regarding the absolute values of lesion size. We must acknowledge that extensive validation work is pending.
Likewise, the part of the model corresponding to the blood flow problem was not validated. To our knowledge, there are no computational models of cardiac ablation that have validated the velocity field of the blood around the electrode. We have not validated modeling of blood velocity because blood flow has an exclusively thermal effect, and therefore can be assessed by simply observing the lesion size. Finally, note that our study considered HPSD without temperature control so that the results could be different if cutoffs were to be incorporated, as described in [Citation6].
5. Conclusions
This paper describes a 3D RFCA computational modeling study with an irrigated-tip electrode considering different catheter orientations in which the computer results were in close agreement with previous experimental results, especially with in vivo studies. Our results showed that HPSD (70 W–7 s and 90 W–4 s), as modeled herein, created shallower and wider lesions on the surface than the standard settings we used (20 W–45 s and 30 W–30 s), especially when the catheter is at 0° or at 45°. However, other settings may produce different results. In brief, HPSD could be more suitable for certain targets, such as pulmonary vein isolation, in which large surface widths are required to minimize the gaps between consecutive point-to-point ablations.
Disclosure statement
No potential conflict of interest was reported by the author(s).
Additional information
Funding
References
- Demolin JM, Eick OJ, Münch K, Koullick E, et al. Soft thrombus formation in radiofrequency catheter ablation. Pacing Clin Electrophysiol. 2002;25(8):1219–1222.
- Matsudaira K, Nakagawa H, Wittkampf FH, et al. High incidence of thrombus formation without impedance rise during radiofrequency ablation using electrode temperature control. Pacing Clin Electrophysiol. 2003;26(5):1227–1237.
- Seiler J, Roberts-Thomson KC, Raymond JM, et al. Steam pops during irrigated radiofrequency ablation: feasibility of impedance monitoring for prevention. Heart Rhythm. 2008;5(10):1411–1416.
- Barkagan M, Contreras-Valdes FM, Leshem E, et al. High-power and short-duration ablation for pulmonary vein isolation: safety, efficacy, and long-term durability. J Cardiovasc Electrophysiol. 2018;29(9):1287–1296.
- Leshem E, Zilberman I, Tschabrunn CM, et al. High-power and short-duration ablation for pulmonary vein isolation: biophysical characterization. JACC Clin Electrophysiol. 2018;4(4):467–479.
- Takigawa M, Kitamura T, Martin CA, et al. Temperature- and flow-controlled ablation/very-high-power short-duration ablation vs conventional power-controlled ablation: comparison of focal and linear lesion characteristics. Heart Rhythm. 2020;8(4):265–272.
- Bourier F, Duchateau J, Vlachos K, et al. High-power short-duration versus standard radiofrequency ablation: insights on lesion metrics. J Cardiovasc Electrophysiol. 2018;29(11):1570–1575.
- Irastorza RM, d’Avila A, Berjano E. Thermal latency adds to lesion depth after application of high-power short-duration radiofrequency energy: results of a computer-modeling study. J Cardiovasc Electrophysiol. 2018;29(2):322–327.
- González-Suárez A, Berjano E, Guerra JM, et al. Computational modeling of open-irrigated electrodes for radiofrequency cardiac ablation including blood motion-saline flow interaction. PLoS One. 2016;11(3):e0150356-18.
- Doss JD. Calculation of electric fields in conductive media. Med Phys. 1982;9(4):566–573.
- Abraham JP, Sparrow EM. A thermal-ablation bioheat model including liquid-to-vapor phase change, pressure- and necrosis-dependent perfusion, and moisture-dependent properties. Int J Heat Mass Transf. 2007;50(13–14):2537–2544.
- Pérez JJ, González-Suárez A, Berjano E. Numerical analysis of thermal impact of intramyocardial capillary blood flow during radiofrequency cardiac ablation. Int J Hyperthermia. 2018;34(3):243–249.
- Hasgall PA, Di Gennaro F, Baumgartner C. 2016. IT’IS Database for thermal and electromagnetic parameters of biological tissues, Version 3.0; [cited 2015 Sep 1]. Available from www.itis.ethz.ch/database.
- Schutt D, Berjano EJ, Haemmerich D. Effect of electrode thermal conductivity in cardiac radiofrequency catheter ablation: a computational modeling study. Int J Hyperthermia. 2009;25(2):99–107.
- Haemmerich D, Chachati L, Wright AS, et al. Hepatic radiofrequency ablation with internally cooled probes: effect of coolant temperature on lesion size. IEEE Trans Biomed Eng. 2003;50(4):493–500.
- Berjano EJ. Theoretical modeling for radiofrequency ablation: state-of-the-art and challenges for the future. Biomed Eng Online. 2006;5(1):24.
- Irastorza RM, Gonzalez-Suarez A, Pérez JJ, et al. Differences in applied electrical power between full thorax models and limited-domain models for RF cardiac ablation. Int J Hyperthermia. 2020;37(1):677–687.
- Bhaskaran A, Barry MA, Pouliopoulos J, et al. Circuit impedance could be a crucial factor influencing radiofrequency ablation efficacy and safety: a myocardial phantom study of the problem and its correction. J Cardiovasc Electrophysiol. 2016;27(3):351–357.
- Panescu D, Whayne JG, Fleischman SD, et al. Three-dimensional finite element analysis of current density and temperature distributions during radio-frequency ablation. IEEE Trans Biomed Eng. 1995;42(9):879–890.
- Chang IA. Considerations for thermal injury analysis for RF ablation devices. Open Biomed Eng J. 2010;4:3–12.
- Moreno J, Quintanilla JG, Molina-Morúa R, et al. Morphological and thermodynamic comparison of the lesions created by 4 open-irrigated catheters in 2 experimental models. J Cardiovasc Electrophysiol. 2014;25(12):1391–1399.
- Yokoyama K, Nakagawa H, Wittkampf FH, et al. Comparison of electrode cooling between internal and open irrigation in radiofrequency ablation lesion depth and incidence of thrombus and steam pop. Circulation. 2006;113(1):11–19.
- Otomo K, Yamanashi WS, Tondo C, et al. Why a large tip electrode makes a deeper radiofrequency lesion: effects of increase in electrode cooling and electrode-tissue interface area. J Cardiovasc Electrophysiol. 1998;9(1):47–54.
- Chugh SS, Chan RC, Johnson SB, et al. Catheter tip orientation affects radiofrequency ablation lesion size in the canine left ventricle. Pacing Clin Electro. 1999;22(3):413–420.
- Wright M, Harks E, Deladi S, et al. Visualizing intramyocardial steam formation with a radiofrequency ablation catheter incorporating near-field ultrasound. J Cardiovasc Electrophysiol. 2013;24(12):1403–1409.
- Gonzalez-Suarez A, Berjano E. Comparative analysis of different methods of modeling the thermal effect of circulating blood flow during RF cardiac ablation. IEEE Trans Biomed Eng. 2016;63(2):250–259.
- Nakagawa H, Wittkampf FH, Yamanashi WS, et al. Inverse relationship between electrode size and lesion size during radiofrequency ablation with active electrode cooling. Circulation. 1998;98(5):458–465.
- Wood MA, Goldberg SM, Parvez B, et al. Effect of electrode orientation on lesion sizes produced by irrigated radiofrequency ablation catheters. J Cardiovasc Electrophysiol. 2009;20(11):1262–1268.
- Iwasawa J, Koruth JS, Petru J, et al. Temperature-controlled radiofrequency ablation for pulmonary vein isolation in patients with atrial fibrillation. J Am Coll Cardiol. 2017;70(5):542–553.
- Reddy VY, Grimaldi M, De Potter T, et al. Pulmonary vein isolation with very high power, short duration, temperature-controlled lesions: the QDOT-FAST trial. JACC Clin Electrophysiol. 2019;5(7):778–786.