
 ?Mathematical formulae have been encoded as MathML and are displayed in this HTML version using MathJax in order to improve their display. Uncheck the box to turn MathJax off. This feature requires Javascript. Click on a formula to zoom.
Abstract
Objective
Deep-tissue localization of thermal doses is a long-standing challenge in magnetic field hyperthermia (MFH), and remains a limitation of the clinical application of MFH to date. Here, we show that pulse sequencing of MFH leads to a more persistent inhibition of tumor growth and less systemic impact than continuous MFH, even when delivering the same thermal dose.
Methods
We used an in vivo orthotopic murine model of pancreatic PANC-1 cancer, which was designed with a view to the forthcoming ‘NoCanTher’ clinical study, and featured MFH alongside systemic chemotherapy (SyC: gemcitabine and nab-paclitaxel). In parallel, in silico thermal modelling was implemented.
Results
Tumor volumes 27 days after the start of MFH/SyC treatment were 53% (of the initial volume) in the pulse MFH group, compared to 136% in the continuous MFH group, and 337% in the non-treated controls. Systemically, pulse MFH led to ca. 50% less core-temperature increase in the mice for a given injected dose of magnetic heating agent, and inflicted lower levels of the stress marker, as seen in the blood-borne neutrophil-to-lymphocyte ratio (1.7, compared to 3.2 for continuous MFH + SyC, and 1.2 for controls).
Conclusion
Our data provided insights into the influence of pulse sequencing on the observed biological outcomes, and validated the nature of the improved thermal dose localization, alongside significant lowering of the overall energy expenditure entailed in the treatment.
Introduction
Since it was first suggested by Gilchrist and colleagues in 1957 [Citation1], magnetic field hyperthermia (MFH) has been explored as a cancer thermotherapy, using iron oxide magnetic nanoparticles (MNPs) as heating agents to deliver localized thermal energy into tumors (e.g [Citation2,Citation3].). This energy is generated through magnetization reversal processes within the MNPs, driven by the presence of external time-varying magnetic fields (e.g [Citation4,Citation5].).
MFH has been very effective in producing in vivo temperatures higher than 41 °C [Citation6]. Such temperatures lead to cell death, by affecting the cellular metabolism in general, and also RNA/DNA synthesis and DNA repair mechanisms, membrane fluidity and stability, as well as the function of cell surface receptors and transmembrane transport proteins [Citation7,Citation8] in particular. The formation of reactive oxygen species during hyperthermia further favors induction of cell death [Citation9,Citation10]. In response to the thermal stress, an altered expression of the proteins Ki67, TOP2A, TPX2, ERK 1/2 and JNK has been observed [Citation11,Citation12]. Interestingly, the cytotoxic effects of hyperthermia can differ depending on the tumor cell phenotype [Citation12].
For clinical purposes, such relatively strong heating effects should be confined only to the tumors. However, to achieve such localization, many different factors need to be considered, including the MNP concentration or ‘load’ in the tumor tissue, the retention of the MNPs over time, the extent of the heating volume in the tumor, MNP heating parameters, and the amplitude and frequency of the applied magnetic field [Citation4,Citation5]. The topological distribution of the MNPs throughout the tumor is known to be of particular significance, especially when the tumors are near vital organs or major blood vessels, both of which act as thermal sinks, drawing the MFH-induced heat away from the tumor, and reducing its effectiveness. This effect is particularly prominent in a highly perfused organ such as the pancreas, where branches of the truncus coeliacus and other vessels, are present.
In this work, we highlight and explore an aspect of magnetic hyperthermia that is not often considered, but which we find has a distinct effect on localization: viz. the time domain sequencing of the treatment. From experimental studies in tumor-bearing mice, thermal modeling, and reference to published data on thermal dosing, we show that by varying the sequencing, it is possible to distinctly reduce the potentially damaging flow of heat away from the tumor. As part of this, we report on the development of a new orthotopic murine model of pancreatic cancer, which presents a preclinical target that better replicates the target clinical condition than more conventional subcutaneous xenograft models. The work is part of recent efforts to address the challenge of deep-tissue localization by the European Commission supported NoCanTher consortium [Citation13], which focuses on a particularly aggressive cancer, namely locally advanced pancreatic cancer (LAPC) – for which new treatment modalities are very much needed. Both the orthotopic model and the pulse sequencing studies described in this paper contributed, in 2020, to a successful application for National Competent Authority permission for a 15-patient clinical feasibility study of pulsed MFH, as an adjunctive treatment alongside standard-of-care chemotherapy, across two sites (Barcelona and Madrid), starting in 2021.
Materials and methods
Thermal modeling
Model calculations were based on the Pennes bioheat equation, including both metabolic and perfusion effects [Citation14–16]. Tissue-specific parameters [Citation17,Citation18] and temperature dependent changes in the perfusion rate were applied [Citation19]. For the murine orthotopic tumor model it was assumed that the entire pancreas was enveloped by the orthotopic tumor, and that the tissue immediately beyond the edge of the tumor was muscle. The model was implemented using the open-source software package LT Spice, which is well suited to the detailed tracking of temporal effects. Although LT Spice is designed for electrical circuits research, it can be applied to thermal models [Citation20–22].
Thermal dosimetry
Thermal doses were quantified using the thermal iso-effect method [Citation23,Citation24], where temperature-time data is converted into an equivalent treatment time at 43 °C (CEM43 = ‘cumulative equivalent minutes’ at 43 °C). The conversion factor, based on cell survival data [Citation25], was t R(43-T) where t is the dwell time (in minutes) at temperature T, and R = 0.25 for T < 43 °C, or 0.5 for T ≥ 43 °C. For the in silico models an assumed homogeneous and spherical MNP dispersion allowed computation of CEM43Tx metrics, these being the CEM43 doses on the spherical surfaces enclosing the xth volume percentile of the tumor. Particular attention was paid to the CEM43T90 metric [Citation26–28] by modeling T(r90,t), where For the in vitro experiments it was assumed that heating was homogeneous over the entire cell culture, and the CEM43 conversion was applied directly to the recorded T(t) data.
For the in vivo experiments, where inhomogeneous MNP distributions were anticipated, another approach was taken. T(rprobe,t) data were recorded from a thermal probe pressed into (but not penetrating) the skin of the animal, at a distance of 1.0 ± 0.2 mm (as measured by ultrasound) from the edge of the tumor, and maximal temperatures Tmax noted for each run. As the MNPs were expected to form a collection of separate deposits in the tissue (injection volumes, see ), it was reasoned that the Tmax values recorded would be indicative of the thermal doses delivered to the animals.
Table 1. Maximum temperatures recorded for orthotopic PANC-1 tumors during MFH treatments with a surface probe pressed into the skin ca. 1.0 mm from the tumor.
Nanomaterials
For the in vivo experiments, sterile, multicore dextran-coated MNPs were used (RCL-01, Resonant Circuits Limited); and for the in vitro experiments, single-core starch-coated MNPs were used (FluidMAG-C11-D, Chemicell GmbH).
Magnetic heating apparatus
A solenoidal Preclinical MACH system (Resonant Circuits Limited) operating at 1.048 ± 0.010 MHz was used to deliver a sinusoidally varying magnetic field H0 sin(ωt), where H0 could be varied from 4.44 to 8.34 kA/m. Thermal data were recorded using fiber optic probe thermometers (TS5 & FOTEMPMK-19, Optocon AG).
Pulse and continuous magnetic hyperthermia treatments
Local ethics committee policies led to a constraint against simple field-on/field-off sequences (each on-off cycle was deemed to be a separate experiment), so high-field/low-field sequences were used instead. For pulse in vitro, H0 was set to H0-1 = 5.43 kA/m for 10 min, then raised to H0-2 = 8.34 kA/m for 6.5 min, followed by 4 cycles of [1.5 min H0-1, 3 min H0-2], then 1.5 min H0-1. For pulse in vivo, the sequence comprised 4 min H0-1, 11 min H0-2, 14 cycles of [1 min H0-1, 2 min H0-2], then 3 min H0-1. Continuous in vitro comprised 17 min at H0-2; and continuous in vivo 60 min at H0-1.
In vivo experiments using an orthotopic tumor model
Orthotopic pancreatic tumor models of PANC-1 cells were propagated by surgical means. For this, fluorescent PANC-1 (2 × 10⁶) cells were suspended in 2% Matrigel™ in PBS and injected into the pancreas. The localization of the orthotopic tumor within the pancreas was substantiated by ultrasound imaging (Vevo700, FUJIFILM Visualsonics Inc.) and by histopathology on excised organs stained with hematoxylin/eosin (Supplementary Figure 1). Tumor volumes were assessed regularly via ultrasound. All animal experimentation was carried out in accordance with the international guidelines on the ethical use of animals, and they were approved by the regional animal care committee (Thüringer Landesamt für Verbraucherschutz, Bad Langensalza, Germany). Eight- and 10-weeks old female nude mice (Rj:Athym-Foxn1nu/nu, Janvier, Germany) were used. Animals were maintained under artificial day–night cycles (14 h/10 h light–dark cycles; 25 °C room temperature) and received food and water ad libitum.
Animal groups
Animals bearing orthotopic tumors were randomized into 7 independent experimental groups. Ps and Cs: mice treated weekly with systemic chemotherapy (SyC: per kg BW, 50 mg Gemcitabine, i.p., 30 mg nab-Paclitaxel, i.v.) and with MFH (Ps: pulsed; Cs: continuous) after intratumoral application of MNPs (RCL-01, 0.72 mg Fe per 100 mm³ tumor volume).Footnote1 S: mice treated with SyC alone. P and C: mice treated with MFH alone (P: pulsed; C: continuous). N: non-treated controls (no MNPs, SyC or MFH). M: mice with intratumoral MNPs alone. Timeline, number of mice per group, and treatment parameters are shown in and . Tumor volumes were normalized to the respective volume of the animal at day 0, i.e., when MNPs were intratumorally injected (0.72 mg Fe per 100 mm³ tumor volume, single site, pull back technique, via tumor palpation immediately after US imaging) for MFH treatments on the subsequent day. During all interventions, animals were anesthetized with isoflurane (2–2.5 (v/v) %).
Figure 1. Timeline used for in vivo murine experiments with orthotopic PANC-1 tumors. SyC: systemic chemotherapy; MFH: magnetic field hyperthermia; MNP: injection of magnetic nanoparticles.
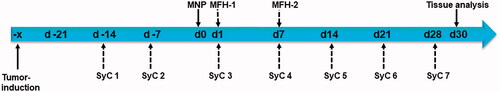
Table 2. Specification of the animal groups.
Protein expression analysis of tumor tissue
At day 30, animals were sacrificed and tumor tissues were excised, fixed, and embedded in paraffin. Tissue slides were incubated in antibody solutions (dilutions: 1: 60 to 750 in Dako REAL™ Antibody Diluent) against HSP70 (from mouse, BioGenex), Ki67, CD31 (all from rabbit, Abcam), and pERK (Cell Signaling), and subsequently with a biotin-labeled secondary antibody (goat anti-mouse, 50 min). Finally, treatment with streptavidin-alkaline phosphatase and chromogen (all from DAKO) was done for visualization. Sections were counterstained with hematoxylin. The presence of the respective proteins was estimated semi-quantitatively using a five-category scoring system (0 = less than 5%, 1 = 5 to 25%, 2 = 25 to 50%, 3 = 50 to 75%, 4 = more than 75% of stained cells positive). CD31 as measure of tumor vascularity was estimated through hot spot analysis by Chalkley count [Citation29]. Tumor slices from 2 animals per group were analyzed. Reproducibility was validated by a second independent and blinded examination [Citation14].
Blood analysis (hemograms)
During animal euthanasia the subclavian vein was punctured and blood was collected and immediately measured on an automated hematology analyzer (Sysmex XT-1800i, Japan) according to the user manual. As a measure of therapeutic stress in animals the neutrophil to lymphocyte ratio was calculated [Citation30]. Sample collection was performed by one experienced person in order to minimize experimentation-based animal stress, which could potentially impact data quality.
Circulating tumor cells in the blood
Immediately after euthanasia, blood was collected, transferred into erythrocyte lysis buffer (155 mM NH4Cl, 10 mM KHCO3, 0.1 mM EDTA, pH 7.3), centrifuged at 250 g (10 min, 4 °C), and washed to remove cell debris. The enriched nucleated cells were then stained with a fluorescence-labeled Alexa-Fluor-488 anti-EpCAM monoclonal antibody (VU1D9, Cell Signaling Technology) and analyzed on a FACSCalibur flow cytometer (Becton Dickinson). To determine the ‘exposure’ (E) of the body to CTCs as a measure of therapeutically-induced tumor cell spread, total CTCs (in percentage of total blood nucleated cells) per gram body mass was determined. The ‘readiness’ (R) of tumor cells to be released out of the tumor was determined by the total CTCs normalized to tumor volume (ratio of tumor volume between day 30 and day 0 post MNP application).
In vitro cell culture
The human pancreatic adenocarcinoma cell line (PANC-1, ATCC) was cultured in DMEM medium supplemented with 10% (v/v) fetal bovine serum (Gibco®). Cells were kept at 37 °C in a humidified atmosphere containing 5% (v/v) CO2.
Cell viability assays
Experiments with PANC-1 cells were designed to entail CEM43 heating doses of more than 60 min, which is the anticipated therapeutic dose near intratumoral MNP deposits [Citation31]. For this, PANC-1 cells were supplemented (or not, in the case of controls) with MNPs (FluidMAG-C11-D, diluted to a concentration of 100 µg Fe per mL) and subjected (or not) to MFH. Following the MFH treatments, cell viability was determined by a) the Alamarblue® assay (24 and 48 h post hyperthermia) [Citation32], b) counting cells via impedance spectroscopy (OMNI Life science); or c) via evaluation of 2 D cell survival at 16 days post hyperthermia [Citation33]. All experiments were carried out at least 3 times (3 biological replicates with quadruple to sextuple samplings for each replicate).
Statistics
Data requiring statistical analyses were evaluated using the SigmaPlot 14.0 program. All data passed the Shapiro Wilk test for normal distribution. Therefore, ex vivo data with one end-point analysis per animal was depicted as mean and standard error of the mean. Since data from in vitro experiments on PANC-1 cells were composed of several biological replicates with multiple data acquisitions each, the mean and standard error of the mean was used. Owing to their normal distribution, the student’s t-test was used to compare groups, and differences between groups were considered as statistically significant at a p value equal or less than 0.05. With consideration of the analysis of tumor volumes with low animal numbers per group, data were evaluated using a linear mixed model which includes a quadratic term for time and an interaction term for time and treatment group. Hereto, the effects of therapy (least square means of tumor volumes) at day 28 were determined with a 0.95 level of confidence using the Kenward Rogers degrees of freedom method and Tukey’s method for p value adjustments.
Results
Impact of pulse or continuous MFH on orthotopic pancreatic tumors in mice
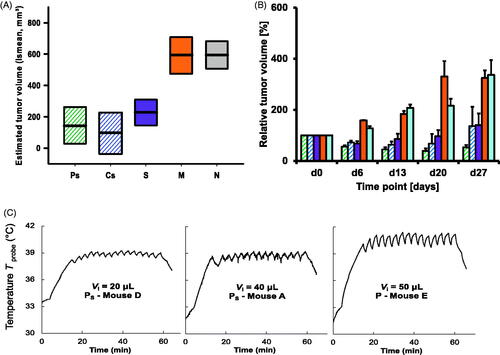
On treating PANC-1-inoculated orthotopic pancreatic tumors in vivo with MFH combined with systemic chemotherapy (SyC), both pulse heating (Ps) and continuous heating (Cs) were effective in reducing tumor growth (compared to the non-treated group, ). Thermal probe data showed comparable Tmax levels in the Ps and Cs groups (, Supplementary Figure 3), indicating that comparable thermal doses had been delivered to both groups. The chemotherapy-only, S group in exhibited some tumor inhibition effects, comparable to those of the CS group, but not as marked as for the Ps group. Parallel experiments on the hyperthermia-only P and C groups, showed no relevant reduction of tumor growth at all (Supplementary Figure 4), even though the thermal doses in these groups were comparable to those in the Ps and Cs groups ().
Figure 2. Impact of pulse or continuous magnetic hyperthermia in combination with systemic chemotherapy, on the ultrasound-derived volumes of orthotopic PANC-1 tumors. (A) Influence of therapy on tumor volumes up to day 27 based on a linear mixed model (see Methods) for the determination of least-square means of tumor volumes. (B) Mean tumor growth characteristics for the different animal groups. (C) Representative temperature-time plots of murine skin temperatures measured with a surface probe ca. 1.0 mm from the tumor edge during pulse hyperthermia. Least-square means: thick lines; confidence levels: 0.95; degrees of freedom method: Kenward-Roger; p value adjustment (Tukey’s method): pulse or continuous hyperthermia vs. non-treated control: p < .0001. See for day 0 tumor volumes and for group notations.
Although the latter observation may be attributed to an adjunctive effect in the combination of SyC and MFH, the difference between the Ps and Cs groups evident in is not so readily explained. To better understand how different responses might arise despite equal thermal dosing, a series of in silico experiments were performed. shows modeling data for a homogeneous distribution of MNPs in a 125 μL spherical pancreatic tumor. Five treatment scenarios were considered: A – a single 60 min heating cycle; B − 40 min of heating spread over 5 cycles of 8 min, interspersed with 4 min rest (no heating); C − 40 min over 10 cycles of 4 min, with 2 min rest; D − 20 min over 5 cycles of 4 min, with 2 min rest; and E − 10 min over 5 cycles of 2 min, with 1 min rest. T(r,t) curves were calculated for r = 0 to 9.9 mm in 0.1 mm steps. Particular attention was paid to the T(r = 3.0 mm,t) data to determine the CEM43T90 metric, and the input power level was adjusted so that the total CEM43T90 delivered in each of the scenarios was 72 min.
Figure 3. Thermal modeling of five different heating scenarios (A-E), all delivering a CEM43T90 thermal dose of 72 min into a spherical 125 μL pancreatic tumor in a mouse with body temperature 33 °C. The left-hand panels show the power densities P(t) delivered into the tumor; the central panels show the temperature T90 = T(r = 3.0 mm,t) at the 90th volume-percentile surface in the tumor; and the right-hand panels show the cumulative CEM43T90(t) thermal doses for each scenario. Total energy dissipation levels, which are indicative of the relative treatment efficiencies, are marked for each scenario.
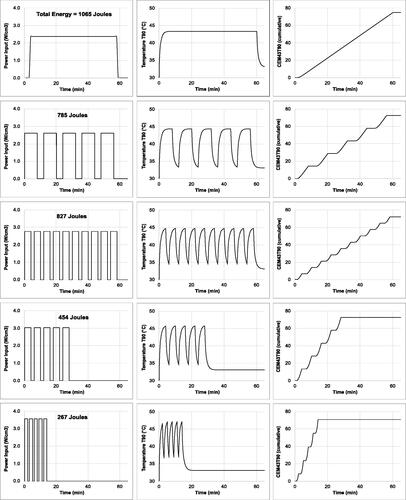
Despite the equal CEM43T90 doses, significant differences were seen in the thermal characteristics of the scenarios. First, and most dramatically, the total energy dissipation levels (input power x power-on time) ranged from 1,065 J (scenario A: continuous) to 267 J (scenario E: pulsed) (). Second, different intra-tumoral temperature distributions were attained (), with higher temperatures reached in the pulsed scenarios, indicating a more localized thermal dose. Third, and more subtly, the ‘thermal treatment trajectories’ (TTTs) were different. This latter point is illustrated in , where each scenario is represented as a temperature-time histogram, with the amount of time spent in a given 2 °C range plotted against the midpoint of that range. (The data in are for r = 0 mm, but TTTs can be constructed for any point in the tumor.)
Figure 4. Intratumoral temperature distributions and ‘thermal treatment trajectories’ (TTTs) derived from the models of . (A) Radial distributions of the maximum attained temperatures Tmax(r) in the tumor heating scenarios. Note that Scenario E, with the shortest power-on time and the lowest energy expenditure, achieves the highest temperatures within the tumor. (B) Modeled TTTs at the tumor centers, i.e., at T0 = T(r = 0,t), plotted with the classic epidermal necrosis threshold data of Moritz 1947. The trajectories show that all five scenarios are effective in terms of crossing the threshold, albeit with different temperature-time curves.
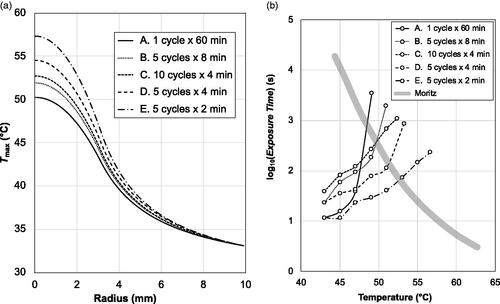
Figure 5. In vitro data on PANC-1 cells showing that pulse and continuous heating at comparable thermal doses lead to comparable biological outcomes. (A) Relative dehydrogenase level (compared to a non-treated control as determined via the Alamarblue assay). (B) Cell number determined via Casy counter. (C) Number of colonies (relative to non-treated controls) formed 16 days post hyperthermia. (D) Corresponding images of PANC-1 colonies. Group notations are as in . Bars depict mean and standard error of the mean with n = 3. *p ≤ .05; **p ≤ .01; ***p ≤ .001.
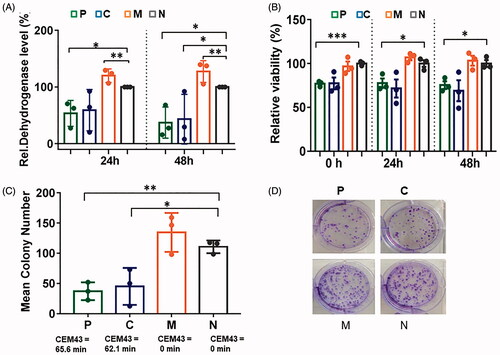
An advantage of the TTT visualization is that it allows comparisons with known preclinically- or clinically-validated treatments. For example, the solid line plotted in corresponds to the well-known Moritz and Henriques data on thermally-induced epidermal necrosis of porcine and human skin [Citation34]. (Although this data is many years old, it is still critically recognized as valuable [Citation25], and in the absence of specific data on pancreatic tissue damage, it is a useful benchmark of in vivo thermal damage.) The line may be regarded as a ‘necrosis threshold’, beyond which necrotic damage occurs. As such, it is clear from that all five of the scenarios traverse the necrosis threshold, but with quite different TTTs, and different temperature-time end points. As such it is reasonable to expect the biological response of the tissue to be different, depending on the scenario used – a result that is consistent with the in vivo Ps versus Cs results presented above.
To elucidate the impact on cell viability of pulse versus continuous MFH per se under controlled experimental conditions, in vitro experiments with PANC-1 cells were performed. These revealed that both the pulse and continuous modalities were equally cytotoxic in MNP-inoculated PANC-1 cells (at comparable CEM43 thermal doses, see Supplementary Figure 2, and Figure 5). The expression of cellular-stress-associated proteins was also comparable between the modalities (Supplementary Figure 6).
To assess the impact of Ps and Cs on protein expression in treated orthotopic pancreatic tumors, semi-quantitative analyses of protein expression (4 weeks post-MFH) were performed. A slightly increased cell proliferation (Ki67 expression) was observed, and a differential impact of Ps and Cs on the HSP70 and pERK expression indicators of cell stress (Ps increased HSP70 and pERK expression; Cs decreased HSP70, but increased pERK expression in comparison to non-treated control tumors, ). Interestingly, Ps rather increased whereas Cs decreased tumor cell proliferation (Ki67 expression, ). Moreover, tumor vascularity (CD31) remained unaltered in all treatment groups (). In contrast, pulse or continuous MFH as monotherapy either decreased protein expression in tumors (HSP70 and Ki67) or it maintained it unaltered (pERK, and CD31, ).
Table 3. Impact of pulse and continuous MFH in combination with SyC (top) or alone (bottom) on protein expression in orthotopic PANC-1 tumors excised from mice on day 30 as indicated in .
Systemic effects after treatment of orthotopic pancreatic tumors in mice with pulse or continuous MFH
When looking at the systemic effects of MFH, pulse sequencing resulted in less peripheral heating of tissue than continuous hyperthermia. This is evident in the maximum rectal temperatures recorded during MFH, plotted as a function of the injected volume Vi of magnetic heating agent (). Although there is scatter in the data points, it appears that the body temperatures of the continuous (C and Cs) group animals increased faster as a function of increasing Vi than was the case for the pulse (P and Ps) group animals.
Figure 6. Systemic effects of pulse or continuous MFH on mice bearing orthotopic pancreatic tumors. (A) Maximal rectal temperatures as a function of the injected volume of magnetic heating agent (0.73 ± 0.05 mg iron per 100 mm3). Superimposed linear trend lines are guides for visualization only. (B) Blood composition at day 30 (timeline and group notation as in ), given as relative cell numbers normalized to the untreated control group. WBC: white blood cells, RBC: red blood cells, HGB: hemoglobin, HCT: hematocrit MCV: red blood cell mean volume, MCH: mean red blood cell hemoglobin, MCHC: mean cell hemoglobin concentration. Bars depict mean and standard deviation of the mean. *p ≤ .05; **p ≤ .01; ***p ≤ .001.
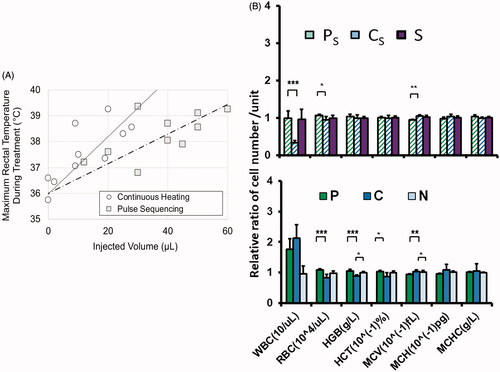
Hemogram data showed different impacts of Ps and Cs on certain blood components, notably the white cell count, which is unchanged in Ps, but significantly dampened in Cs (, Supplementary Figure 7). Interestingly, magnetic field hyperthermia as a monotherapy seemed to rather increase the white blood cell count and decrease some red blood cell parameters (, Supplementary Figure 8), whereas the MNPs alone had no distinct effect at all (Supplementary Figure 9).
The measure of therapeutic stress in animals by the neutrophil to lymphocyte ratio [Citation30] revealed that Ps was much less stressful than Cs (). As a monotherapy, both P and C were apparently stressful for animals, albeit to a lesser extent than Cs ().
Table 4. Neutrophil to lymphocyte ratio of animals as estimated at day 30. Group notation as in .
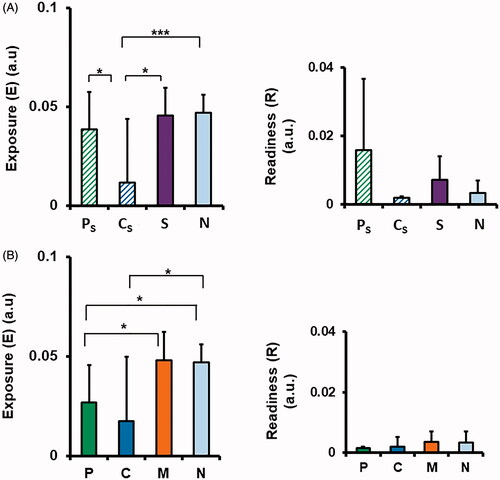
Regarding the release of PANC-1 circulating tumor cells (CTCs) after the combined magnetic hyperthermia therapy, no effect on the body exposure (E) levels was seen in Ps, while it was reduced in Cs, as compared to the non-treated group (). Moreover, some differences between the modalities were observed in the tumor-volume-adjusted readiness (R) levels, with the Ps higher, but the Cs levels lower than that of the non-treated group (), albeit none were statistically significant. Interestingly, when applied as monotherapy, both P and C treatments significantly reduced E, and also reduced R, by tendency, ().
Figure 7. Effects of pulse or continuous MFH on the number of circulating tumor cells (CTCs) in the blood at day 30 of treatment with MFH as a monotherapy (A), or in combination with SyC (B). ‘Exposure’, E (a.u.) is the total CTC count as a percentage of total blood nucleated cells per gram body mass; ‘Readiness’ R (a.u.) is the total CTC count normalized to the tumor volume. Bars depict mean and standard deviation of the mean. *p ≤ .05; **p ≤ .01, ***p ≤ .001.
Discussion
When treating orthotopic pancreatic tumors in mice in combination with a systemic chemotherapy protocol including gemcitabine and paclitaxel (SyC) [Citation35], both the pulse (Ps) and continuous (Cs) magnetic hyperthermia modalities were found to be more effective in reducing tumor volumes than SyC alone on day 27 of the study. To the best of our knowledge, this is the first study reporting that MFH in combination with systemic chemotherapy is effective in inactivating pancreatic tumors. Until now such promising effects have only been reported for hyperthermic intraperitoneal gemcitabine chemotherapy [Citation36] or for modulated electro-hyperthermia [Citation37].
In this work, our goal was to achieve deep-tissue localization, and to circumvent nonspecific heating of tumor-adjacent tissues and organs. Two factors influenced our approach. One was that we anticipated an inhomogeneous distribution of the MNPs in the tumors [Citation24,Citation38], and localized ‘hot-spots’ [Citation39] of 43–45 °C or even higher temperatures formed in the very immediate surroundings of the MNP deposits, as a consequence. From this perspective, normalization was applied to the administered MNP dose per unit volume of tumor, in anticipation of the initial tumor volume per se being a non-determining factor in the biological outcomes. A second factor was an anticipated strong thermoregulation effect from the surrounding internal organs [Citation40], which is much stronger in orthotopic than in more conventional subcutaneous models [Citation27], and which led us to explore the pulse MFH modality both in silico and in vivo.
Pulse MFH has occasionally been reported in the literature, notably by Ivkov et al. [Citation41], who used it to reduce morbidity due to peripheral eddy current heating in animals. All animal tissues are electrically conductive due to their high water content. As such, the time-varying magnetic fields of MFH induce circulating currents, as per Faraday’s law. This effect was pronounced in Ivkov’s studies, where large-amplitude fields (32, 76, and 104 kA/m) were used [Citation41]. Most MFH laboratories use much lower amplitudes, of order 10–15 kA/m [Citation42], for which the eddy currents, especially in small animal models, are negligible. This may explain why pulse MFH has been seldom used to date, with the exception of a few reports on its use, to obtain high thermal doses and cell death in vitro [Citation43]; to maintain constant temperatures in a murine treatment model [Citation44]; and as part of a pulsatile drug release strategy [Citation45,Citation46]. No previous studies have focused on dose-localization and biological outcomes per se, as in this work.
From the evidence of our in vivo experiments on orthotopic tumors, it appears that the presence of SyC was favorable for tumor regression, particularly in tumor areas between the MNP deposits. Since SyC was administered weekly during the whole experimentation time, it was expected that there would be a continuous stress impulse on DNA integrity of dividing (tumor) cells [Citation47]. Moreover, MFH treatments interfere with the cellular repair mechanisms [Citation48]. This increases the uptake of gemcitabine and nab-paclitaxel by changing the cell membrane permeability and therefore diffusion into the target cells (e.g [Citation49].). As such, the observed reduction of tumor volumes is consistent with the MFH acting in a synergistic manner to SyC [Citation31,Citation50].
At a cellular level, our in vitro results show that the pulse and continuous MFH modalities have comparable effects in inactivating pancreatic PANC-1 tumor cells, at least under the conditions tested, viz. at thermal doses slightly above the toxicity threshold (CEM43 = 60–90 min), and when the maximum temperatures during pulsed MFH were not higher than during continuous MFH (46 °C). In contrast, the temperature pulsations in the orthotopic tumors in vivo might well have led to maximum temperatures that were higher than the continuous MFH group, in particular in the vicinity of MNP deposits, leading to a higher tumor reducing impact.
Moreover, Ps induced cellular stress in orthotopic pancreatic tumors (e.g., increased HSP70 and p-ERK expression compared to non-treated controls, 30 days post MNP application), but also some propensity toward cell proliferation. Since pulse or continuous MFH as monotherapy attenuated the expression of stress and proliferation markers (i.e., Ki67 and HSP70), we suggest that SyC is the main driver of this effect. Therefore, it may be preferable to use more than two hyperthermia sessions in future, in order to strengthen their impact, at least when using low overall tumor temperatures. It is also noteworthy that there is uncertainty in all hyperthermia applications, due to the lack of real-time 3 D temperature monitoring and accurate image resolution for 3 D MNP distribution. Both may have affected our observation on therapeutic efficacy to some extent.
Regarding biological outcomes, the in vivo data show that neither Ps nor Cs affected the risk of tumor cell spread into the blood. Specifically, neither Ps nor Cs significantly increased the body’s exposure (E) to CTCs compared to non-treated control animals, and there was no significant difference in E between Ps and SyC treatments. The readiness (R) metric, which depicts the ‘theoretical readiness’ of tumor cell spread, was found to be higher after Ps treatment than in the Cs, SyC and N groups. However, this was not statistically significant, as the reduced tumor size at day 27 in the Ps group led to large measurement uncertainties. Nevertheless, we can speculate that if R were elevated, it might be related to changes of the cell membrane fluidity due to magnetic hyperthermia and SyC [Citation8], which might subsequently alter the cell migration behavior.
It is also notable that the effects encountered in relation to CTCs were not associated with tumor vascularity nor reactive changes in the blood flow, since the level of CD31 as marker for vascularity [Citation51,Citation52] was unaltered after treatments. In contrast to our findings, whole body hyperthermia (41.8 °C) [Citation53] and intraperitoneal hyperthermia [Citation54] have been reported to increase the number of CTCs in the blood as a consequence of increased intratumoral blood flow. This is rather unlikely to occur in the orthotopic pancreatic tumors studied here, since they are poorly vascularized.
The hemograms of treated mice indicated that Ps had almost no impact on the blood composition, whereas Cs did. Both the P and C monotherapies affected cells of the blood compartment. Such effects may be associated with high demand, consumption, and new production of certain blood cell types as a consequence of immunological responses that occurred as a result of focal tumor cell destruction (apoptosis, necrosis) and bleeding. Further investigations are needed to clarify the corresponding reasons for such differences in more detail.
Systemic stress as measured by the ratio between neutrophils and lymphocytes [Citation30] was not significantly increased by Ps treatment, whereas it was by Cs treatment, as compared to non-treated controls. Interestingly, when applied as monotherapy, both P and C treatments seem to induce higher systemic stress. In general, the ratio of neutrophils to lymphocytes closely correlates to the magnitude of stressor, such as the level of circulating glucocorticoid in animals [Citation30]. Stress hormones are also produced by immunologic reactions. Cortisol is transported in the blood by the corticosteroid-binding globulin, and the body temperature seems to play a role in modulating the hormone release to the tissues [Citation55]. Experimental stress was negligible, since blood samples were normalized to controls and animal experimentation was performed by only one experienced person.
Lastly, we note that the MFH conditions employed for the in vivo experiments here should not, and do not, translate directly across to the conditions that will be employed in the forthcoming Nocanther clinical study [Citation13]. Other considerations, including eddy current heating, and the acceptable volumes of injected magnetic heating agents, are very different between animals and humans, and must be taken into account [Citation56]. Thus, the magnetic field amplitudes and frequencies to be employed in the NoCanTher study are to be 4–5 kA/m and 300 kHz, rather than the 5.4 and 8.3 kA/m and 1.05 MHz used here. This reduction in Ho and f will be compensated for by larger injection volumes, which in the clinic will contain 35 mg of Fe, compared to the ca. 1.0–2.5 mg of Fe used here.
Conclusions
Using orthotopic pancreatic tumors in mice, we found that both pulse and continuous magnetic field hyperthermia (MFH) treatments impact tumor growth in combination with systemic chemotherapy (SyC; gemcitabine and nab-paclitaxel). Pulse heating plus SyC gave the most sustained results and was the only one for which tumor volume reduction was still present at day 27 of the study. In silico experiments showed that different pulse scenarios could deliver the same thermal dose (e.g., as measured by the CEM43T90 metric) as a given continuous treatment, but with better localization and less energy expenditure. In vitro, both modalities were effective in inactivating isolated pancreatic cancer cells. Systemically, pulse MFH induced less peripheral response than continuous MFH, as evident in lower core temperature rises in the animals, and lower levels of blood-borne stress markers (viz. the neutrophil to lymphocyte ratio). Given its anti-tumor effectiveness and its high tolerance in animals, we conclude that pulse MFH should be considered favorably as a thermal treatment modality for pancreatic cancers in combination with systemic chemotherapy.
Correction Statement
This article has been republished with minor changes. These changes do not impact the academic content of the article.
Supplemental Material
Download Zip (1.8 MB)Acknowledgements
We thank Susann Burgold and Julia Göring for their excellent technical support.
Disclosure statement
No potential conflict of interest was reported by the author(s).
Additional information
Funding
Notes
1 The effectiveness of combining SyC (Gemcitabine in particular) with MFH had been corroborated in a previous in vitro experiment (Supplementary Figure 2).
References
- Gilchrist RK, Medal R, Shorey WD, et al. Selective inductive heating of lymph nodes. Ann Surg. 1957;146(4):596–606.
- Hilger I, Hergt R, Kaiser WA. Towards breast cancer treatment by magnetic heating. J Magn Magn Mater. 2005;293(1):314–319.
- Maier-Hauff K, Jordan A, Nestler D, et al. Magnetic Fluid Hyperthermia (MFH) as an alternative treatment of malignant gliomas. Strahlenther Onkol. 2005;181:44.
- Hergt R, Dutz S, Muller R, et al. Magnetic particle hyperthermia: nanoparticle magnetism and materials development for cancer therapy. J Phys: Condens Matter. 2006;18(38):S2919–S34.
- Ludwig R, Stapf M, Dutz S, et al. Structural properties of magnetic nanoparticles determine their heating behavior – an estimation of the in vivo heating potential. Nanoscale Res Lett. 2014;9(1):602.
- Salloum M, Ma RH, Zhu L. An in-vivo experimental study of temperature elevations in animal tissue during magnetic nanoparticle hyperthermia. Int J Hyperthermia. 2008;24(7):589–601.
- Hildebrandt B, Wust P, Ahlers O, et al. The cellular and molecular basis of hyperthermia. Crit Rev Oncol Hemat. 2002;43(1):33–56.
- Mello PD, Bian S, Savio LEB, et al. Hyperthermia and associated changes in membrane fluidity potentiate P2X7 activation to promote tumor cell death. Oncotarget. 2017;8(40):67254–67268.
- Flanagan SW, Moseley PL, Buettner GR. Increased flux of free radicals in cells subjected to hyperthermia: detection by electron paramagnetic resonance spin trapping. FEBS Lett. 1998;431(2):285–286.
- Katschinski DM, Boos K, Schindler SG, et al. Pivotal role of reactive oxygen species as intracellular mediators of hyperthermia-induced apoptosis. J Biol Chem. 2000;275(28):21094–21098.
- Ludwig R, Teran FJ, Teichgraeber U, et al. Nanoparticle-based hyperthermia distinctly impacts production of ROS, expression of Ki-67, TOP2A, and TPX2, and induction of apoptosis in pancreatic cancer. Int J Nanomedicine. 2017;12:1009–1018.
- Sanhaji M, Goring J, Couleaud P, et al. The phenotype of target pancreatic cancer cells influences cell death by magnetic hyperthermia with nanoparticles carrying gemicitabine and the pseudo-peptide NucAnt. Nanomed-Nanotechnol. 2019;20:101983.
- The European Union Horizon. 2020. project “NoCanTher” is a collaboration between 8 academic and 3 commercial partners focussed on magnetic hyperthermia as a treatment for pancreatic cancer; [cited 2021 Apr 06]. Available from: http://www.nocanther-project-eu.
- Gibson-Corley KN, Olivier AK, Meyerholz DK. Principles for valid histopathologic scoring in research. Vet Pathol. 2013;50(6):1007–1015.
- Huang H-W, Horng T-L. Heat transfer and fluid flow in biological processes. In: Becker SM, Kuznetsov AV, editor. Worldcat. Boston: Academic Press; 2015. p. 1–42.
- Wright NT. Heat transfer and fluid flow in biological processes. Boston: Academic Press; 2015. p. 59–76.
- Hasgall PA, Di Gennaro F, Baumgartner C, et al. It’s Database for thermal and electromagnetic parameters of biological tissues. Version 40. 2018; May 15, 2018.
- Kandala SK, Liapi E, Whitcomb LL, et al. Temperature-controlled power modulation compensates for heterogeneous nanoparticle distributions: a computational optimization analysis for magnetic hyperthermia. Int J Hyperthermia. 2019;36(1):115–129.
- Reis RF, Loureiro FD, Lobosco M. 3D numerical simulations on GPUs of hyperthermia with nanoparticles by a nonlinear bioheat model. J Comput Appl Math. 2016;295:35–47.
- Chavez JA, Ortega JA, Salazar J, et al. SPICE model of thermoelectric elements including thermal effects. Proceedings of the 17th IEEE Instrumentation and Measurement Technology Conference (Cat No 00CH37066). 2000. 2:1019–23.
- Gao F, Zheng Q, Zheng YJ. Electrical circuit modeling and analysis of microwave acoustic interaction with biological tissues. Med Phys. 2014;41(5):053302.
- Ting-Yuan W, Charlie Chung-Ping C. SPICE-compatible thermal simulation with lumped circuit modeling for thermal reliability analysis based on modeling order reduction. International Symposium on Signals, Circuits and Systems Proceedings, SCS 2003 (Cat No 03EX720). 2004:357–62.
- Sapareto SA. Thermal Isoeffect dose: addressing the problem of thermotolerance. Int J Hyperthermia. 1987;3(4):297–305.
- Sapareto SA, Dewey WC. Thermal dose determination in cancer-therapy. Int J Radiat Oncol. 1984;10(6):787–800.
- Pearce JA. Relationship between Arrhenius models of thermal damage and the CEM 43 thermal dose. Proceedings SPIE. 2009. 7181:718104.
- Dahring H, Grandke J, Teichgraber U, et al. Improved hyperthermia treatment of tumors under consideration of magnetic nanoparticle distribution using micro-CT imaging. Mol Imaging Biol. 2015;17(6):763–769.
- Kossatz S, Ludwig R, Dahring H, et al. High therapeutic efficiency of magnetic hyperthermia in xenograft models achieved with moderate temperature dosages in the tumor area. Pharm Res. 2014;31(12):3274–3288.
- Wust P, Gneveckow U, Johannsen M, et al. Magnetic nanoparticles for interstitial thermotherapy-feasibility, tolerance and achieved temperatures. Int J Hyperthermia. 2006;22(8):673–685.
- Dhakal HP, Bassarova A, Naume B, et al. Breast carcinoma vascularity: a comparison of manual microvessel count and Chalkley count. Histol Histopathol. 2009;24(8):1049–1059.
- Davis AK, Maney DL, Maerz JC. The use of leukocyte profiles to measure stress in vertebrates: a review for ecologists. Funct Ecol. 2008;22(5):760–772.
- Yarmolenko PS, Moon EJ, Landon C, et al. Thresholds for thermal damage to normal tissues: an update. Int J Hyperthermia. 2011;27(4):320–343.
- Gonzalez RJ, Tarloff JB. Evaluation of hepatic subcellular fractions for Alamar blue and MTT reductase activity. Toxicol in Vitro. 2001;15(3):257–259.
- Begg AC, Stewart FA, Vens C. Genomic instability in cancer strategies to improve radiotherapy with targeted drugs. Nat Rev Cancer. 2011;11(4):239–253.
- Moritz AR, Henriques FC. Studies of thermal injury.2. the relative importance of time and surface temperature in the causation of cutaneous burns. Am J Pathol. 1947;23(5):695–720.
- Philip PA, Lacy J, Portales F, et al. Nab-paclitaxel plus gemcitabine in patients with locally advanced pancreatic cancer (LAPACT): a multicentre, open-label phase 2 study. Lancet Gastroenterol Hepatol. 2020;5(3):285–294.
- Tentes AA, Stamou K, Pallas N, et al. The effect of hyperthermic intraoperative intraperitoneal chemotherapy (HIPEC) as an adjuvant in patients with resectable pancreatic cancer. Int J Hyperthermia. 2016;32(8):895–899.
- Fiorentini G, Sarti D, Casadei V, et al. Modulated electro-hyperthermia as palliative treatment for pancreatic cancer: a retrospective observational study on 106 patients. Integr Cancer Ther. 2019;18:153473541987850.
- Hilger I. In vivo applications of magnetic nanoparticle hyperthermia. Int J Hyperthermia. 2013;29(8):828–834.
- Hiraoka M, Jo S, Akuta K, et al. Radiofrequency capacitive hyperthermia for deep-seated tumors.1. studies on thermometry. Cancer. 1987;60(1):121–127.
- Andra W, d’Ambly CG, Hergt R, et al. Temperature distribution as function of time around a small spherical heat source of local magnetic hyperthermia. J Magn Magn Mater. 1999;194(1–3):197–203.
- Ivkov R, DeNardo SJ, Daum W, et al. Application of high amplitude alternating magnetic fields for heat induction of nanoparticles localized in cancer. Clin Cancer Res. 2005;11(19):7093s–70103.
- European Cooperation in Science and Technology project. RADIOMAG TD1402; [cited 2021 Apr 06]. Available from: http://www.cost-radiomag.eu.
- Makridis A, Tziomaki M, Topouridou K, et al. A novel strategy combining magnetic particle hyperthermia pulses with enhanced performance binary ferrite carriers for effective in vitro manipulation of primary human osteogenic sarcoma cells. Int J Hyperthermia. 2016;32(7):778–785.
- Tang XZ, Xu YJ, Chen J, et al. Intermittent time-set technique controlling the temperature of magnetic-hyperthermia-ablation for tumor therapy. RSC Adv. 2018;8(30):16410–16418.
- Hyun DC. Magnetically-controlled, pulsatile drug release from poly(epsilon-caprolactone) (PCL) particles with hollow interiors. Polymer. 2015;74:159–165.
- Oliveira RR, Carriao MS, Pacheco MT, et al. Triggered release of paclitaxel from magnetic solid lipid nanoparticles by magnetic hyperthermia. Mater Sci Eng C Mater Biol Appl. 2018;92:547–553.
- Lin XJ, Howell SB. Effect of loss of DNA mismatch repair on development of topotecan-, gemcitabine-, and paclitaxel-resistant variants after exposure to cisplatin. Mol Pharmacol. 1999;56(2):390–395.
- Kampinga HH, Dynlacht JR, Dikomey E. Mechanism of radiosensitization by hyperthermia (> or = 43 degrees C) as derived from studies with DNA repair defective mutant cell lines. Int J Hyperthermia. 2004;20(2):131–139.
- Alvarez-Berrios MP, Castillo A, Mendez J, et al. Hyperthermic potentiation of cisplatin by magnetic nanoparticle heaters is correlated with an increase in cell membrane fluidity. Int J Nanomed. 2013;8:1003–1013.
- Dewey WC, Hopwood LE, Sapareto SA, et al. Cellular responses to combinations of hyperthermia and radiation. Radiology. 1977;123(2):463–474.
- Lertkiatmongkol P, Liao DY, Mei H, et al. Endothelial functions of platelet/endothelial cell adhesion molecule-1 (CD31). Curr Opin Hematol. 2016;23(3):253–259.
- Liu L, Shi GP. CD31: beyond a marker for endothelial cells. Cardiovasc Res. 2012;94(1):3–5.
- Hegewisch-Becker S, Braun K, Otte M, et al. Effects of whole body hyperthermia (41.8 degrees C) on the frequency of tumor cells in the peripheral blood of patients with advanced malignancies. Clin Cancer Res. 2003;9(6):2079–2084.
- Melero JT, Ortega FG, Gonzalez AM, et al. Prognostic factor analysis of circulating tumor cells in peripheral blood of patients with peritoneal carcinomatosis of colon cancer origin treated with cytoreductive surgery plus an intraoperative hyperthermic intraperitoneal chemotherapy procedure (CRS + HIPEC). Surgery. 2016;159(3):728–735.
- Follenius M, Brandenberger G, Oyono S, et al. Cortisol as a sensitive index of heat-intolerance. Physiol Behav. 1982;29(3):509–513.
- Southern P, Pankhurst QA. Commentary on the clinical and preclinical dosage limits of interstitially administered magnetic fluids for therapeutic hyperthermia based on current practice and efficacy models. Int J Hyperthermia. 2017;34(6):671–686.