
 ?Mathematical formulae have been encoded as MathML and are displayed in this HTML version using MathJax in order to improve their display. Uncheck the box to turn MathJax off. This feature requires Javascript. Click on a formula to zoom.
Abstract
Purpose
This article will report results from the in-vivo application of a previously published model-predictive control algorithm for MR-HIFU hyperthermia. The purpose of the investigation was to test the controller’s in-vivo performance and behavior in the presence of heterogeneous perfusion.
Materials and methods
Hyperthermia at 42°C was induced and maintained for up to 30 min in a circular section of a thermometry slice in the biceps femoris of German landrace pigs (n=5) using a commercial MR-HIFU system and a recently developed MPC algorithm. The heating power allocation was correlated with heat sink maps and contrast-enhanced MRI images. The temporal change in perfusion was estimated based on the power required to maintain hyperthermia.
Results
The controller performed well throughout the treatments with an absolute average tracking error of 0.27 ± 0.15 °C and an average difference of 1.25 ± 0.22 °C between and
The MPC algorithm allocates additional heating power to sub-volumes with elevated heat sink effects, which are colocalized with blood vessels visible on contrast-enhanced MRI. The perfusion appeared to have increased by at least a factor of ∼1.86 on average.
Conclusions
The MPC controller generates temperature distributions with a narrow spectrum of voxel temperatures inside the target ROI despite the presence of spatiotemporally heterogeneous perfusion due to the rapid thermometry feedback available with MR-HIFU and the flexible allocation of heating power. The visualization of spatiotemporally heterogeneous perfusion presents new research opportunities for the investigation of stimulated perfusion in hypoxic tumor regions.
Introduction
Mild hyperthermia, that is, the heating of malignant tissue to temperatures between 40 and 43 °C, sensitizes tumors for chemo- and radiotherapy (RT and CT) without introducing additional systemic toxicity [Citation1,Citation2]. This thermal enhancement effect has already been demonstrated in several clinical trials targeting a wide variety of tumors [Citation3–9]. It arises from direct denaturation of proteins [Citation10], the inhibition of repair mechanisms [Citation11–13], and the killing of cells that are RT- and CT-resistant, but vulnerable to heat, that is, cells in the ‘S-phase’ [Citation14,Citation15] or in environments that are hypoxic and acidic due to inadequate perfusion [Citation16–20]. The vasodilation following hyperthermia can also lead to increased perfusion in the tumor, resulting in sensitization to RT and CT via reoxygenation [Citation21,Citation22] and enhanced drug availability [Citation23–26]. However, maintaining a high degree of control over the spatial temperature distribution during hyperthermia treatments is vital, as the clinical outcome would be negatively impacted by both the delivery of insufficient thermal dose [Citation27–30] and vascular shutdown due to overheating [Citation31].
Devices used for clinical hyperthermia applications are currently almost exclusively based on extracorporeal antenna systems emitting electromagnetic waves (EMW) in the radiofrequency and microwave range. These devices enable the application of energy across regions with diameters of tens of centimeters (regional hyperthermia, RHT), allowing to heat large tumor volumes. However, radiative phased array systems have limited capacity for the compensation of inhomogeneous heating rates and local heat sinks due to the lack of spatially resolved real-time feedback and the inherent lower limit to the size of the focus [Citation32–35]. Temperature control is achieved via a-priori treatment planning with the help of dedicated model-based tools [Citation33] and the software-assisted adjustment of treatment parameters [Citation36] based on monitoring of the target tissue’s temperature via thermocouples [Citation37] as well as patient feedback on off-target heating [Citation38]. In the future, the use of magnetic resonance imaging (MRI)-based thermometry during EMW-hyperthermia may further improve clinical outcomes by providing the operator with 3D temperature information at higher spatial resolutions [Citation39,Citation40]. The systematic validation of a device for EMW-mediated RHT under MRI guidance is currently ongoing [Citation34,Citation35,Citation41].
Magnetic Resonance-guided High-Intensity Focused Ultrasound (MR-HIFU) presents an alternative means by which hyperthermia can be applied. HIFU-mediated hyperthermia concepts initially also relied on a-priori planning of the treatment parameters [Citation42,Citation43]. However, after the development of fast proton resonance frequency shift (PRFS)-based thermometry [Citation44,Citation45], closed-loop temperature control concepts for MR-HIFU were developed quickly [Citation46–49] and were applied in preclinical research on local drug delivery from temperature-sensitive liposomes [Citation50–53]. Clinical HIFU transducers generate coherent ultrasound fields at single frequencies in the range of 0.5 ∼ 8 MHz [Citation54]. The resulting focal heating volumes are only a few millimeters in diameter, as opposed to the volumes with diameters of tens of centimeters that are heated simultaneously with EMW devices. The heated volume in HIFU treatments can instead be increased by moving the focus, either via mechanical repositioning of the transducer (mechanical beam steering) or via coordinated phase shifts among the piezo elements on phased array transducers (electronic beam steering) [Citation55–57]. This technique has already been applied clinically by Chu et al. and Heijman et al. for hyperthermia treatments of recurrent rectal cancer and dedifferentiated liposarcoma, respectively [Citation58,Citation59]. However, earlier calculations already showed that the high spatial control in power deposition of HIFU allows compensating for differences in local tissue cooling due to tissue perfusion and around thermally significant vessels, which is not feasible using a binary control algorithm together with electronic beams steering along fixed trajectories [Citation60]. The logical next step in the development of HIFU technology for the application in hyperthermia is therefore to fully leverage the precision of HIFU and spatially resolved MR-thermometry by a transition from binary feedback control to a controller that calculates optimal sonication patterns. Model predictive control (MPC) is a modern control scheme that is widely used in the industry [Citation61,Citation62] and has already been applied in algorithms for thermal ablation therapy [Citation63–65]. MPC algorithms use a model of the system’s dynamic behavior (the state-space model) to predict the state of the system at a future time point in response to the available control inputs. Using a cost function to define the target state of the system, the best control action at a given time point is found via the variation of the control inputs such that the cost function assumes its minimum and all state- and input variables satisfy their respective constraints. This allows the processing of multidimensional inputs like temperature maps into multidimensional outputs like heating power distributions, thereby enabling the online adaption of sonication patterns to the current distribution and strength of heat sinks.
While MR-HIFU mediated hyperthermia has not yet been widely adopted clinically alongside EMW-mediated RHT, the combination of rapid PRFS-thermometry and precise heating provides the potential for unmatched temporal and spatial temperature control. Recently we presented the architecture of a model predictive control (MPC) algorithm for MR-HIFU mediated local hyperthermia and characterized its performance in a perfused tissue-mimicking phantom in comparison to the current state-of-the-art binary feedback controller [Citation57,Citation66]. We showed that the MPC algorithm yields superior performance in-vitro via the targeted compensation of heat loss due to diffusion and local heat loss induced by an artificial blood vessel. In this study, we present results from the in-vivo application of the MPC algorithm in porcine thigh muscle. The aim is to evaluate the controller’s performance in live tissue and to investigate the interplay between its flexible heating power allocation and spatiotemporally varying perfusion.
Materials and methods
Animal model
The performance of an MPC algorithm for the creation and maintenance of local hyperthermia was investigated in muscle tissue of the biceps femoris of five healthy, female German landrace pigs between 35 and 39.5 kg in weight. The experimental protocol was approved by the State Agency for Nature, Environment and Consumer Protection of North-Rhine Westphalia, Germany.
Starting 12 h prior to the experiment, the pigs were fasted with free access to water. At the beginning of the experiment, the animals received an intramuscular injection of atropine (0.02 mg/kg; WDT, Germany), tiletamin/zolazepam (10 mg/kg; Zoletil, Virbac, Germany), and xylazine (2 mg/kg; Rompun 2%; Bayer; Germany). Anesthesia was induced and maintained intravenously using propofol (induction: 1.66 mg/kg i.v., maintenance: 4.0–9.5 mg/kg/h as required; Fresenius, Bad Homburg, Germany). Analgesia was achieved by intravenous administration of buprenorphine (0.02 mg/kg; Buprenovet Multidose, Bayer, Germany). The pigs were intubated and ventilated under pressure control (Hamilton C1, Heinen + Löwenstein, Switzerland) at 30% oxygen, 14 breaths/min, and positive end-expiratory pressure (PEEP) of 5–8 mmHg. The tidal volume was adjusted as needed to maintain normocapnia (PaCO2 35–45 mmHg). A catheter with three lumens (18 G; Arrow International, Reading, USA) for the continuous administration of propofol and Ringer’s solution (5 ml/kg/h; Fresenius Kabi, Germany) and the administration of other medication was placed in the right external jugular vein using the Seldinger technique.
The animals were placed inside the MRI scanner in right lateral recumbency with the biceps femoris above the acoustic window of the HIFU table (). A rubber tube containing MR-visible oil capsules was affixed to the right thigh to allow localization of the targeted volumes during dissection (). Acoustic contact was achieved by shaving, the application of degassed ultrasound gel and the interposition of an acoustic coupling gel pad (Aquaflex® Ultrasound Gel Pad 4 × 27.5 × 27.5 cm, Parker Laboratories, Farfield, NJ, USA). Degassed and deionized water was used to ensure acoustic coupling between the acoustic membrane of the HIFU table and the gel pad. After positioning of the animal in the scanner was completed, a muscle relaxant (initial bolus: 0.1 mg/kg, infusion: 36 mg/h/kg; Pancuroniumbromid Rotexmedica 2 mg/ml, Panpharma GmbH, Trittau, Germany) was administered to prevent shivering.
Figure 1. Experimental setup. (A) The animal is positioned on the HIFU table such that the biceps femoris can be sonicated. (B) The rubber tube containing fish oil capsules is visible in MRI and is used to document the target site. (C) MRI with temperature map overlay. Yellow contour: Drift correction ROI with manually excluded areas. Red contour: Target ROI.
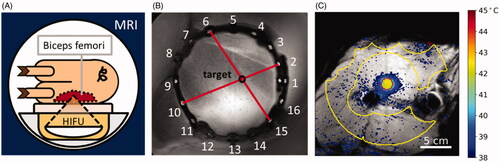
Up to three hyperthermia treatments with a target temperature of 42 °C were performed in each animal and were each continued for up to 30 min. In total, n = 10 treatments were performed throughout the study. Each treatment targeted a different point in the biceps femoris of the right leg. The target points were always separated by at least 3 cm. After the end of each treatment, temperature mapping was continued for up to 15 min and a minimum waiting time of 30 min was maintained between sonications to ensure the restoration of thermal equilibrium. The target points were positioned in the highly perfused areas close to the femur to maximize the likelihood of blood vessels being present in the vicinity (). The animals were returned to the stable eight hours after the beginning of anesthesia and were allowed to recover for 48 h under observation. Finally, the animals were euthanized using sodium-pentobarbital (150 mg/kg i.v., Euthadorm®, CP-Pharma, Burgdorf, Germany).
Experimental setup
The hyperthermia treatments were performed on a clinical MR-HIFU system (3T Achieva®, Philips Healthcare, Best, The Netherlands, and Sonalleve® V2 HIFU, Profound Medical, Mississauga, Canada). During single-point sonications at 1.2 MHz in water, the transducer in this system generates ellipsoid focal volumes with 6 dB diameters of 1.7 mm and 13.6 mm perpendicular and along the transducer axis, respectively. During such sonications, 48.8% of the transducer’s output power pass through the focal volume and a time-averaged peak focal intensity of 57.5 W/cm2 per Watt of nominal output power is reached. Treatment planning and feedback control of the temperature during treatment was performed using a python-based software developed in-house and a model predictive control algorithm. The python-based software provides a user interface with tools for the planning and monitoring of treatments and communicates with the hardware using the pyMRI and pyHIFU packages of Zaprozan et al. [Citation67].
Magnetic resonance imaging
All images were acquired using the HIFU table’s window coil and the HIFU pelvis coil (Model 905051-F, Philips Healthcare, Best, The Netherlands) on a 3T MRI scanner (3 T Achieva®, Philips Healthcare, Best, The Netherlands).
Pretreatment imaging
The treatment planning was performed using a 3D T1-weighted fast field echo (FFE) without fat suppression. The used parameters were TE = 2.3 ms, TR = 6.1 ms, FA = 20°, acquisition matrix = 88 × 166, number of slices = 167, reconstructed (acquired) voxel dimensions = 0.49 × 0.49 × 1.50 mm3 (1.52 × 1.53 × 3.00 mm3), FOV = 140 × 261 × 250 mm3, fold-over direction = RL. Constant Level Appearance (CLEAR) was used to achieve higher signal homogeneity and Sensitivity Encoding (SENSE, P reduction = 1.2, S reduction = 1) was used to accelerate imaging. This resulted in an acquisition duration of 5.5 min.
MR thermometry
The imaging sequence used to monitor the treatment progress was an RF-spoiled gradient echo sequence with TR = 30 ms, TE= 19.5 ms, FA = 19.5°, FOV = 288 × 288 mm3, 6 slices, and voxel dimensions = 1.8 × 1.8 × 7 mm3, resulting in an acquisition time of 3.7 s for a full set of slices and a resolution of 160 × 160 voxels per slice. The temperature maps were acquired via the proton resonance frequency shift (PRFS) [Citation44]. In particular, the calculation included masking of low SNR voxels, masking of the expected heating area and of areas exhibiting strong thermometry artifacts, baseline subtraction, and a second-order baseline drift correction. The MRI slices were positioned in four stacks, namely the focus, sagittal, near field, and far-field stacks. The focus stack contained three slices, all other stacks contained one slice. The focus stack was oriented perpendicular to the transducer axis, centered on the target point, and contained three slices to provide a complete view of the volumetric temperature distribution in the target ROI, with the center slice of the focus stack functioning as feedback for the MPC algorithm. The sagittal stack was oriented in sagittal orientation and was centered on the focus spot. It provides information on the vertical alignment of the focus. The near-field stack was positioned at the pig’s skin to monitor excess heat generation in the hydrogel spacer, indicative of excessive absorption. The far-field stack was positioned deep to the focal area.
Postinterventional imaging
After all hyperthermia treatments were complete, the perfusion of the pig’s hind legs was visualized. The purpose of this was to determine whether the hyperthermia treatments had unintentionally induced vascular shutdown and to localize the blood vessels in the vicinity of the treated target areas. This step was only performed after the hyperthermia treatments as the presence of contrast agents in the tissue of the animals would have interfered with MRI thermometry [Citation68]. The employed technique was contrast-enhanced (CE) MRI, using the 3D T1-weighted FFE sequences described above for treatment planning. The images were acquired twice, both before and one minute after intravenous contrast agent injection (0.1 mmol/kg gadoteric acid, Dotagraf®, Jenapharm GmbH & Co. KG, Jena, Germany). The parameters and field of view of the post-treatment scans were kept the same as the planning scans. The presence of non-perfused volumes (NPVs) was determined by subtracting pre- and post-injection CE MR images.
Controller architecture
The controller is designed to create a uniform temperature distribution in a user-defined target region of interest (target ROI) in the central slice of the MR-thermometry focus stack. Steering of the focus position is performed via electronic beam steering exclusively. This results in maximum diameter of 18 mm for the target area, which is used in this study. The controller follows the MPC paradigm and was described in detail in a previous article [Citation66].
State-space model
The state-space model that will be used in the MPC scheme is based on the Pennes bioheat transfer equation (PBE) [Citation69], incorporating heat loss via local perfusion, diffusion of heat and heating by an external source:
(1)
(1)
where
is the density of the tissue [kg/m³],
is the thermal conductivity [W/(°C·m)],
and
are the specific heat capacities of tissue and blood [J/(kg·°C)],
is the perfusion rate [kg/(m³·s)],
is the tissue’s temperature [°C],
is the arterial temperature [°C], and
is the heating power density delivered to the tissue [W/m³]. It was assumed that
and
are homogeneous and constant.
The MPC regulates the temperature in a two-dimensional grid of voxels with grid spacing that is, the in-plane voxel size, and the grid positions
The diffusion term of the PBE was therefore discretized with the finite difference approximation of the Laplacian operator in two dimensions.
(2)
(2)
As the information on the tissue temperatures in adjacent parallel planes is time-shifted due to the sequential acquisition of temperature maps, out of plane diffusion is handled by introducing the apparent perfusion rate which replaces
The sonication points that were made available to the controller were chosen to lie in the center of voxels inside the target ROI. These voxels constituted the target ROI’s edge and were arranged in a checker pattern everywhere else inside the target ROI. The heating power density was discretized under the assumptions that energy dissipation is limited to the targeted voxel and that the absorption coefficient
[
] is homogeneous throughout the tissue. Attenuation of the ultrasound in the subcutaneous fat layer and in muscle was calculated with the attenuation coefficients
and
taken from [Citation70] and the tissue layer thicknesses
and
measured along the transducer axis. With the sonication power allocated to grid position
[W], and the voxel volume
[m³],
is described by
(3)
(3)
Finally, the temperature was replaced by the temperature elevation above
The step size for the discretization in time is the acquisition time for a full set of thermometry slices,
At timestep
in the voxel at the grid position
is therefore described by
(4)
(4)
(5)
(5)
where
is the heat retention coefficient, which incorporates the loss due to perfusion and the diffusion out of the voxel,
is the per-dynamic inter-voxel heat transfer coefficient, and
is the target voxel heating coefficient [°C/W]. The sonication powers
are constrained to be greater than or equal to zero and to total no more than a specified maximum power
at each timestep
The maximum power
was set to 60 W in all experiments.
Cost function
The optimal distribution of heating power was determined via constrained optimization of the cost function. For this controller, it has been given the form
(6)
(6)
where
is the control horizon,
is the set of grid positions belonging to the voxels inside the target ROI,
is the number of voxels inside
and
is the target temperature elevation. The control horizon determines how many future timesteps are considered in the optimization. For this study,
was set to 5 to allow for heat exchange between the target area’s center and edge to be modeled while minimizing runtime.
Focal spot calibration and model identification
The transducer’s alignment with the MRI’s coordinate system was verified using multiple 16 s long test sonications at 60 W of acoustic output power before each experiment. During the test sonication, the HIFU focus was rapidly moved on a trajectory consisting of the transducer’s natural focus and eight points equally distributed on an 8 mm circle around the natural focus by electronic beam steering. Offsets from the intended centers of heating were corrected by adjusting the transducer’s position inside the HIFU table.
After alignment was verified, the MRI thermometry maps gathered during three additional test sonications were used to calibrate the state-space model’s parameters. The estimation of the and
parameters are performed via linear regression, for which all voxels within a radius of 2 cm around the target area are included. The voxels’ temperatures at each timestep
after transducer shutoff were used as the dependent variable. The respective voxel’s temperature at time
(parameter
) as well as the sum of the nearest neighbors’ temperatures at time
(parameter
) were used as the regressors. The model used, therefore, has the following form:
(7)
(7)
The linear regression was performed using the Python package scikit-learn, version 0.18.1 [Citation71].
After the calculation of and
is complete, the target voxel heating coefficient
is calculated via linear regression. Here, the total temperature increase across all voxels in a radius of 20 mm around the natural focus at each timestep
serves as the dependent variable and the retained fraction of the power added to the target slice is used as the regressor. This results in a linear model of the form
(8)
(8)
where
is the acoustic output power selected for the sonication,
is the set of grid positions of all voxels within a radius of 20 mm around the transducer’s natural focus and
is the fraction of power retained in the focus slice from one cycle to the next.
In the first two animals, was calculated by dividing the accumulated thermal load in the last temperature map of the test sonication by the total test sonication duration at the time of acquisition. However, the resulting absorption coefficients were notably higher than expected and exhibited large variability, prompting the development of the method described above.
Data analysis
Sonication metrics
The quality of the hyperthermic temperature control during the sonications was evaluated using parameters that were calculated from the temperature voxel values within the target ROI. The target ROI was placed in the center temperature mapping slice of the focus stack. The steady-state performance of the MPC was calculated from PRFS voxel temperature data acquired between 300 s and the end of the sonication. The used parameters were the mean temperature in the target ROI TAvg the 10th and 90th percentile of the voxel temperature distribution and
the standard deviation of the voxel temperatures in the target ROI
and the cost finction J,
of 1.
Spatial power allocation and equivalent voxel perfusion
The ability of the controller to counteract localized heat loss was investigated by superimposing the power applied to each voxel on the contrast-enhanced MRI scans that were acquired after the conclusion of the treatments. For this purpose, the power distribution of each treatment was averaged over the first minute after reaching the 300 s time point and the last minute before transducer shutoff. Additionally, the combined effect of heat diffusion and perfusion on the temperature of each voxel during cooldown was determined via linear regression. This equivalent voxel perfusion rate was superimposed on the same MRI slices to verify the colocalization of local heat sinks and blood vessels. It was calculated by fitting the discretized PBE to the thermometry data acquired during the first minute after transducer shutoff while holding
(9)
(9)
Analysis of the model error over time
The temperature distribution predicted by EquationEquation (4)(4)
(4) was calculated for each timestep from the PRFS temperature map and the applied heating pattern of the previous timestep. The resulting prediction was subtracted from the PRFS temperature map measured at the respective timestep to obtain the prediction error in each voxel at each timestep. The arithmetic mean of the prediction error in each voxel of the target ROI was calculated in each timestep to obtain the mean target ROI prediction error
Additionally, the prediction error in a sub-volume of each target ROI
was investigated. The sub-volumes consisted of the voxel in the target ROI to which most energy had been allocated throughout the sonication and those of its nearest neighbors which also contained an allowed sonication point. The behavior of
and
was modeled as a linear combination of the prediction errors arising from a time-dependent perfusion parameter mismatch
and an absorption parameter mismatch
(10)
(10)
where
is the total power applied to the respective area (either the entire ROI or the sub-ROI) and
is the slope of the temporal change. The intercept
incorporates the perfusion- and heat diffusion parameter errors arising from the a-priori model identification and the equilibration of diffusion losses. The diffusion losses were assumed to reach equilibrium by 300 s. Therefore, all the time points between 300 s and the end of the sonication were considered for this analysis. Experiments that were terminated prematurely and experiments that exhibited signs of phase drift were excluded.
Results
Model identification
The model parameters calculated from the PRFS temperature maps acquired during the test sonications and the derived thermal properties are listed in . The listed parameters were used as model parameters in the hyperthermia experiments following the respective model identification, see Section “Focal spot calibration and model identification”.
Table 1. Identified model parameters and corresponding physiological quantities.
Hyperthermia experiments
The controller performance for all hyperthermia experiments is summarized in . Among
and
only
showed a statistically significant difference between the value during the beginning of the steady-state phase (
) and the value shortly before transducer shutdown (
) in a two-sided, paired t-test (p = .01). An example PRFS temperature curve and corresponding PRFS temperature maps for different phases of the hyperthermia sonication are shown in . The controller first reached a mean temperature of 42 °C in the target area at 53.7 ± 9.0 s after the start of the sonication. The average absolute tracking error (
) during steady-state was 0.27 ± 0.15 °C. Treatment 4/3 was canceled prematurely due to time constraints in the animal protocol. NPVs were not observed in post-treatment CE MRI. Except for experiments 4/1 and 5/1, the average PRFS thermometry readings in the target ROI returned to baseline in all experiments, indicating the absence of excessive phase drift. The drift in experiments 4/1 and 5/1 was traced back to a problem in the phase unwrapping step.
Figure 2. Example of temperature evolution and temperature/power distribution during different control phases during a sonication, treatment 5/1. The black outline shows target ROI and the points inside the target ROI indicate power allocation. (A) Warmup phase, power is allocated primarily to the ROI’s center. (B) Beginning of steady-state phase; power is allocated primarily to the edges of the target ROI. (C) Late steady-state phase, immediately before the end of the sonication. Power is allocated to the edge and heterogeneously throughout the target ROI.
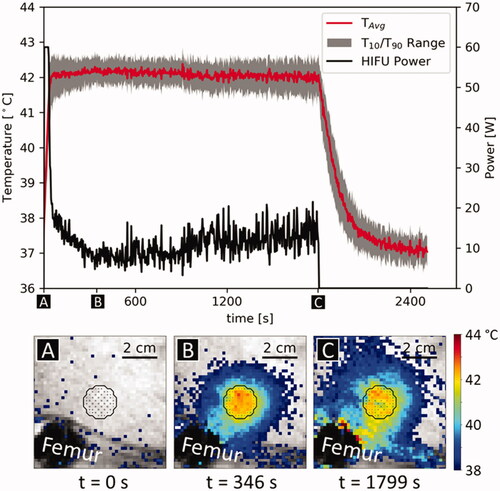
Table 2. Overview of sonication metrics.
Animals 2 and 3 exhibited localized erythema and swelling on the treated leg. The erythema was colocalized with air bubbles visible on MRI and resolved within 24 h in both animals. Limping or other behaviors indicating discomfort in the treated leg were not observed in any animal.
Spatial power allocation and equivalent perfusion
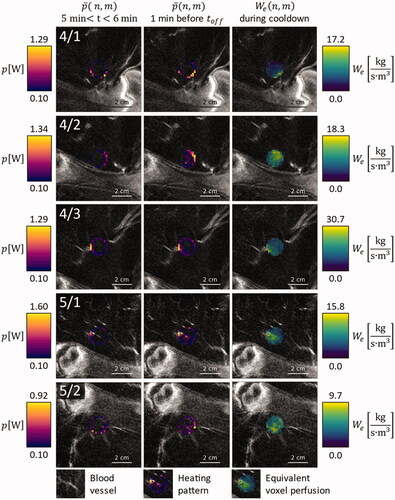
At the beginning of the sonications, heating power was allocated to the edges of the target ROI and was elevated in areas that showed elevated perfusion in the CE MRI scans ( and , leftmost columns). By the end of the sonication, the latter effect was enhanced in almost all cases ( and , middle columns). The only exception in this regard was treatment 4/3, which was canceled after only 10 min to stay below the maximum anesthesia duration defined in the animal protocol. The allocation of additional heating power at the end of the sonication was colocalized with areas of elevated which were identified by fitting the thermometry data that was acquired after transducer shutoff ( and , rightmost columns).
Figure 3. Overlay on contrast enhanced MRI images of the respective anatomical region, for animals 1, 2, and 3: Average power application pattern during the first minute after warmup (leftmost column), during the last minute before HIFU shutdown (middle column) and equivalent voxel perfusion during the first minute of cooldown (rightmost column).
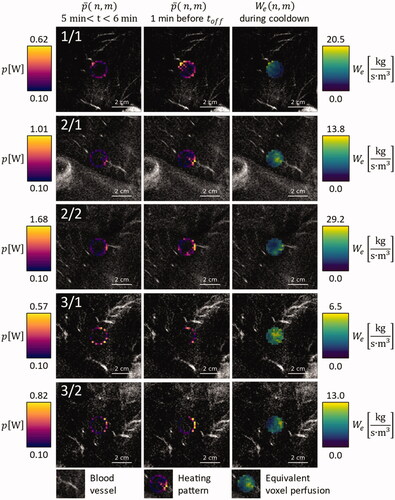
Figure 4. Overlay on contrast enhanced MRI images of the respective anatomical region, for animals 4 and 5: Average power application pattern during the first minute after warmup (leftmost column), during the last minute before HIFU shutdown (middle column) and equivalent voxel perfusion during the first minute of cooldown (rightmost column).
Analysis of dynamic processes
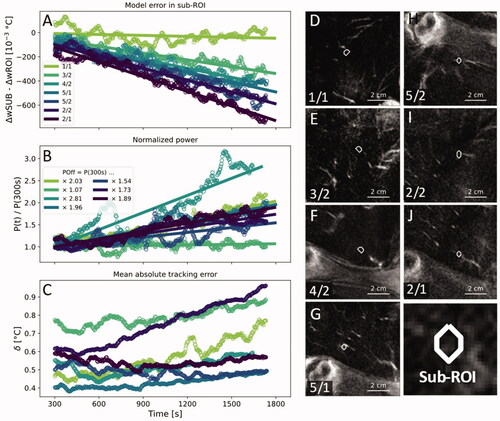
The difference between time-dependent prediction errors of the sub-volumes and of the entire target ROIs between the equilibration at 300 s and the end of the sonication show a clear negative correlation with time, indicating a localized increase of heat loss over the period of the HIFU treatment (). Over the course of the 25 min between equilibration and the end of the sonication, five of seven power levels rose by a factor between 1.54 and 2.03. One power level rose by a factor of 2.81 (treatment 4/2) and one power level rose by a factor of 1.07 (treatment 3/2). On average, the power level required to maintain hyperthermia rose by a factor of 1.86 (). Changes in the mean absolute tracking error in the target ROI
were small in five of the seven treatments with changes in the range of 0.1 K. Two treatments (1/1,2/2) showed an increase in
of more than 0.2 K (). All sub-volumes except the sub-volume of treatment 4/2 contained a blood vessel with a diameter close to the in-plane voxel size of 1.53 mm. The closest vessel in treatment 4/2 was at a distance of 7.1 mm from the sub-volume and had a diameter of ∼2.6 mm, which is close to twice the in-plane voxel size ().
Figure 5. (A) The time-dependent model error in the sub-volumes around the voxel that had received the highest amount of heating energy minus the time-dependent model error in the entire ROI. (B) Total applied HIFU power normalized by the output power at 300 s. (C) Mean absolute tracking error in the target ROI. A one-minute moving average was applied to all data points in (A–C) to enhance clarity. (D–J) Contrast-enhanced MRI with superimposed outlines of the investigated sub-volumes in order from smallest to largest slope in (A). White arrowheads indicate blood vessels that adjoined or penetrated the target ROIs.
Discussion
We have investigated the performance of a model-predictive controller for MR-HIFU-mediated local hyperthermia at 42 °C for up to 30 min in a series of in vivo studies. The controller quickly stabilized the temperature in the target area with small steady-state tracking errors and narrow temperature distributions. While the heating power was uniformly distributed across the target area at the start of each experiment, the controller gradually allocated additional heating power to areas with local heat sinks, which were colocalized with blood vessels. Analysis of the difference between the modeling error at these localized heat sinks and the modeling error in the entire target ROI revealed a time-dependent component with a negative slope, which accumulated considerable magnitude in some cases.
In a previous article, we have shown that the MPC outperforms the state-of-the-art binary hyperthermia controller in a tissue-mimicking phantom both in terms of tracking error and uniformity of the temperature distribution [Citation57,Citation66]. A comparison of the in-vivo results presented here with the in-vivo results published for the binary controller that was acquired under similar conditions (target areas in the thigh muscle of pigs, 18 mm diameter, target temperature of 42 °C or 42.5 °C [Citation57,Citation72]) also indicates that the MPC generates a narrower temperature distribution in-vivo ( 1.25 ± 0.22 °C vs. 1.84 ± 0.23 °C for the MPC and the binary controller, respectively). In terms of target temperature tracking, the difference in the controllers’ performance is smaller than the measurement error (
0.27 ± 0.14 °C vs. 0.19 ± 0.12 °C for the MPC and the binary controller, respectively) based on the data presented here and in the literature [Citation57,Citation72].
It is likely that the tracking errors of both controllers can be reduced by more closely adapting the applied heating power to the energy losses by diffusion and perfusion. In the MPC, this could be achieved by refining the fidelity of the model. The average thermal conductivity determined in the model calibration was lower than the value of
reported in the literature [Citation73], likely resulting in an underestimation of in-plane diffusion. The average apparent perfusion parameter
was much higher than the literature reference of
for regional blood flow [Citation74]. While the latter was expected due to the incorporation of out-of-plane diffusion into
it may be possible to improve the target temperature tracking performance of the MPC slightly by directly modeling out-of-plane diffusion and implementing more refined parameter estimation methods such as the ones proposed by Dillon and Dragonu [Citation75,Citation76]. However, as hyperthermia is expected to stimulate perfusion, the identified perfusion parameter may become increasingly inaccurate [Citation31,Citation77]. The extension of the MPC to a fully offset-free MPC algorithm as recently developed by Deenen et al. [Citation78] may therefore yield more robust results by constantly updating the model based on comparisons between the predicted and the measured temperature distributions of past feedback steps.
The MPC’s advantage over the binary algorithm in terms of uniformity may stem from the MPC’s flexible allocation of heating power, while the binary scheme only permits the application of one power level per feedback cycle throughout the target ROI. Consequently, the MPC algorithm can compensate for spatially heterogeneous absorption and heat sink effects more effectively and can react to the increase of perfusion that occurs during hyperthermia by adapting the used sonication pattern. Throughout this study, we have consistently observed an allocation of additional heating power to the locations of blood vessels, which became more pronounced over the course of the treatment and aligned with areas of rapid heat loss identified after transducer shutoff. This targeted compensation of local heat sinks should allow to adequately heat heterogeneously perfused tumors without causing vascular shutdown due to overheating, which is still a challenge today [Citation19,Citation79]. This is also made possible in part by the rapid feedback provided by PRFS thermometry, which allowed the controller to maintain highly uniform temperature distributions despite the pronounced local modeling errors that were observed in this study ().
Any results regarding perfusion obtained in this study must be considered qualitative due to the lack of a gold standard measurement like radioactive microspheres, and the mismatch of the calculated perfusion and diffusion parameters with values reported in the literature [Citation73,Citation74,Citation80,Citation81]. The CE MRI data in particular can only serve as an indicator for the presence of blood vessels as the vessel diameters are close to the voxel size of the images and the time periods between the hyperthermia treatments and the acquisition of the CE MR images were not standardized. Nonetheless, a thermoregulation response can clearly be seen via the localized change in the modeling error close to blood vessels relative to the rest of the ROI and the increase in the power required to maintain the target temperature. Working under the assumption that diffusion heat loss remains constant after 300 s, we can establish a lower bound for the thermoregulation response in the target area. In our study, we observed an increase in heating power by a factor of 1.86 between 300 s and transducer shutoff on average. Given that the power applied at 300 s was expended entirely to compensate for perfusion losses, this translates into an increase in perfusion by the same factor, which is close to the responses reported by Lokshina et al. for the leg muscles of male Sprague-Dawley rats [Citation82]. As at least part of the power at 300 s must have been expended to compensate for diffusion losses, the true factor is likely higher than 1.86 in pigs. To our knowledge, comparable results have not yet been published for large animals or human subjects.
The visualization of spatially heterogenous heat sink effects and the estimation of perfusion changes as a response to hyperthermia presents an opportunity for future research. Most studies concerning the physiological response of tumor vasculature to elevated temperatures were conducted in the 1980s and only quantified averages across the whole tumor via radioactive microspheres [Citation79]. Using a high-performance controller for MR-HIFU hyperthermia and post-hoc, high-fidelity thermal modeling on small length scales, it may be possible to gather new insight on the optimal conditions for the reperfusion and reoxygenation of tumor entities that are highly refractory to chemo- and radiotherapy. A suitable thermal model for the purpose of estimating the local ratio between perfusion and diffusion losses in heterogeneous tissues may be the discrete vasculature (DIVA) model originally developed by Kotte et al. [Citation83,Citation84]. In thermal simulations, the results obtained with models featuring discrete vasculature differ substantially from results obtained with models based on the Pennes bioheat equation [Citation85] and the former show much better agreement with noninvasive thermometry data [Citation86].
Future avenues for improvement include a more robust thermometry algorithm. This will become especially important for applications in abdominal organs, where both periodic and aperiodic motion will be encountered [Citation87]. Possible strategies of implementing thermometry for MR-HIFU hyperthermia under motion have recently been demonstrated by Pichardo et al. in the form of a multi-baseline approach with the use of a pencil-beam navigator [Citation88] and by Bing et al. in the form of thermometry acquisition during repeated breath holds [Citation89]. For the heating of extended volumes under motion, the application of heat in a fractionated manner as recently demonstrated by Santos et al. appears to be the most feasible option in the short term [Citation90] and appears to be synergetic with an MPC algorithm that incorporates sonication breaks in its state-space model. Furthermore, this control algorithm could be extended to treat larger target volumes by including temperature control in additional parallel monitoring slices and adding lateral transducer movement. With these additions and to safely treat highly perfused volumes, a strategy for near-field temperature management would be necessary as well [Citation57]. Integration of these features will be indispensable to the clinical translation of the controller. Finally, we have observed considerable localized deviations from the expected thermal behavior of the heated region that is consistent with a thermoregulation response (). While this does not necessarily lead to a substantial decline in controller performance thanks to the rapid thermometry feedback available with MR-HIFU, it warrants the investigation of offset-free control strategies [Citation78]. Besides improving controller performance both in terms of target temperature tracking and uniformity of the temperature distribution, these may be of special interest for drug delivery applications with temperature-sensitive liposomes, where the rate of release depends on the temperature of the blood [Citation91].
The main limitation of this study is the lack of a tumor in the target area. The perfusion of tumors is heterogeneous [Citation79], generally reacts less strongly to heating than muscle tissue [Citation92,Citation93] and considerable variability among preclinical tumor entities has been observed [Citation94,Citation95]. Tumors may also have acoustic characteristics distinct from healthy surrounding tissue [Citation96]. The controller performance reported here may therefore not be representative of the performance that would be observed in the clinical case. Nonetheless, the developed MPC exhibits high performance in the presence of spatially heterogeneous and time-dependent perfusion. We, therefore, believe that the investigation of MPC algorithms for MR-HIFU hyperthermia in the clinical setting is warranted.
In conclusion, we have demonstrated the use of an MPC algorithm for MR-HIFU-mediated hyperthermia in a large animal model. The MPC algorithm provides uniform temperature distributions in the presence of heterogeneous perfusion by allocating additional heating power to localized heat sinks. MR-HIFU-mediated highly uniform hyperthermia holds the promise of detailed insight into the interplay between spatiotemporally heterogeneous perfusion and heating and the thermal enhancement effect. Clinically, it may become a tool for the treatment of deep-seated tumors that cannot be heated uniformly with other modalities.
Acknowledgments
The authors would like to thank Simon Hubertus (Profound Medical, Mississauga, Canada) for the acoustic field simulations of the test sonication protocol.
Disclosure statement
Edwin Heijman is employed by Philips. Sin Yuin Yeo is partly employed by Profound Medical. Juan Daniel Castillo Gómez is employed by Pentixapharm GmbH.
Additional information
Funding
References
- Issels RD. Hyperthermia adds to chemotherapy. Eur J Cancer. 2008;44(17):2546–2554.
- Horsman MR, Overgaard J. Hyperthermia: a potent enhancer of radiotherapy. Clin Oncol. 2007;19(6):418–426.
- Issels RD, Lindner LH, Verweij J, et al. Effect of neoadjuvant chemotherapy plus regional hyperthermia on long-term outcomes among patients with localized high-risk soft tissue sarcoma. JAMA Oncol. 2018;4(4):483–492.
- Franckena M, Stalpers LJA, Koper PCM, et al. Long-term improvement in treatment outcome after radiotherapy and hyperthermia in locoregionally advanced cervix cancer: an update of the Dutch deep hyperthermia trial. Int J Radiat Oncol Biol Phys. 2008;70(4):1176–1182.
- Van der Zee J, González González D, Van Rhoon GC, et al. Comparison of radiotherapy alone with radiotherapy plus hyperthermia in locally advanced pelvic tumours: a prospective, randomised, multicentre trial. Lancet. 2000;355(9210):1119–1125.
- Overgaard J, Bentzen SM, Overgaard J, et al. Randomised trial of hyperthermia as adjuvant to radiotherapy for recurrent or metastatic malignant melanoma. Lancet. 1995;345(8949):540–543.
- Vernon CC, Hand JW, Field SB, et al. Radiotherapy with or without hyperthermia in the treatment of superficial localized breast cancer: results from five randomized controlled trials. Int J Radiat Oncol Biol Phys. 1996;35:731–744.
- Jones EL, Oleson JR, Prosnitz LR, et al. Randomized trial of hyperthermia and radiation for superficial tumors. J Clin Oncol. 2005;23(13):3079–3085.
- Cihoric N, Tsikkinis A, Rhoon GV, et al. Hyperthermia-related clinical trials on cancer treatment within the ClinicalTrials. gov registry. Int J Hyperth. 2015;31(6):609–614.
- Dewey WC, Hopwood LE, Sapareto SA, et al. Cellular responses to combinations of hyperthermia and radiation. Radiology. 1977;123(2):463–474.
- Eppink B, Krawczyk PM, Stap J, et al. Hyperthermia-induced DNA repair deficiency suggests novel therapeutic anti-cancer strategies. Int J Hyperth. 2012;28(6):509–517.
- Konings AWT. Interaction of heat and radiation in vitro and in vivo. In: Seegenschmiedt MH, Fessenden P, Vernon CC, editors. Thermoradiotherapy and thermochemotherapy. Amsterdam (The Netherlands): Springer; 1995. p. 89–102.
- Powell SN, Kachnic LA. Homologous recombination research is heating up and ready for therapy. Proc Natl Acad Sci USA. 2011;108(24):9731–9732.
- Westra A, Dewey WC. Variation in sensitivity to heat shock during the cell-cycle of chinese hamster cells in vitro. Int J Radiat Biol Relat Stud Phys Chem Med. 1971;19(5):467–477.
- Malyapa RS, Sawada S. Variation in heat sensitivity through the cell cycle of M10 and Burkitt P3HR-1 cells. Int J Hyperthermia. 1992;8(4):463–473.
- Gerweck LE. Modification of cell lethality at elevated temperatures the pH effect. Radiat Res. 2012;70(1):224–235.
- Freeman ML, Dewey WC, Hopwood LE. Effect of pH on hyperthermic cell survival: brief communication. J Natl Cancer Inst. 1977;58(6):1837–1839.
- Horsman MR, Overgaard J. The impact of hypoxia and its modification of the outcome of radiotherapy. J Radiat Res. 2016;57(S1):i90–i98.
- Datta NR, Kok HP, Crezee H, et al. Integrating loco-regional hyperthermia into the current oncology practice: SWOT and TOWS analyses. Front Oncol. 2020;10:819.
- Vaupel P. Pathophysiology of solid tumors. In: Molls M, Vaupel P, Nieder C, Anscher MS, editors. The impact of tumor biology on cancer treatment and multidisciplinary strategies. Amsterdam (The Netherlands): Springer; 2009. p. 51–92.
- Zywietz F, Reeker W, Kochs E. Changes in tumor oxygenation during a combined treatment with fractionated irradiation and hyperthermia: an experimental study. Int J Radiat Oncol Biol Phys. 1997;37(1):155–162.
- Vujaskovic Z, Song CW. Physiological mechanisms underlying heat-induced radiosensitization. Int J Hyperthermia. 2004;20(2):163–174.
- Dewhirst MW, Secomb TW. Transport of drugs from blood vessels to tumour tissue. Nat Rev Cancer. 2017;17(12):738–750.
- De Smet M, Langereis S, Van den Bosch S, et al. SPECT/CT imaging of temperature-sensitive liposomes for mr-image guided drug delivery with high intensity focused ultrasound. J Control Release. 2013;169(1–2):82–90.
- Lokerse WJM, Bolkestein M, Hagen TLM, et al. Investigation of particle accumulation, chemosensitivity and thermosensitivity for effective solid tumor therapy using thermosensitive liposomes and hyperthermia. Theranostics. 2016;6(10):1717–1731.
- Farr N, Wang Y-N, D’Andrea S, et al. Hyperthermia-enhanced targeted drug delivery using magnetic resonance-guided focussed ultrasound: a pre-clinical study in a genetic model of pancreatic cancer. Int J Hyperth. 2018;34(3):284–291.
- Sapareto SA, Dewey WC. Thermal dose determination in cancer therapy. Int J Radiat Oncol. 1984;10(6):787–800.
- Franckena M, Fatehi D, M de B, et al. Hyperthermia dose-effect relationship in 420 patients with cervical cancer treated with combined radiotherapy and hyperthermia. Eur J Cancer. 2009;45(11):1969–1978.
- Bakker A, Van Der Zee J, Van Tienhoven G, et al. Temperature and thermal dose during radiotherapy and hyperthermia for recurrent breast cancer are related to clinical outcome and thermal toxicity: a systematic review. Int J Hyperth. 2019;36(1):1023–1038.
- Ohguri T, Harima Y, Imada H, et al. Relationships between thermal dose parameters and the efficacy of definitive chemoradiotherapy plus regional hyperthermia in the treatment of locally advanced cervical cancer: data from a multicentre randomised clinical trial. Int J Hyperth. 2018;34(4):461–468.
- Vujaskovic Z, Poulson JM, Gaskin AA, et al. Temperature-dependent changes in physiologic parameters of spontaneous canine soft tissue sarcomas after combined radiotherapy and hyperthermia treatment. Int J Radiat Oncol Biol Phys. 2000;46(1):179–185.
- Crezee J, Lagendijk JJW. Temperature uniformity during hyperthermia: the impact of large vessels. Phys Med Biol. 1992;37(6):1321–1337.
- Kok H, Wust P, Stauffer P, et al. Current state of the art of regional hyperthermia treatment planning: a review. Radiat Oncol. 2015;10:196.
- Curto S, Aklan B, Mulder T, et al. Quantitative, multi-institutional evaluation of MR thermometry accuracy for deep-pelvic MR-hyperthermia systems operating in multi-vendor MR-systems using a new anthropomorphic phantom. Cancers. 2019;11:1709.
- Mulder HT, Curto S, Paulides MM, et al. Systematic quality assurance of the BSD2000-3D MR-compatible hyperthermia applicator performance using MR temperature imaging. Int J Hyperth. 2018;35(1):305–313.
- Kok HP, Korshuize- Van Straten L, Bakker A, et al. Online adaptive hyperthermia treatment planning during locoregional heating to suppress treatment-limiting hot spots. Int J Radiat Oncol Biol Phys. 2017;99(4):1039–1047.
- Kok HP, Cressman ENK, Ceelen W, et al. Heating technology for malignant tumors: a review. Int J Hyperth. 2020;37(1):711–741.
- Bruggmoser G, Bauchowitz S, Canters R, et al. Quality assurance for clinical studies in regional deep hyperthermia. Strahlenther Onkol. 2011;187(10):605–610.
- Feddersen TV, Hernandez-Tamames JA, Franckena M, et al. Clinical performance and future potential of magnetic resonance thermometry in hyperthermia. Cancers. 2020;13(1):31.
- Unsoeld M, Lamprecht U, Traub F, et al. MR thermometry data correlate with pathological response for soft tissue sarcoma of the lower extremity in a single center analysis of prospectively registered patients. Cancers. 2020;12(4):959.
- Curto S, Mulder HT, Aklan B, et al. A multi-institution study: comparison of the heating patterns of five different MR-guided deep hyperthermia systems using an anthropomorphic phantom. Int J Hyperth. 2020;37:1103–1115.
- Lin W-L, Roemer RB, Moros EG, et al. Optimization of temperature distributions in scanned, focused ultrasound hyperthermia. Int J Hyperth. 1992;8:61–78.
- McGough RJ, Kessler ML, Ebbini ES, et al. Treatment planning for hyperthermia with ultrasound phased arrays. IEEE Trans Ultrason, Ferroelect, Freq Contr. 1996;43(6):1074–1084.
- Ishihara Y, Calderon A, Watanabe H, et al. A precise and fast temperature mapping using water proton chemical shift. Magn Reson Med. 1995;34:814–823.
- De Poorter J, De Wagter C, De Deene Y, et al. Noninvasive MRI thermometry with the proton resonance frequency (PRF) method: in vivo results in human muscle. Magn Reson Med. 1995;33:74–81.
- Salomir R, Vimeux FC, De Zwart JA, et al. Hyperthermia by MR-guided focused ultrasound: accurate temperature control based on fast MRI and a physical model of local energy deposition and heat conduction. Magn Reson Med. 2000;43(3):342–347.
- Mougenot C, Salomir R, Palussie J, et al. Automatic spatial and temporal temperature control for MR-guided focused ultrasound using fast 3D MR thermometry and multispiral trajectory of the focal point. Magn Reson Med. 2004;52:1005–1015.
- Mougenot C, Quesson B, De Senneville BD, et al. Three-dimensional spatial and temporal temperature control with MR thermometry-guided focused ultrasound (MRgHIFU). Magn Reson Med. 2009;61:603–614.
- Enholm JK, Köhler M, Quesson B, et al. Improved volumetric MR-HIFU ablation by robust binary feedback control. IEEE Trans Biomed Eng. 2010;57:103–113.
- De Smet M, Heijman E, Langereis S, et al. Magnetic resonance imaging of high intensity focused ultrasound mediated drug delivery from temperature-sensitive liposomes: an in vivo proof-of-concept study. J Control Release. 2011;150(1):102–110.
- Partanen A, Yarmolenko PS, Viitala A, et al. Mild hyperthermia with magnetic resonance-guided high-intensity focused ultrasound for applications in drug delivery. Int J Hyperth. 2012;28:320–336.
- Staruch RM, Hynynen K, Chopra R. Hyperthermia-mediated doxorubicin release from thermosensitive liposomes using MR-HIFU: therapeutic effect in rabbit Vx2 tumours. Int J Hyperth. 2015;31:118–133.
- Hijnen N, Kneepkens E, De Smet M, et al. Thermal combination therapies for local drug delivery by magnetic resonance-guided high–intensity focused ultrasound. Proc Natl Acad Sci. 2017;114:E4802–E4811.
- Ter Haar G, Coussios C. High intensity focused ultrasound: physical principles and devices. Int J Hyperth. 2007;23:89–104.
- Cain CA, Umemura S-I. Concentric-ring phased-array ultrasound. IEEE Trans Microwave Theory Techn. 1986;34(5):542–551.
- Ebbini ES, Cain CA. A spherical-section ultrasound phased array applicator for deep localized hyperthermia. IEEE Trans Biomed Eng. 1991;38:634–643.
- Tillander M, Hokland S, Koskela J, et al. High intensity focused ultrasound induced in vivo large volume hyperthermia under 3D MRI temperature control. Med Phys. 2016;43:1539–1549.
- Heijman E, Yeo SY, Sebeke L, et al. Volumetric hyperthermia of soft tissue sarcoma using MR-guided high intensity focussed ultrasound. Paper presented at the 6th International Symposium on Focused Ultrasound; 2018 October 21–25; Reston, VA.
- Chu W, Huang Y, Pichardo S, et al. A phase I study of MR-HIFU hyperthermia (HT) with radiation (RT) and chemotherapy (CT) for recurrent rectal cancer. J Glob Oncol. 2019;5:78.
- Lagendijk JJW, Crezee J, Hand JW. Dose uniformity in scanned focused ultrasound hyperthermia. Int J Hyperth. 1994;10:775–784.
- Mayne DQ. Model predictive control: recent developments and future promise. Automatica. 2014;50(12):2967–2986.
- Lee JH. Model predictive control: review of the three decades of development. Int J Control Autom Syst. 2011;9(3):415–424.
- Arora D, Skliar M, Roemer RB. Model-predictive control of hyperthermia treatments. IEEE Trans Biomed Eng. 2002;49:629–639.
- Blankespoor A, Payne A, Todd N, et al. Model predictive control of HIFU treatments in 3D for treatment time reduction. AIP Conf Proc. 2009;1113:215.
- De Bever J, Todd N, Payne A, et al. Adaptive model-predictive controller for magnetic resonance guided focused ultrasound therapy. Int J Hyperth. 2014;30(7):456–470.
- Sebeke LC, Deenen DA, Maljaars E, et al. Model predictive control for MR-HIFU-mediated uniform hyperthermia. Int J Hyperth. 2019;36:1040–1050.
- Zaporzan B, Waspe AC, Looi T, et al. MatMRI and MatHIFU: software toolboxes for real-time monitoring and control of MR-guided HIFU. J Ther Ultrasound. 2013;1:7.
- Hijnen NM, Elevelt A, Pikkemaat J, et al. The magnetic susceptibility effect of gadolinium-based contrast agents on PRFS-based MR thermometry during thermal interventions. J Ther Ultrasound. 2013;1:8.
- Pennes HH. Analysis of tissue and arterial blood temperatures in the resting human forearm. J Appl Physiol. 1948;1:93–122.
- Lehmann J, Johnson E. Some factors influencing the temperature distribution in thighs exposed to ultrasound. Arch Phys Med Rehabil. 1958;39:347–356.
- Pedregosa F, Varoquaux G, Gramfort A, et al. Scikit-learn: machine learning in python. J Mach Learn Res. 2011;12:2825–2830.
- Chu W, Staruch RM, Pichardo S, et al. Magnetic resonance-guided high-intensity focused ultrasound hyperthermia for recurrent rectal cancer: MR thermometry evaluation and preclinical validation. Int J Radiat Oncol Biol Phys. 2016;95:1259–1267.
- Henriques FCJ, Moritz AR. Studies of thermal injury: I. The conduction of heat to and through skin and the temperatures attained therein. A theoretical and an experimental investigation. Am J Pathol. 1947;23:530–549.
- Lin Z, Li M, Wang Y, et al. Physiological parameter values for physiologically based pharmacokinetic models in food‐producing animals. Part I: cattle and swine. J Vet Pharmacol Ther. 2020;43:385–420.
- Dillon CR, Rieke V, Ghanouni P, et al. Thermal diffusivity and perfusion constants from in vivo MR-guided focussed ultrasound treatments: a feasibility study. Int J Hyperth. 2018;34:352–362.
- Dragonu I, De Oliveira PL, Laurent C, et al. Non-invasive determination of tissue thermal parameters from high intensity focused ultrasound treatment monitored by volumetric MRI thermometry. NMR Biomed. 2009;22:843–851.
- Bicher HI, Hetzel FW, Sandhu TS, et al. Effects of hyperthermia on normal and tumor microenvironment. Radiology. 1980;137:523–530.
- Deenen DA, Maljaars E, Sebeke L, et al. Offset-free model predictive control for enhancing MR-HIFU hyperthermia in cancer treatment. IFAC-PapersOnLine. 2018;51(20):191–196.
- Vaupel PW, Kelleher DK. Pathophysiological and vascular characteristics of tumours and their importance for hyperthermia: heterogeneity is the key issue. Int J Hyperth. 2010;26:211–223.
- Wyler F, Käslin M, Hof R, et al. Das Göttinger Miniaturschwein als Versuchstier - 5. Mitteilung: Das Herzminutenvolumen, seine prozentuale Verteilung auf den Organismus und die effektive Organdurchblutung. Res Exp Med. 1979;175(1):31–36.
- Tranquilli WJ, Parks CM, Thurmon JC, et al. Organ blood flow and distribution of cardiac output in nonanesthetized swine. Am J Vet Res. 1982;43:895–897.
- Lokshina AM, Song CW, Rhee JG, et al. Effect of fractionated heating on the blood flow in normal tissues. Int J Hyperth. 1985;1:117–129.
- Kotte A, Van Leeuwen G, De Bree J, et al. A description of discrete vessel segments in thermal modelling of tissues. Phys Med Biol. 1996;41:865–884.
- Kotte ANTJ, Van Leeuwen GMJ, Lagendijk JJW. Modelling the thermal impact of a discrete vessel tree. Phys Med Biol. 1999;44:57–74.
- Van Den Berg CAT, Van De Kamer JB, De Leeuw AAC, et al. Towards patient specific thermal modelling of the prostate. Phys Med Biol. 2006;51(4):809–825.
- Craciunescu OI, Raaymakers BW, Kotte ANTJ, et al. Discretizing large traceable vessels and using DE-MRI perfusion maps yields numerical temperature contours that match the MR noninvasive measurements. Med Phys. 2001;28:2289–2296.
- Aubry J-F, Pauly K, Moonen C, et al. The road to clinical use of high-intensity focused ultrasound for liver cancer: technical and clinical consensus. J Ther Ultrasound. 2013;1:13.
- Pichardo S, Köhler M, Lee J, et al. In vivo optimisation study for multi-baseline MR-based thermometry in the context of hyperthermia using MR-guided high intensity focused ultrasound for head and neck applications. Int J Hyperth. 2014;30:579–592.
- Bing C, Cheng B, Staruch RM, et al. Breath-hold MR-HIFU hyperthermia: phantom and in vivo feasibility. Int J Hyperth. 2019;36:1084–1097.
- Santos MA, Wu SK, Regenold M, et al. Novel fractionated ultrashort thermal exposures with MRI-guided focused ultrasound for treating tumors with thermosensitive drugs. Sci Adv. 2020;6(36):eaba5684.
- Lokerse WJM, Kneepkens ECM, ten Hagen TLM, et al. In depth study on thermosensitive liposomes: optimizing formulations for tumor specific therapy and in vitro to in vivo relations. Biomaterials. 2016;82:138–150.
- Song CW, Kang MS, Rhee JG, et al. Effect of hyperthermia on vascular function in normal and neoplastic tissues. Ann N Y Acad Sci. 1980;335:35–47.
- Vaupel P. Pathophysiological mechanisms of hyperthermia in cancer therapy. In: Gautherie M, editor. Biological basis of oncologic thermotherapy. Berlin (Germany): Springer; 1990. p. 73–134.
- Song CW. Effect of local hyperthermia on blood flow and microenvironment: a review. Cancer Res. 1984;44:4721s–4730s.
- Rossmanna C, Haemmerich D. Review of temperature dependence of thermal properties, dielectric properties, and perfusion of biological tissues at hyperthermic and ablation temperatures. Crit Rev Biomed Eng. 2014;42:467–492.
- Duck FA. Physical properties of tissue. A comprehensive reference book. Amsterdam (The Netherlands): Elsevier; 1990.