
 ?Mathematical formulae have been encoded as MathML and are displayed in this HTML version using MathJax in order to improve their display. Uncheck the box to turn MathJax off. This feature requires Javascript. Click on a formula to zoom.
Abstract
Purpose
To develop and validate a three-dimensional (3-D) computer model based on accurate geometry of an irrigated cardiac radiofrequency (RF) ablation catheter with microwave radiometry capability, and to test catheter performance.
Methods
A computer model was developed based on CAD geometry of a RF cardiac ablation catheter prototype to simulate electromagnetic heating, heat transfer, and computational fluid dynamics (blood flow, open irrigation, and natural convection). Parametric studies were performed; blood flow velocity (0–25 cm/s) and irrigation flow (0–40 ml/min) varied, both with perpendicular (PE) and parallel (PA) catheter orientations relative to tissue. Tissue Agar phantom studies were performed under similar conditions, and temperature maps were recorded via infrared camera. Computer model simulations were performed with constant voltage and with voltage adjusted to achieve maximum tissue temperatures of 95–105 °C.
Results
Model predicted thermal lesion width at 5 W power was 5.8–6.4 mm (PE)/6.5–6.6 mm (PA), and lesion depth was 4.0–4.3 mm (PE)/4.0–4.1 mm (PA). Compared to phantom studies, the mean errors of the computer model were as follows: 6.2 °C(PE)/4.3 °C (PA) for maximum gel temperature, 0.7 mm (10.9%) (PE)/0.1 mm (0.8%) (PA) for lesion width, and 0.3 mm (7.7%)(PE)/0.7 mm (19.1%) (PA) for lesion depth. For temperature-controlled ablation, model predicted thermal lesion width was 7–9.2 mm (PE)/8.6–9.2 mm (PA), and lesion depth was 4.3–5.5 mm (PE)/3.4–5.4 mm (PA).
Conclusions
Computer models were able to reproduce device performance and to enable device evaluation under varying conditions. Temperature controlled ablation of irrigated catheters enables optimal tissue temperatures independent of patient-specific conditions such as blood flow.
Introduction
Cardiac radiofrequency (RF) catheter ablation is a clinically accepted treatment modality for a wide range of ventricular and supraventricular arrhythmia, including atrial fibrillation [Citation1]. During RF ablation, cardiac tissue responsible for arrhythmia is destroyed by localized heating induced by RF electric current via an intracardiac catheter [Citation2]. In recent years, irrigated catheters have been increasingly used because they allow the creation of larger thermal lesions than conventional non-irrigated catheters [Citation3,Citation4]. In irrigated catheters, the catheter tip is cooled either through open irrigation (i.e., saline flows from RF electrodes into blood through irrigation outlets in the tip) or closed irrigation (i.e., fluid stays internal of the catheter). Such irrigated catheter solutions are especially beneficial for ablation of cardiac arrhythmias such as atrial fibrillation or ventricular tachycardias [Citation5,Citation6], because irrigation enables the creation of deeper thermal lesions.
Although several irrigated catheters are available commercially (e.g., ThermoCool, Blazer, Chili II) [Citation4,Citation7,Citation8], none of them provide readings of tissue temperature – a feature common in non-irrigated catheters. Such tissue temperature feedback is in general not possible with existing irrigated catheters because the irrigation fluid shields temperature sensors internal to catheter electrodes. This shielding effect prevents the accurate measurement of tissue temperature. Most irrigated catheters, therefore, apply constant power [Citation4,Citation8–12] rather than adjusting power based on temperature feedback. Only one very recent, novel multi-thermocouple catheter where 6 thermocouples were embedded in the electrode surface enabled power modulation based on tissue temperature when combined with the modulation of irrigation fluid [Citation13]. Applying constant power has the disadvantage that patient-specific conditions such as blood flow are not considered, and, therefore, thermal lesions may be suboptimal. Furthermore, due to the lack of tissue temperature monitoring in irrigated catheters, detrimental effects, such as steam pops may occur. Steam pops result from excessive tissue heating and are more difficult to control with irrigated than conventional ablation catheters [Citation14].
A previous study of an irrigated RF catheter with an integrated helical microwave antenna showed its capability of measuring tissue temperatures in vivo [Citation15]. The helical antenna, carried by the irrigated electrode was connected to an integrated radiometer. This antenna-radiometer subsystem enabled the measurement of tissue temperatures even during active irrigation. Accordingly, when using this catheter, it was possible to modulate either the applied RF power or the irrigation flow rate, to maintain a target tissue temperature. Although not yet commercially available, such a catheter was shown to allow ‘tailoring’ of ablation parameters for each patient’s circumstances and correcting for local blood flow variations. Microwave radiometry, therefore, enables the control of applied RF power in irrigated catheters based on tissue temperature.
Here, we present results for a slightly modified version of this irrigated catheter with integrated helical antenna described earlier [Citation15]. The modifications, while important, did not involve the antenna and radiometer designs. Instead, these modifications were of mechanical nature and intended to improve the consistency of irrigation fluid flow, catheter steerability, torque, and reliability. Therefore, the catheter we analyzed in this paper had the same radiometry capabilities and performance as the one described earlier [Citation15]. The goal of the current study was to develop a computer model of this irrigated catheter and validate the computer model by experimental studies in tissue phantoms.
Computational models employing the finite element method (FEM) have been commonly used to characterize cardiac ablation catheters, both to examine the effect of patient specific parameters such as blood flow, and to optimize catheter designs for treatment efficacy [Citation10–12,Citation16–23]. Several prior studies of computer models for irrigated catheters are available, some of which employ 2-D axi-symmetric geometry [Citation10,Citation20]. In five recent three-dimensional (3-D) models of irrigated catheters, irrigation was modeled either by convective heat-transfer coefficients [Citation10,Citation12], as distributed saline flow originating at the catheter tip surface [Citation9,Citation24] or from irrigation holes [Citation11]. All prior 3-D models assumed a simplified catheter geometry. For example, the catheter body and the electrode were simplified solid components without internal structures [Citation9,Citation10,Citation12,Citation17,Citation20,Citation24,Citation25]. In another case, the catheter had three highly simplified internal components [Citation11]. In addition, experimental validation is absent in most prior computer models [Citation9,Citation10,Citation12,Citation18–21,Citation23]. The lack of validation complicates understanding of the accuracy of model predictions. Studies that included validation were limited by comparing only the thermal lesion dimensions without validating the temperature profile [Citation11,Citation24]. Other models compared the predicted temperature to sensor measurements, but only at a limited number of locations [Citation16,Citation17,Citation25].
Herein we present a computational 3-D model of an open irrigated cardiac ablation catheter prototype that had microwave radiometry capability. The model reproduced the catheter geometry based on a CAD model of the actual device. Furthermore, our analyses accounted for cardiac blood flow and for irrigation flow originating from individual irrigation outlets at the catheter tip. Our models were validated based on experimental data from tissue phantoms. This validation was achieved by measuring temperature maps based on infrared imaging.
Methods
Cardiac RF ablation catheter design
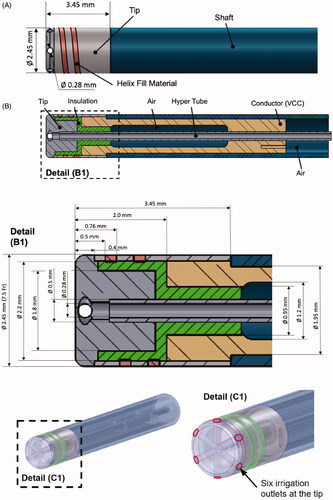
The irrigated catheter prototype is shown in external and cross section views in . The geometry was created using CAD software (Pro/ENGINEER) in close collaboration with catheter design engineers. To cool the electrode tip and surrounding tissue during the ablation procedure, irrigation fluid is pumped through the catheter via a hyper-tube. At the tip, the irrigation fluid exits into surrounding blood via six outlets that are evenly distributed along the circumference of the tip. As shown, this catheter is a prototype of a novel design that includes a helical antenna for monitoring tissue temperature by microwave radiometry, to provide temperature feedback and thus avoid tissue overheating [Citation15]. With microwave radiometry, the helical antenna senses temperature dependent emissions in the microwave range from heated tissue distal to the electrode, thus deriving tissue temperature. Although the antenna helix is included in the geometry because it may affect tissue heating, microwave radiometry itself is not simulated in the computer model.
Figure 1. Cardiac RF ablation catheter geometry. (A) External side view; (B) cross section, (B1) with tip section magnified; and (C) 3-D model of catheter as used in the simulation. Irrigation fluid (saline) flows through the hyper tube toward the catheter tip and exits through six irrigation outlets at the tip. (C1) Magnified tip with irrigation outlets indicated. The helix represents a microwave antenna for detecting tissue temperature, though this microwave radiometry is not included in the computer simulation. VCC indicates the voltage applied to the active electrode. Catheter materials are as listed in .
Phantom experiments
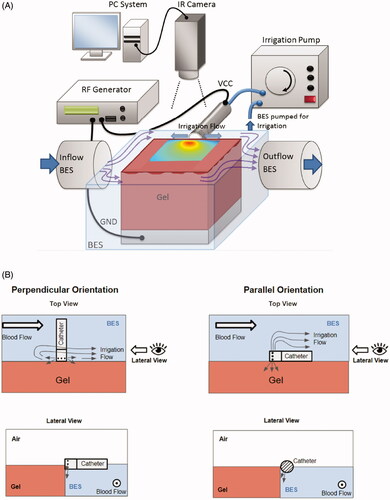
To validate the computer models and to quantify the effectiveness of irrigated catheters, we developed an experimental setup using Agar gel phantoms (∼5 × 5 × 10 cm blocks) that emulate cardiac tissue. We placed the phantoms in a container filled with 0.3% saline (blood equivalent solution (BES)) to emulate blood (), similar to a prior study [Citation26]. A gel phantom was employed rather than tissue because the phantom had reproducible and known properties as well as flat surfaces; thus, the experimental geometry was consistent with the computer simulation.
Figure 2. (A) Schematic drawing of experimental setup with perpendicular catheter orientation, (B) schematic illustration of the perpendicular and parallel catheter orientations used in the experiments, relative to gel phantom and blood-equivalent solution (BES). The tissue phantom gel sample was completely submerged in the BES. The top surface of the gel phantom was kept dry to facilitate temperature recording via infrared camera. An irrigation pump was used to simulated blood flow across the catheter and the tissue phantom.
In , we show the design of the irrigated prototype catheter that was employed in the experiments. The setup was kept at body temperature (37 °C) by circulating the saline through a heated water bath. The temporal tissue temperature profile was recorded using an infrared camera (Mikron MikroSpec RT7500) at a rate of 1/s, with 320 × 240 resolution, similar to prior studies [Citation4,Citation27]. We assumed an emissivity of 0.85 for the Agar gel [Citation28]. A metal plate placed below the gel phantom served as the ground electrode. The saline level was within ∼1 mm of the surface of the gel phantom. Because infrared imaging can only measure surface temperatures, the central region of the thermal lesion where we measured temperature by infrared imaging needed to be exposed. Therefore, the setup has one difference from typical experimental setups used to emulate cardiac ablation [Citation8,Citation11]: the ablation catheter was situated at the edge of the phantom to enable imaging of the heated phantom surface. The setup is visualized in , with showing the catheter position relative to the phantom for perpendicular and parallel catheter orientations.
We performed experiments where gel phantoms were heated for 60 s at a power level of 5 W (RF generator EPT-1000 XP, Boston Scientific, Boston, TX). Impedance was measured and indicated by the RF generator during ablation. The power level was selected to avoid temperatures above ∼80 °C, which would result in melting of the gel phantom. Experiments with both parallel and perpendicular catheter orientations relative to Agar phantom surface were performed with irrigation rates of 20 ml/min. When the catheter was placed in contact with the phantom surface (both orientations), it was only partially submerged in saline, and the three catheter irrigation outlets pointing upwards were closed off with glue because they were not in contact with the saline (BES), and irrigation fluid from these holes would have sprayed into the air.
Studies were conducted with a saline velocity of 10 cm/s (to simulate blood flow). Velocities above 10 cm/s were not feasible in our setup because waves resulting in the saline would flood across the phantom surface, preventing infrared imaging. To quantify the impact of irrigation for the perpendicular catheter orientation, studies without irrigation were performed as well, at a saline velocity of 10 cm/s. Each experiment was repeated five times, and we report average and standard deviation of these five trials. Comparisons between the model and the experiment occurred based on the maximum tissue temperature and on the size of the 55 °C isotherm as an approximation of thermal lesion size. Although tissue damage depends on both temperature and duration of heat exposure, no adequate data are available to establish the dependence of cardiac tissue damage on both temperature and time [Citation29]. Therefore, most prior computer modeling studies estimated thermal lesion size based on isotherms. Most often, the 50 °C-isotherm was used [Citation12,Citation18–20,Citation22], which is based primarily on prior in vitro studies where irreversible loss of excitability occurred when cardiac cells were exposed to temperatures exceeding 50 °C [Citation7]. Unlike those in vitro results, a more recent study in isolated perfused hearts suggests that around 60 °C are required to generate thermal cardiac lesions [Citation30]. In the absence of conclusive data, in the current study, we employed 55 °C as a lethal isotherm. However, because we performed experimental comparison studies in gel phantoms and we only measured temperature rather than thermal lesion dimensions (as no thermal lesions are visible in gel), predicted thermal lesion size is of secondary relevance in the current study.
Because the catheter tip was flat rather than rounded (as in most other cardiac ablation catheters), we placed the catheter in contact with the tissue phantom without penetrating the phantom. Catheter insertion would have been problematic in the gel phantom because the gel is more fragile than tissue and easily fractures when applying the catheter with pressure to achieve insertion.
To compare the experiment and computer model, we calculated the mean error based on the difference between the statistical means in the experiment and the computer model. Individual means were calculated for all results (i.e., considering all blood flow and irrigation conditions) and for both catheter orientations (i.e., perpendicular or parallel). The errors were also calculated as percentages, where the absolute error was divided by the experimental mean.
We define three levels of agreement between model and experiment: (Equation1(1)
(1) ) high level of agreement if the error is within 1 standard deviation (assuming a normal distribution, 68.3% of experimental results are within 1 standard deviation of the mean), medium level of agreement if the difference is 1–2 standard deviations (27.2% of experimental results are within 1–2 standard deviations of the mean), and low level of agreement if the difference is >2 standard deviations (4.6% of experimental results are >2 standard deviations from the mean).
Computational finite element method model
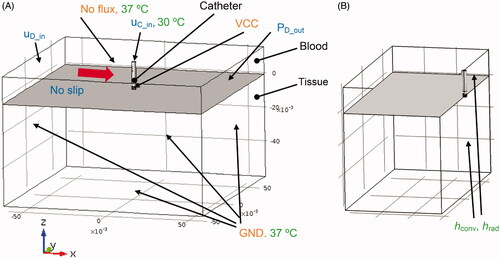
A 3-D finite element model (FEM) was developed to simulate the fully coupled multi-physics problem that involves electromagnetics, heat-transfer, and computational fluid dynamics. The CAD model geometry of the catheter () was imported into the FEM modeling software (COMSOL 4.3b) to generate a 3-D model (). Perpendicular and parallel catheter orientations relative to cardiac tissue surface were modeled because both are clinically relevant. The model geometry consists of three domains: the catheter, the blood, and the tissue domain (). For direct comparison to experimental results, a reduced model geometry that corresponds to the experimental setup was used (). Flow was simulated in the blood domain, as well as the internal catheter irrigation channels. For flow simulation, three boundary-element layers were employed at the liquid–solid interfaces to represent the fluid boundary layer.
Figure 3. (A) RF ablation catheter (perpendicular orientation) with modeling domains. Dimensions are indicated in meters. Total model dimensions were 120 × 120 × 76 cm. Flow boundary conditions (uD_in, uC_in, PD_out) are indicated in blue, and flow direction for simulation of blood flow is indicated by a red arrow. Electrical boundary conditions are indicated in orange, and thermal boundary conditions are indicated in green. The reference coordinate system with x/y/z-axes is indicated below the figure. (B) Configuration equivalent to the experimental setup, where only half of the modeling domain is represented due to the requirement of exposing the heated phantom surface (=right surface of tissue domain) for infrared imaging. Convective and radiative heat losses (hconv, hrad) were included in the model simulating the experimental setup at the right-side surfaces as indicated.
The computer model of the perpendicular catheter configuration had 286k tetrahedral elements, and the model with the parallel catheter orientation had 581k tetrahedral elements. The model with reduced geometry () had 299k elements for the perpendicular orientation, and 140k elements for the parallel orientation. Minimum element size was 0.04 mm. A convergence study was performed wherein the element number was increased by a factor of 2 to ensure adequate element size. In an additional convergence test, the domain size was increased by a factor of two to ensure adequate domain size as well.
Model equations
Electromagnetics model
The electric field was solved by considering the electrostatic conditions (Laplace equation), which is adequate because the electromagnetic wavelength of RF waves in tissue is much larger than the model domain [Citation22]:
(1)
(1)
where V (V) is the voltage and σ (S/m) is the electrical conductivity. The voltage distribution was then used to calculate the distributed heat source QRF (Joule losses) according to
(2)
(2)
where J (A/m2) is the current density, and E (V/m) is the electric field intensity. The distributed heat source term was then applied in the heat transfer model described below.
Electric boundary conditions
A zero-flux boundary condition was applied to the top surface of the blood domain, and the remaining boundaries were assigned a ground potential (GND) boundary condition (V = 0) (see ). VCC indicates the voltage applied to the active electrode. A constant voltage boundary condition was assigned to the electrically conductive ablation electrode (Velectrode=VCC) (see ).
Impedance Z (Ohms) as measured between the electrode and the model boundaries assigned ground potential (GND) was calculated from the voltage applied to the catheter VCC (V) and the total dissipated power P (W) as Z=VCC2/P.
Fluid dynamics model
The computational fluid dynamics problem to simulate flow of blood and saline was solved using the Navier–Stokes equations for incompressible fluids, similar to prior studies [Citation9]:
(3)
(3)
(4)
(4)
where μ (Pa·s) denotes the dynamic viscosity, u (m/s) is the velocity vector, ρ (kg/m3) refers to the density, p (Pa) is the pressure, and F (N/m3) is the gravitational force due to heat-induced density change. This gravitational force is responsible for free convection caused by changes in fluid density in response to heating and was calculated as follows:
(5)
(5)
where g = 9.81 m2/s is the gravitational acceleration constant. This force was applied in the y-direction to correspond to the experimental setup. A reference coordinate system indicating the axial directions is shown in .
Newtonian behavior is assumed for blood, which is adequate for shear rates >100 s−1 [Citation31]. Two prior studies that simulated blood flow inside the heart during cardiac ablation also assumed Newtonian blood behavior [Citation9,Citation11].
In addition, an initial pressure condition was assigned for the blood domain:
(6)
(6)
where ymax is the flow domain size in the y direction.
Fluid dynamics boundary conditions
To simulate internal catheter irrigation, a flow velocity boundary condition (uc_in) was defined at the upper boundary surface of the hyper-tube with a flow velocity of 4.6 m/s (corresponding to 20 ml/min flow rate) to reproduce the experimental setup (). In the second set of computer model studies (), velocities of 0, 3.45, and 6.89 m/s (corresponding to irrigation flow rates of 0, 15, and 30 ml/min) were applied. Irrigation rates were chosen in the range currently in clinical use [Citation3,Citation4].
Additionally, a blood velocity boundary condition (uD_in) of 10 cm/s for the blood domain inlet was applied in the model reproducing the experimental conditions (), and 0, 0.5, and 25 cm/s were assigned in the second set of computer model studies (). The blood flow velocities were selected to simulate the range of velocities typically observed in human hearts [Citation19]. Although the flow rate varies during the cardiac cycle, prior studies in vessels suggest that, due to the long heating duration relative to cardiac cycle length, constant flow velocity can be assumed for the simulation of tissue heat transfer during thermal therapies [Citation32,Citation33].
The blood flow direction was arbitrarily selected, because in actual patient conditions, flow direction is variable. A pressure outlet condition (PD_out) was applied to the face opposite the inlet in the blood domain. The magnitude of the dynamic pressure outlet was calculated as where ρ is the density of blood, and u is the blood inlet velocity. No-slip boundary conditions were assigned to the tissue–fluid and the electrode–fluid interfaces. At the outer model surfaces of the blood domain, symmetry flow boundary conditions were considered (i.e., no flow perpendicular to surface).
Heat transfer model
The heat transfer problem was solved in the blood, tissue, and catheter domains; heat transfer by convection and conduction were considered in the fluid domain, and heat transfer by conduction alone in the solid domains. The temperature field was assumed to be continuous between the fluid and solid domains. Joule heating was active in all domains. The following heat transfer equation (22) was solved (with u = 0 in solid domains):
(7)
(7)
where QRF on the right-hand side represents the term for the heat source due to RF heating (EquationEquation 2
(2)
(2) ). T (°C) denotes the tissue temperature, C (J/(kg °C)) is the tissue heat capacity, k (W/(m °C)) indicates the tissue thermal conductivity, and ρ (kg/m3) is the tissue mass density.
Hence, the problem involves fully coupled fluid, thermal, and electric fields. In the solid domains of the catheter and tissue, EquationEquation (7)(7)
(7) reduces to a conductive heat transfer equation. Metabolic heat generation and the heat loss due to cardiac tissue blood perfusion were not considered because they are negligible compared to joule heating and thermal conduction for cardiac ablation models [Citation18,Citation22,Citation23].
Thermal boundary conditions
Constant temperature boundary conditions (body temperature, i.e., 37 °C) were applied on the model boundaries except for the top face of the hyper-tube (uC_in), which was set to 30 °C to simulate cooled irrigation fluid pumped into the hyper-tube of the catheter (see ). During clinical use, the ablation catheter is introduced into the heart via vascular access. Since extended catheter regions are in contact with blood, the room-temperature saline used for irrigation heats up until it reaches the proximity of the catheter tip. In preliminary experimental studies where the whole catheter was immersed in 37 °C saline, we determined that the irrigation fluid has ∼30 °C once it reaches the catheter tip region.
For the computer model that represents the experimental condition where only half of the catheter was immersed in blood-equivalent solution (BES) (), we considered convective and radiative heat losses at the surfaces of the gel phantom and the BES that were exposed to air [Citation34]:
(8)
(8)
(9)
(9)
where qconv and qrad are convective and radiative heat fluxes applied to the surface boundaries, respectively; Tair is the temperature of ambient air (Tair = 23 °C); h is the heat transfer coefficient corresponding to free convection of air over a horizontal plate (h = 7.2 W/(m2 °C)) [Citation35]; σ equals the Stefan–Boltzmann constant (σ = 5.7 × 10⁻⁸ W/m2 °C4); and ε equals the emissivity of Agar gel (ε = 0.85) [Citation36].
Numerical solver
The electric field resulting from the RF electric current flow in the tissue, tissue heat transfer, and blood flow together with the mass, momentum, and energy equations were solved using the multifrontal massively parallel sparse direct solver (MUMPS), thus, employing a segregated solution approach [Citation37].
Simulation scenarios
Because the gel phantom had material properties that differed from tissue properties (see ), for direct validation of experiments, we first performed computer simulations using gel properties and a reduced model geometry that represented the experiments (). We applied a constant voltage of VCC during the simulations. Since electrical conductivity is temperature dependent, with constant voltage applied the dissipated power varied during the initial heat-up phase. Steady-state power levels were reached after ∼15 s, i.e., power did not change significantly after this initial heating period. In this first set of simulations, the magnitude of VCC was set by trial-and-error such that this steady-state power level during the simulation was at 5 W, for direct comparison to the experiments where the same power was applied. In a second set of simulations (), the applied voltage was adjusted so that maximum tissue temperatures were in the range of 95–105 °C (see and ), according to ideal target temperatures obtained during clinical ablation procedures [Citation18,Citation23]. The motivation for these simulations was as follows: unlike conventional irrigated RF catheters, this catheter enables monitoring of deep tissue temperatures by microwave radiometry, which will allow adjusting power to achieve optimal tissue temperature levels. During these simulations, power levels between 10 and 20 W were reached depending on model parameters (blood flow, orientation, irrigation rate). In all cases, power was applied for a total of 60 s.
Table 1. Material properties at 37 °C. Electrical conductivity is considered at a frequency of 500 kHz.
Material properties
The material properties were taken from the literature [Citation23,Citation38,Citation39] and are listed in . For cardiac tissue, temperature dependency of thermal properties was assumed [Citation38]. For electrical tissue conductivity, a temperature coefficient of 1.3% (same as kidney) was assumed [Citation40] as no temperature dependence data for myocardium were available. An Agar-based gel phantom (5% Agar, 0.25% NaCl) was used in the experimental validation. The agar phantom had the same thermal properties as water [Citation41]. Temperature dependence of electric conductivity of gel phantom, blood, and blood-equivalent solution (BES) were calculated based on data for NaCl solutions [Citation42]. Temperature dependence of mass density of blood and BES were assumed as occurred with water [Citation41]. We assumed a constant blood viscosity of μ = 0.003 Pa·s [Citation43].
Results
Experimental model validation
In the experiments, the average initial impedance was 157 Ohms (range 126–186 Ohms) for the perpendicular orientation, and 136 Ohms (range 126–151 Ohms) for the parallel orientation. In comparison, values in the computer model were 167 Ohms for the perpendicular orientation and 173 Ohms for the parallel orientation. The applied power in the experiments was 5 W, and the irrigation rate was 20 ml/min.
Perpendicular catheter orientation
shows a comparison of cross-sectional temperature maps at the end of the 60 s ablation between experiment and model for the perpendicular catheter orientation. A subjective visual inspection suggests good agreement between model and experiment for the two cases. The difference in maximum temperature between model and experiment was between 3.2 and 8.4 °C. The differences in lesion size as estimated by the 55 °C isotherm between model and experiment was 0.2–1.1 mm (lesion width) and 0–0.8 mm (depth) ().
Figure 4. Temperature profiles of representative perpendicular catheter orientation of experiments (top) and computer simulations (bottom). Results are shown at the end of the 60 s ablation at constant power of 5 W, for an irrigation flow rate of 20 ml/min and blood velocity of either 0 or 10 cm/s. Direction of blood flow is indicated in the upper right image. 55 °C isotherm is marked as estimate of thermal lesion size, with lesion width and depth indicated in the upper left figure.
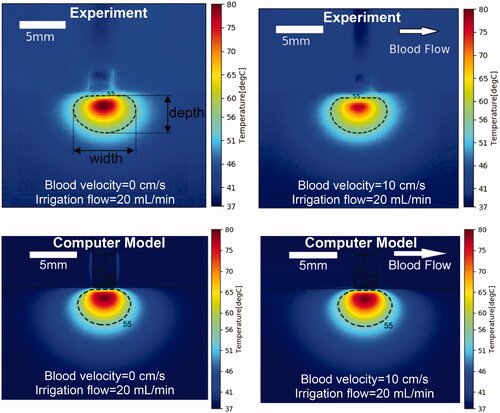
Table 2. Comparison of simulation and experiment (perpendicular catheter orientation).
Parallel catheter orientation
shows a comparison of cross-sectional temperature maps at the end of the 60 s ablation between experiment and model for the parallel catheter orientation. A subjective visual inspection suggests moderate agreement between the model and the experiment. The difference in maximum temperature between model and experiment was 3.6–4.9 °C. The differences in lesion size as estimated by the 55 °C isotherm between model and experiment was 0–0.1 mm (lesion width), and 0.4–0.9 mm (lesion depth) (). The differences in shape of the lesion are likely due to non-uniform contact between catheter and phantom in the experiment as suggested by the angled catheter outline visible in the upper figures.
Figure 5. Temperature profiles of representative parallel catheter orientation of experiments (top) and computer simulations (bottom). Results are shown at the end of the 60 s ablation at constant power of 5 W, for an irrigation flow rate of 20 ml/min and blood velocity of either 0 or 10 cm/s. Direction of blood flow is indicated in the upper right image. The 55 °C isotherm is an estimate of thermal lesion size.
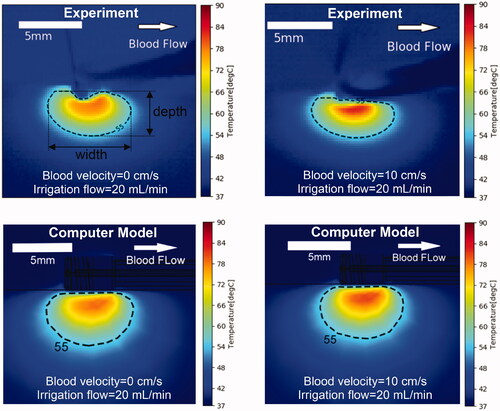
Table 3. Comparison of simulation and experiment (parallel catheter orientation).
Computer model results for cardiac tissue
The results below are based on models that employed higher power to obtain clinically relevant tissue temperatures; thus, tissue properties were used to replace the gel phantom properties used in the validation above. The goal was to adjust applied voltage to achieve maximum tissue temperatures of 95–105 °C. Unlike conventional irrigated RF catheters, this catheter enables monitoring of deep tissue temperatures by microwave radiometry, which allows adjusting the power to achieve optimal tissue temperature levels as in the computer simulations. Although we adjusted power levels to achieve temperatures in the desired range, we did not modulate power to keep tissue temperature at the maximum level. Therefore, the capabilities for measuring temperature were not used to their maximum potential, compared to true temperature control. In addition, the maximum irrigation flow rate was 30 ml/min in these simulations rather than 20 ml/min used earlier, which corresponds to the typical, clinical rate for irrigated catheters [Citation4]. Thus, the results below are intended to represent, more accurately, temperature and thermal lesions (approximated by the 55 °C isotherm), which typically would be obtained during clinical ablation procedures with this catheter when power is controlled based on temperature feedback via radiometry. Overall, the temperature profiles are similar to those presented in and , and, thus, are not reproduced here. We summarize the updated temperatures and thermal lesion dimensions for perpendicular and parallel catheter orientation in and . Overall, thermal lesions are significantly larger compared to the results from the phantom studies with constant power, in part due to the higher achieved temperatures.
Flow profiles
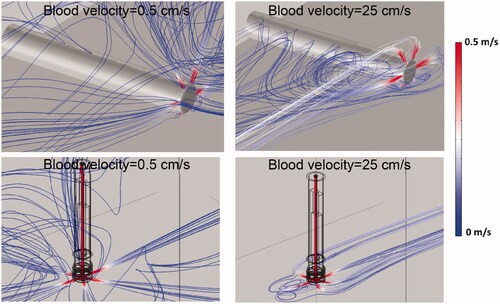
shows the flow velocity profile within the catheter hyper-tube as the cooling liquid enters the irrigation tubes and flows into the surrounding blood. The boundary layer where rapid change in velocity occurs at the inner hyper-tube wall is visible within the hyper-tube; adequate modeling of this boundary layer is important in order to accurately represent convective heat transfer in the model. shows streamline plots indicating flow velocity and flow direction of the irrigation fluid as it exits the catheter, for low and high blood velocity.
Figure 6. Flow velocity profile inside the catheter (irrigation flow rate = 30 ml/min).
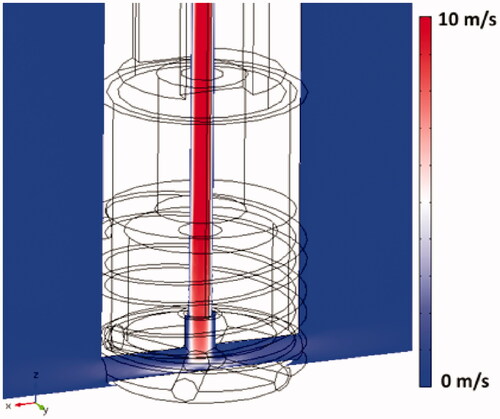
Figure 7. Streamline plots visualize irrigation. Flow velocity profile and the direction of saline exiting the catheter (30 ml/min irrigation flow rate). Results are shown for the perpendicular catheter orientation (upper images) and for the parallel orientation (lower images), for blood flow velocities of 0.5 cm/s and 25 cm/s as indicated, with blood flow direction from the upper right.
Surface temperature
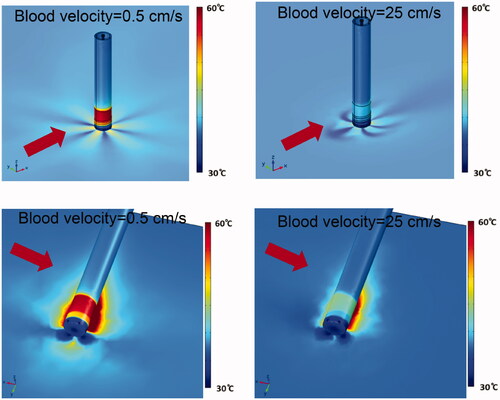
depicts the surface temperature of cardiac tissue and of the catheter, in perpendicular and parallel catheter orientation, and in low and high blood flow conditions. In low blood flow conditions, catheter temperatures exceeding 60 °C were observed at the proximal section of the catheter tip, which may result in undesirable coagulum formation. This suggests that this proximal catheter tip section is not adequately cooled by the irrigation fluid, and thus may benefit from redesign.
Figure 8. Catheter and tissue surface temperature (30 ml/min irrigation flow rate). Results are shown for perpendicular catheter orientation (upper images) and for parallel orientation (lower images), as well as for blood flow velocities of 0.5 cm/s and 25 cm/s as indicated. Direction of blood flow is indicated by red arrows.
and and summarize tissue temperature and thermal lesion dimensions estimated by the 55 °C isotherm under varying irrigation and blood flow. Power was adjusted in each ablation to achieve maximum tissue temperatures in the range of 95–105 °C. Notably, higher power levels are required in high blood flow conditions, which suggests that the optimal power level depends on blood flow, and that adjusting power based on temperature feedback is beneficial.
Figure 9. The 55 °C-isotherm width and depth under various conditions of blood flow and irrigation, for (A) perpendicular catheter orientation, and (B) parallel catheter orientation. The 55 °C-isotherm was used to approximate the thermal lesion boundary.
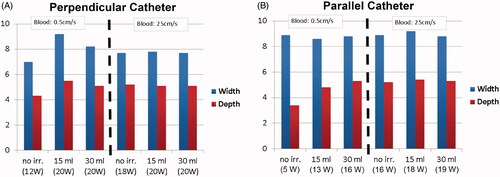
Table 4. Simulation results summary (perpendicular catheter orientation); the baseline impedance was 96 Ohms.
Table 5. Simulation results summary (parallel catheter orientation); the baseline impedance was 97 Ohms.
Discussion
Computational models are increasingly used for medical devices during the design process. Consequently, the US Food & Drug Administration (FDA) has published guidelines for reporting computational modeling studies in conjunction with medical device submissions [Citation44], and more recently the ASME published the technical standard ‘Assessing Credibility of Computational Modeling through Verification and Validation: Application to Medical Devices’ (ASME V&V 40) [Citation45]. Here, we present an example of computational modeling for the design of a novel cardiac radiofrequency (RF) ablation catheter, and validated the computer model by phantom studies.
In past studies, cardiac RF ablation computer models have been employed to quantify the effects of varying blood flow and catheter orientation, and to examine how changes in catheter design affect performance [Citation10,Citation12,Citation16–23]. Irrigated catheters are increasingly employed clinically [Citation3,Citation4,Citation15]. Typically, irrigated catheters utilize constant-power ablation because accurate tissue temperature measurements are not attainable due to the shielding of internal temperature sensors caused by the flow of irrigation fluids [Citation4,Citation8–12].
The catheter used in this study features a helical microwave antenna embedded in the catheter tip (). This antenna enables a microwave radiometer to measure deep tissue temperatures even in irrigated catheters, as demonstrated in a prior study with an earlier prototype of this catheter and identical microwave antenna [Citation15]. Tissue temperature estimates based on microwave radiometry enable temperature-controlled ablation. To our knowledge, there is only one recent irrigated catheter for which temperature-controlled ablation has been demonstrated [Citation13]. Consequently, applied power can be controlled to obtain desired tissue temperatures. In this study, we evaluated the performance of this catheter under conditions of varying irrigation and blood flow, including quantifying optimal power levels for each condition.
Computational modeling of irrigated catheters has occurred in previous studies. Some prior studies employed 2-D axi-symmetric geometry [Citation10,Citation20], while more recent studies presented 3-D models of irrigated catheters [Citation9–12,Citation24]. One of these recent 3-D models suggested the importance of including computational fluid dynamics to model irrigated catheters accurately [Citation9]. Here we present a computational model in which catheter geometry was accurately represented based on CAD files of the actual catheter (), and the model was validated by experimental studies with a prototype catheter of identical design. In addition, blood flow was explicitly simulated by a dedicated flow model [Citation9,Citation17], rather than by estimating convective cooling via the heat transfer coefficient as occurred in most prior models [Citation10,Citation12,Citation18,Citation21,Citation23]. The current model included internal irrigation tubing and irrigation holes through which the irrigation liquid exited into the surrounding blood ().
The differences in maximum tissue temperature were between 3.2 and 8.4 °C between the experiments and the computer model ( and ; and ). The differences in estimated thermal lesion dimensions between the model and the experiment were within the range of 0–1.1 mm (0–28.1%) for the perpendicular model (), and 0–0.9 mm (0–15.7%) for the parallel model (). Visual inspection of the temperature profile suggests good to moderate agreement ( and ).
The first set of computer simulations used properties of the employed gel phantom () to enable direct comparison with experimental results ( and ). In a second set of simulations, properties of cardiac tissue were employed () to obtain results more predictive of in vivo ablations in patients. The second set of simulations resulted in larger predicted thermal lesions ( and and ) compared to the simulations, based on gel phantoms ( and ). This is due, in part, to higher applied power in this second set of simulations, and because power was adjusted to obtain optimal tissue temperature in each case. Two catheter orientations were simulated, with the catheter in either the perpendicular or the parallel direction relative to cardiac tissue. Thermal lesion depth was comparable between the two catheter orientations, while thermal lesions were wider in the parallel orientation (; and ).
Because the irrigation fluid enters the blood inside the heart chamber, a complex interaction between blood and irrigation flow occurs, as demonstrated by the results of the flow model (). Accurate modeling of this complex flow condition is required to gain knowledge of the surface temperature profile of tissue and catheter because the flow causes considerable local variations of temperature for both tissue and catheter (). These variations do not occur if convective cooling is simulated via a distributed convective heat transfer coefficient or by distributed irrigation, as occurred in prior models. The advantage of irrigated catheters is that large thermal lesions can be created, even in conditions of low blood flow ( and and ), as shown also in prior studies [Citation8,Citation9]. In addition, active cooling of the catheter tip may prevent undesirable thrombus formation that can occur when catheter tip temperatures are above ∼60 °C. Notably, inadequate cooling of the proximal part of the catheter tip occurred in conditions of low blood velocity (), which may lead to thrombus formation. Thus, the results of the computer model suggest a revision of the catheter design, demonstrating the utility of integrating computer simulations in the medical device design process. The higher catheter temperature could not be confirmed experimentally, as infrared imaging has limited applicability to metallic surfaces due to their low emissivity. Notably, the observed surface temperature profile of catheter and tissue would not have been reproduced by a simplified catheter geometry (e.g., based on a solid electrode tip), a strategy used in prior studies.
The ideal power necessary to achieve optimal tissue temperatures in the range of 90–100 °C (i.e., maximal thermal lesion size without overheating tissue, which could lead to popping), depends on both blood flow and irrigation rate, as shown by the varying power levels reported in and . Due to electrode tip cooling, a temperature sensor embedded in the tip will not provide an accurate estimate of this maximum tissue temperature, which makes control of optimal power difficult. Therefore, most clinical irrigated ablation catheters employ constant power independent of blood flow [Citation4,Citation8,Citation9,Citation11], which often does not provide optimal thermal lesion size, as our results also suggest. One potential solution for improved power control – i.e., to vary power levels dependent on patient-specific conditions such as blood flow – is to use microwave radiometry to sense deep tissue temperatures [Citation15] and to use these temperature measurements to control applied power. This prototype catheter includes a helical microwave antenna for this purpose (). Therefore, the results presented in and and in can be considered representative of optimal thermal lesions that can be achieved when employing microwave radiometry with the cooled catheter to adjust power levels to achieve optimal tissue temperature.
This study has several limitations. While the catheter featured a microwave antenna, we did not employ microwave radiometry in experiments or computer models. We did not examine the impact of catheter insertion depth, which is known to impact size of the thermal lesion [Citation11,Citation12]. Thermal lesion size was approximated by the 55 °C isotherm in our experimental studies and was not directly measured. Also, unlike myocardium, the gel phantom has homogenous properties and a flat surface that may impact temperature and thermal lesion dimensions. The computational model did not include simulation of phase change of tissue due to tissue vaporization as in some previous studies [Citation24]. Also, while power was approximately constant for most of the ablation (after ∼15 s), we did not implement true constant-power ablation as used in clinical devices but applied constant voltage.
Conclusions
We have presented a 3-D computer model of an irrigated cardiac ablation catheter with a helical microwave antenna and have validated the model experimentally in gel phantoms. Parametric studies demonstrate that optimal power depends on both irrigation rate and blood flow, further showing that irrigation allows generation of consistently large thermal lesions independent of blood flow at the treatment site. Also, the computer model demonstrates the potential overheating of the proximal catheter tip region during low blood flow conditions, suggesting that lower RF power levels or increased irrigation rates may be required to address this potential issue.
Acknowledgments
The authors would like to acknowledge Dr John Dinolfo from the MUSC writing center for his assistance in revising the manuscript.
Disclosure statement
No potential conflict of interest was reported by the author(s).
Additional information
Funding
References
- Morady F. Radio-frequency ablation as treatment for cardiac arrhythmias. N Engl J Med. 1999;340(7):534–544.
- Haemmerich D. Biophysics of radiofrequency ablation. Crit Rev Biomed Eng. 2010;38(1):53–63.
- Yokoyama K, Nakagawa H, Wittkampf FH, et al. Comparison of electrode cooling between internal and open irrigation in radiofrequency ablation lesion depth and incidence of thrombus and steam pop. Circulation. 2006;113(1):11–19.
- Moreno J, Quintanilla JG, Molina-Morua R, et al. Morphological and thermodynamic comparison of the lesions created by 4 open-irrigated catheters in 2 experimental models. J Cardiovasc Electrophysiol. 2014;25(12):1391–1399.
- Kanj MH, Wazni O, Fahmy T, et al. Pulmonary vein antral isolation using an open irrigation ablation catheter for the treatment of atrial fibrillation. J Am Coll Cardiol . 2007;49(15):1634–1641.
- Tanner H, Hindricks G, Volkmer M, et al. Catheter ablation of recurrent scar-related ventricular tachycardia using electroanatomical mapping and irrigated ablation technology: Results of the prospective multicenter euro-vt-study. J Cardiovasc Electrophysiol. 2010;21(1):47–53.
- Haines D. Biophysics of ablation: application to technology. J Cardiovasc Electrophysiol. 2004;15(10 Suppl):S2–S11.
- Pilcher TA, Sanford AL, Saul JP, et al. Convective cooling effect on cooled-tip catheter compared to large-tip catheter radiofrequency ablation. Pacing Clin Electro. 2006;29(12):1368–1374.
- González-Suárez A, Pérez JJ, Berjano E. Should fluid dynamics be included in computer models of rf cardiac ablation by irrigated-tip electrodes? Biomed Eng Online. 2018;17(1):43.
- Pérez JJ, González-Suárez A, Berjano E. Numerical analysis of thermal impact of intramyocardial capillary blood flow during radiofrequency cardiac ablation. Int J Hyperthermia. 2018;34(3):243–249.
- Petras A, Leoni M, Guerra JM, et al. A computational model of open-irrigated radiofrequency catheter ablation accounting for mechanical properties of the cardiac tissue. Int J Numer Method Biomed Eng. 2019;35(11):e3232.
- Irastorza RM, Gonzalez-Suarez A, Pérez JJ, et al. Differences in applied electrical power between full thorax models and limited-domain models for rf cardiac ablation. Int J Hyperthermia. 2020;37(1):677–687.
- Leshem E, Zilberman I, Barkagan M, et al. Temperature-controlled radiofrequency ablation using irrigated catheters. JACC: Clinical Electrophysiology. 2020;6(1):83–93.
- Cooper JM, Sapp JL, Tedrow U, et al. Ablation with an internally irrigated radiofrequency catheter: learning how to avoid steam pops. Heart Rhythm. 2004;1(3):329–333.
- Koruth JS, Dukkipati S, Gangireddy S, et al. Occurrence of steam pops during irrigated rf ablation: novel insights from microwave radiometry. J Cardiovasc Electrophysiol. 2013;24(11):1271–1277.
- Panescu D, Whayne JG, Fleischman SD, et al. Three-dimensional finite element analysis of current density and temperature distributions during radio-frequency ablation. IEEE Trans Biomed Eng. 1995;42(9):879–890.
- Jain MK, Wolf PD. A three-dimensional finite element model of radiofrequency ablation with blood flow and its experimental validation. Ann Biomed Eng. 2000;28(9):1075–1084.
- Tungjitkusolmun S, Woo EJ, Cao H, et al. Thermal-electrical finite element modelling for radio frequency cardiac ablation: Effects of changes in myocardial properties. Med Biol Eng Comput. 2000;38(5):562–568.
- Tungjitkusolmun S, Vorperian VR, Bhavaraju N, et al. Guidelines for predicting lesion size at common endocardial locations during radio-frequency ablation. IEEE Trans Biomed Eng. 2001;48(2):194–201.
- Gopalakrishnan J. A mathematical model for irrigated epicardial radiofrequency ablation. Ann Biomed Eng. 2002;30(7):884–893.
- Lai YC, Choy YB, Haemmerich D, et al. Lesion size estimator of cardiac radiofrequency ablation at different common locations with different tip temperatures. IEEE Trans Biomed Eng. 2004;51(10):1859–1864.
- Berjano EJ. Theoretical modeling for radiofrequency ablation: State-of-the-art and challenges for the future. Biomed Eng Online. 2006; 5:24.
- Schutt D, Berjano EJ, Haemmerich D. Effect of electrode thermal conductivity in cardiac radiofrequency catheter ablation: a computational modeling study. Int J Hyperthermia. 2009;25(2):99–107.
- González-Suárez A, Berjano E, Guerra JM, et al. Computational modeling of open-irrigated electrodes for radiofrequency cardiac ablation including blood motion-saline flow interaction. PLoS One. 2016;11(3):e0150356.
- Linte C, Camp J, Rettmann M, et al. Lesion modeling, characterization, and visualization for image-guided cardiac ablation therapy monitoring. J Med Imaging (Bellingham)). 2018;5(2):021218.
- Haemmerich D, Saul JP. Quantification of local convectional cooling during cardiac radiofrequency catheter ablation. Conf Proc IEEE Eng Med Biol Soc. 2006;2006:6293–6296.
- Deshazer G, Prakash P, Merck D, et al. Experimental measurement of microwave ablation heating pattern and comparison to computer simulations. Int J Hyperthermia. 2017;33(1):74–82.
- Hernandez-Eugenio G, Echeverria-Landin E, Schlam FH. Detection of Escherichia coli growth using infrared thermography. Agrociencia. 2007; 41:503–511.
- Haemmerich D, Webster JG, Mahvi DM. Thermal dose versus isotherm as lesion boundary estimator for cardiac and hepatic radio-frequency ablation. Engineering in Medicine and Biology Society, 2003 Proceedings of the 25th Annual International Conference of the IEEE, Vol. 1, 2003. p. 134–137.
- Wood M, Goldberg S, Lau M, et al. Direct measurement of the lethal isotherm for radiofrequency ablation of myocardial tissue. Circ Arrhythm Electrophysiol. 2011;4(3):373–378.
- Johnston BM, Johnston PR, Corney S, et al. Non-Newtonian blood flow in human right coronary arteries: Steady state simulations. J Biomech. 2004;37(5):709–720.
- Craciunescu OI, Clegg ST. Pulsatile blood flow effects on temperature distribution and heat transfer in rigid vessels. J Biomech Eng. 2001;123(5):500–505.
- Horng TL, Lin WL, Liauh CT, et al. Effects of pulsatile blood flow in large vessels on thermal dose distribution during thermal therapy. Med Phys. 2007;34(4):1312–1320.
- Schutt DJ, Haemmerich D. Sequential activation of a segmented ground pad reduces skin heating during radiofrequency tumor ablation: optimization via computational models. IEEE Trans Biomed Eng. 2008;55(7):1881–1889.
- Incropera FP, DeWitt DP. Free convection. In Fundamentals of heat and mass transfer. New York, NY: Springer; 2004. pp. 545–553.
- Hou S. Photo-thermally enhanced temperature gradient gel electrophoresis for DNA separation. Boston, MA: Northeastern Univ., 2018.
- Amestoy PR, Duff IS, L'Excellent JY. Multifrontal parallel distributed symmetric and unsymmetric solvers. Comput Methods Appl Mech Eng. 2000;184(2-4):501–520.
- Valvano JW, Cochran JR, Diller KR. Thermal conductivity and diffusivity of biomaterials measured with self-heated thermistors. Int J Thermophys. 1985;6(3):301–311.
- Gabriel S, Lau RW, Gabriel C. The dielectric properties of biological tissues: II. Measurements in the frequency range 10 Hz to 20 GHz. Phys Med Biol. 1996;41(11):2251–2269.
- Rossmann C, Haemmerich D. Review of temperature dependence of thermal properties, dielectric properties, and perfusion of biological tissues at hyperthermic and ablation temperatures. Crit Rev Biomed Eng. 2014;42(6):467–492. in press.
- Wagner W, Pruß A. The iapws formulation 1995 for the thermodynamic properties of ordinary water substance for general and scientific use. J Phys Chem Ref Data . 2002;31(2):387–535.
- Stogryn A. Equations for calculating the dielectric constant of saline water. IEEE Trans Microwave Theory Techn. 1971;19(8):733–736.
- Ho C-H. White blood cell and platelet counts could affect whole blood viscosity. J Chin Med Assoc. 2004; 67:394–397.
- FDA. Reporting of computational modeling studies in medical device submissions; 2016.
- Viceconti M, Pappalardo F, Rodriguez B, et al. In silico trials: verification, validation and uncertainty quantification of predictive models used in the regulatory evaluation of biomedical products. Methods. 2021;185:120–127.