
Abstract
Purpose
Microwave ablation (MWA) provides an effective treatment of lung and liver tumors but suffers from a lack of reproducibility of ablation size among currently available technologies. In-vitro evaluations are far removed from clinical practices because of uninfused tissue. This study is in-vivo preclinical testing of a new MWA system on swine lungs and liver.
Materials and methods
All ablations were performed under CT guidance and multiple algorithms were tested with a power of 50, 75, and 100 W for durations of 3, 5, 8, 10, and 15 min. A 3 D-evaluation of the ablation zone was carried out using enhanced-CT. The sphericity index, coefficients of variation, and energy efficiency (which corresponds to the volume yield according to the power supplied) were calculated.
Results
Fifty liver and 48 lung ablations were performed in 17 swine. The sphericity index varies from 0.50 to 0.80 for liver ablations and from 0.40 to 0.69 for lung ablations. The coefficient of variation was below 15% for 4/5 and 4/8 protocols for lung and liver ablations, respectively. The energy efficiency seems to decrease with the duration of the ablation from 0.60 × 10⁻³ cm3/J (75 W, 3 min) to 0.26 × 10⁻³ cm3/J (100 W, 15 min) in the liver and from 0.57 × 10⁻³ cm3/J (50 W, 10 min) to 0.42 × 10⁻³ cm3/J (100 W, 12 min) in the lungs.
Conclusion
A shorter treatment time provides the best energy efficiency, and the best reproducibility is obtained for a 10 min treatment duration. The system tested provides an interesting reproducibility in both lung and liver measurements. Our results may help interventional radiologists in the optimal selection of treatment parameters.
Introduction
Percutaneous thermal ablations to treat small liver and lung tumors have proven to be safe and efficient in clinical practice as alternatives to other local therapies, such as surgery or radiation therapy [Citation1]. Several ablation technologies are used, including microwave ablation (MWA), radiofrequency ablation (RFA), and cryoablation [Citation2] with standardization of their practice [Citation3].
MWA is one of the most recently developed thermal ablation techniques [Citation4] that uses high-energy electromagnetic waves (915–2450 MHz), causing tissue heating and coagulation [Citation5–7]. Indications for MWA in the liver are well-supported with international guidelines, especially for the management of metastatic colorectal cancer and hepatocellular carcinoma [Citation8,Citation9]. When thermal ablation is delivered to a tissue, the cell destruction relies on three concomitant phenomena: active thermal heating, passive thermal conduction, and thermal convection, which is the dissipation of heat caused by blood fluid exchange. Such dissipation is mostly linked to blood circulation and provides a heat-sink effect when the ablation is close to large vessels [Citation10,Citation11]. Thermal convection exists only in vivo, and this phenomenon partially explains why more energy is needed to reach the same volume of ablation zone to ex vivo. This is the reason why a device should be tested in vivo model. Another explanation for this difference may be linked to the differences in active and passive antenna cooling when tissue is vascularized. When compared with RFA, the use of MWA allows a rapid increase in temperature to reach a highly burned in the tissue, resulting in a theoretically shorter procedure time and lesser impact of the heat-sink effect [Citation12,Citation13]. These characteristics should be linked to the ability to obtain larger ablation zones because they rely more on active than passive heating with less convective cooling [Citation12,Citation14,Citation15]. However, one of the drawbacks of MWA technology and very high temperatures in the heating along the needle shaft, and a conventional antenna without cooling has a radiating power that extends along with this needle shaft corresponding to the longitudinal axis. The resulting heating zone tends to shape into a teardrop, causing a comet effect. As a solution, cooling and choke embedment in the antenna have been used to allow for a more spherical ablation zone [Citation16].
A comprehensive understanding of the data and a critical appraisal of the efficacy and safety profile of each ablation system is required because significant variability appears to exist among MWA equipment and devices [Citation17]. Optimization of the ablation parameters is needed for each system. In this regard, in vivo data are mandatory, owing to major differences between ablation zones obtained ex vivo and in vivo [Citation18–20]. As highlighted in a recent review paper, ‘Clinical data reporting on ablation zone volume to applied energy and sphericity index (SI) during MWA are scarce and require more adequate reporting of MWA data’ [Citation21].
The purpose of this study is to investigate various in vivo parameters for MWA in livers and lungs using a novel MWA ablation system to provide adequate guidance for users in clinical practice.
Materials and methods
Subjects
This study was performed according to the European Convention for the Protection of Vertebrate Animals for experimentation, and the approval was given by the Ethics Committee for the Use and Care of Animals, No. 2016052312473717-V2 #5432. Twenty-one healthy 8-week-old female Pietrain swine (45 ± 5 kg) were used. All swine were housed by a family in a dedicated place. After a 7-day acclimation period, the pigs fasted for 12 h before the procedure with free access to water.
MWA antenna
A 15-gauge single 2450-MHz water-cooled antenna (Dophi™ M150E, Surgnova, HDTECH France, Lorient) was used for each ablation. The front tip of the antenna was designed with a patented choke ring with Antiphase™ technology to calculate the internal and external electromagnetic wavelengths at the choke-ring structure. The goal is to monitor the actual forward power and reflected power in real-time and automatically compensate the reflected power for the output loss. The electromagnetic waves produced at the choke were in the opposite phase. When the two microwave components meet at the end of the copper foil choke, they cancel each other out, owing to the same amplitudes and opposite phases, and no longer propagate backward.
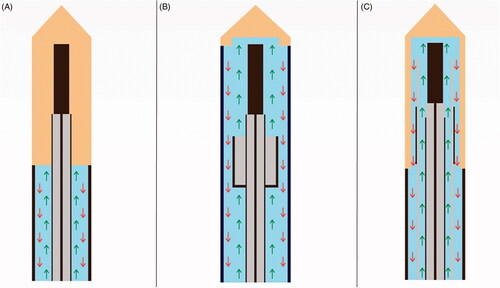
The antenna we used had a full antenna water-cooling technology distal up to the MWA emission point, where the circulation of water entered the radiation zone through the annular composite choke structure (). This reduces the temperature of the center of the ablation zone, thereby allowing enhanced power delivery, reducing energy transmission loss, maintaining stable microwave power, and avoiding wavelength changes caused by tissue destruction close to the active tip.
Figure 1. Graphical representation of various water-cooling technologies of microwaves antennas with inflow cooling (green arrow) and outflow cooling (red arrow). (A) Conventional cooling technology without cooling of the emitting part. (B) Partial shaft cooling excluding the radiator with limited thermal control may increase the risk of antenna breakage. (C) Entire shaft cooling passing through the radiator optimal cooling performance and reduced puncture damage with the smaller caliber of the antenna shaft.
MWA procedure
After sedation with 20 mg/kg ketamine and 0.11 mg/kg acepromazine, animals were placed in a dorsal recumbent position and a venous catheter was inserted into a large vein in the ear for intravenous administration. Anesthesia was induced using propofol (2 mg/kg). After orotracheal intubation, anesthesia was maintained with sevoflurane gas (2%) and mechanical respiration (Zeus Dräger, Lübeck, Germany), and a constant intravenous infusion of sufentanil (1 µg/kg/h). Continuous monitoring of heart rate, blood pressure, pulse oximetry, and capnography was used to evaluate animal hemodynamics.
Animals were placed in the dorsal position on the computer tomography (CT) table (Discovery CT750 HD, GE Healthcare, Milwaukee, WI, USA) and safely anchored with straps. MWA was performed by three experienced operators via image-guided tumor ablation (P.H., T.D., and J.Y.G), with 7-, 23-, and 15-years’ experience, respectively. For lung ablation, microwave antennas were percutaneously placed through the chest wall into a healthy lung under fluoroscopic guidance, and the location of the antennas was confirmed using CT. The upper right, lower right, upper left, and lower left lobes were subsequently targeted for one ablation each. For liver ablation, direct access to the liver was obtained with a median abdominal incision made by a visceral surgeon (S.C.), and the antennas were placed with preoperative ultrasound guidance (Aplio XV, Toshiba Medical Systems, Tokyo, Japan). Areas targeted for ablation were centered in the liver lobes as far as possible from the capsule or liver fissure to avoid difficulties in measuring the ablation potential. Ideally, the right lobe, median-right lobe, and median-left lobe were targeted for one ablation each. For each swine, a total of four lung ablations and three liver ablations were attempted. Among the specifics of our system, we used a removable cable that made the antennas user-friendly while moving the animal on the CT gantry.
Eight protocols were tested in livers () and five in lungs (). Technical success was achieved if the electrodes were placed into the organ and completed the cycle of ablation.
Table 1. Liver ablation zone measurement according to treatment parameter.
Table 2. Lung ablation zone measurement according to treatment parameter.
Complications were registered. Pneumothoraces were notified. Bleeding corresponding to an extravascular leakage of contrast medium seen on the enhanced control CT scan was reported at 40 or 70 s if occurred. A spontaneously hyperdense subcapsular or intra-parenchymal collection was searched, and a portal vein thrombosis was quantified as none, main, right, left, or distal corresponding to a clot found in the portal vein in contact with the ablation zone. Other diagnostic imaging parameters without clinical consequences, such as peri ablation gas or hyperdense zone at ablation zone center were not collected.
At the end of ablation procedures, the animals were sacrificed with an intravenous sodium pentobarbital solution (Dolethal, 20 ml, Vetoquinol 70200 LURE). The livers and lungs were explanted for pathological evaluation. Lung ablation zones were externally identified by palpation and visual inspection and then sectioned in the plane of the long axis of the antenna. The liver was sectioned along the antennas left in place. The goal of these explanations was to ensure that the ablation zones were adequate.
Quantification of the ablation area
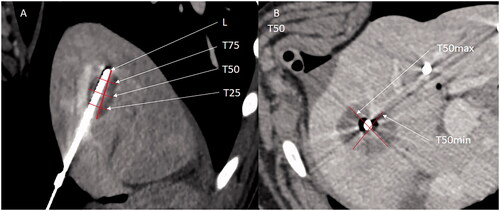
The ablation zones were quantified using multiplanar reconstruction of enhanced CT obtained 70 s after intravenous injection of a 1.5 ml/kg contrast medium injected at a flow rate of 2.5 ml/s. CT was performed within 5 min of liver ablation with antennas left in place (). In cases of pneumothorax, a chest tube was inserted, and the pneumothorax was manually expelled before CT acquisition. The long-diameter (L) measurement was defined according to the greatest measurable dimension along with a single section corresponding to the axis of the antenna. The mean transverse diameter was defined as the mean of the shortest and longest measurements perpendicular to the longitudinal axis at 25% (T25), 50% (T50), and 75% (T75) of the ablation long diameter (). The measurements were made independently by two operators having 7 and 5 years’ experience in chest imaging (P.H. and M.D., respectively). The ablation volume was calculated using the ellipsoid volume formula ‘4/3 × π × L/2 × T50’.
Figure 2. Liver ablation on enhanced CT scan. (A) Sagittal view of liver ablation showing the elliptical shape ablation obtained with 50 W for 5 min with a sphericity index of 0.61. (B) Fontal view of liver ablation imaging the round shape attempted with 50 W for 10 min with a sphericity index of 0.89. (C) Axial view of liver ablation obtained with 10 min 100 W with a sphericity index of 0.83. (D) Para-sagittal view showing the round shape ablation between the abdominal wall and the gallbladder obtained with 50 W for 10 min and with a sphericity index of 0.75.
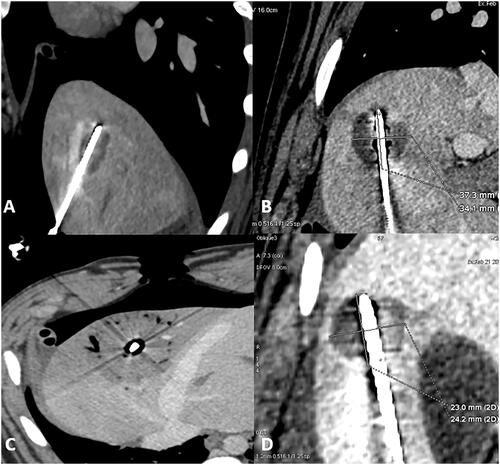
Figure 3. Lung ablation; (A,B) sagittal view of lung ablation, showing a round shape of the ablation obtained with 10 min 100 W with a sphericity index of 0.81. (C) Axial view of lung ablation showing again round shape with 10 min 50 W and sphericity index of 0.58. (D) Sagittal view with 12 min 100 W showing a more elliptical shape with a sphericity index of 0.35.
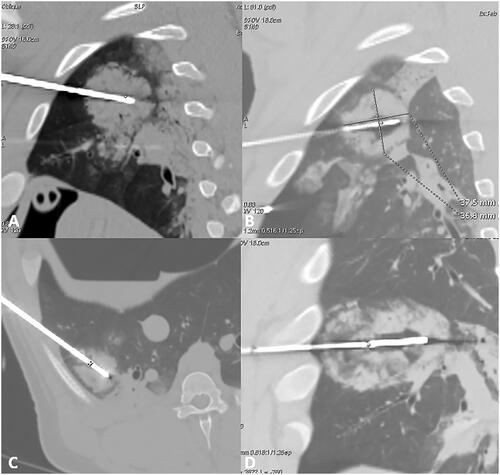
Figure 4. Example of measures of a liver ablation zone. (A) Reformat image along the axis of the antenna on enhanced CT. Measure of the long axis (L) with the antenna left in pace to better assesses the long axis. The T25, T50, and T75 of the ablation zone are shown. (B) T50min and T50max (shortest and longest measurement perpendicular to the longitudinal axis at 50% of L).
The SI of the ablation zone was calculated as T502/L2, as described elsewhere [Citation21]. The sphericity of one corresponds to a perfect sphere. An SI below one corresponds to an elongated shape along with the MWA antenna, and an SI above one corresponds to a lesion elongated perpendicular to the MWA antenna [Citation22]. The applied energy in joules was determined by multiplying the power output in watts and the ablation time in seconds. The efficiency was defined as the relation between the applied energy and ablation zone volume or the ratio of the ablation zone volume (cm3) to the applied energy (J).
Statistical analysis
Continuous data with a normal distribution are expressed as mean ± standard deviation and non-normally distributed data as the median. Categorical data are expressed as frequencies or percentages. The coefficient of variation (CV) was calculated as the ratio of the standard deviation to the mean value and provided for both L and T50. We introduced CV, because it normalizes the standard deviation with respect to the mean, whereas the standard deviation is proportional to the mean. We arbitrarily defined that a CV under 15% was considered acceptable in oncology, 16–19% was considered as the limit, and more than 20% was considered unacceptable. Intraclass correlation coefficient [95% confidence interval] was estimated based on a single-rating, absolute-agreement, 2-way random-effects model to assess the inter-observer reliability between the measures made by P.H. and those made by M.D. For group comparison, a Kruskal–Wallis test was performed using post-hoc Dunn’s multiple comparison test. For global size comparisons of T25, T50, T75, and L between groups, a mixed-effects model with Geisser-Greenhouse correction were performed with protocol and measure (T25, T50, T75, and L) as a fixed effect, using post-hoc Bonferroni multiple comparison test. All the data were analyzed using SPSS (SPSS Inc., Chicago, IL, USA) and Prism 8 (GraphPad Software, Inc., San Diego, CA, USA). Statistical significance was set to p < 0.05.
Results
MWA was performed on 17 animals with 100% technical success. Four pigs died before the final enhanced CT scan was obtained. Two animals died after liver ablations, and two died during lung ablation owing to massive hemorrhaging. Four pigs received only three lung ablations. Altogether, 50 liver ablations and 48 lung ablations were available for analysis among the 17 pigs.
The inter-observer reproducibility for the measures of ablation zone was high with an intraclass correlation coefficient of 0.93 [0.91–0.94] for all measures, 0.93 [0.90–0.95] for lung measures, and 0.92 [0.91–0.94] for liver measures. Liver ablation data are provided in , and lung ablation data are provided in .
When characterizing lung ablation with T25, T50, T75, and L, all five protocols provided significantly different ablations, except for 10 min at 50 W vs. 10 min at 75 W (p = 0.38), 10 min at 75 W vs. 10 min at 100 W (p = 0.97), and 10 min at 50 W vs. 10 min at 100 W (p = 0.12). When characterizing liver ablation with T25, T50, T75, and L, ablation size differs significantly most of the time if ablation duration was higher for 5 min and/or power for 25 W. Details are provided ().
Figure 5. Graph illustrating the size in millimeters of T25, T50, T75, and L for all liver ablation, and the statistical difference between ablations.
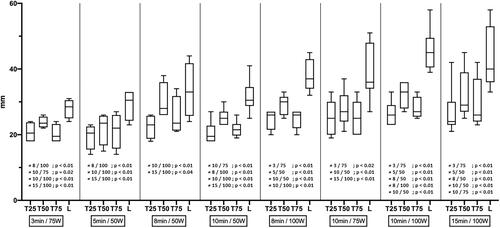
The SI of liver ablations was between 0.50 and 0.83 with a median value of 0.58, while that of lung ablations was between 0.35 and 0.65 with a median value of 0.58. There was no difference in the measure of SI in livers from various protocols tested (p = 0.21). There were statistical differences of SI in lung measurements for 10 min at 50 W vs. 10 min at 100 W with a median value of 0.65 vs. 0.53, respectively (p = 0.04) and 10 min at 50 W vs. 12 min at 100 W: 0.65 vs. 0.35, respectively (p = 0.02).
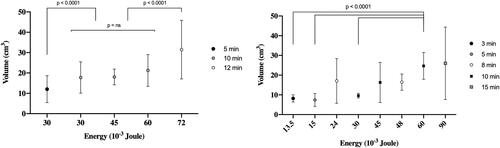
Median energy efficiency was between 0.17 × 10⁻³ and 0.63 × 10⁻³ cm3/J in liver ablations for 15 min at 100 W and 3 min for 75 W, respectively, and between 0.32 × 10⁻³ and 0.55 × 10⁻³ cm3/J in lung ablations for 10 min at 100 W and 10 min at 50 W, respectively (). There was a global statistical difference in energy efficiency among various liver protocols used (p = 0.02) but the post-hoc analysis does not found a significant difference between groups. The mean energy efficiency for the 13 lung ablations performed at 50 W for 10 min (0.55 × 10⁻³ cm3/J) was significantly different from that obtained after 12 ablations performed at 100 W for 10 min (0.32 × 10⁻³ cm3/J) (p = 0.01). There was no other difference in energy efficiency between all the other protocols tested in the lungs.
Figure 6. Graphs illustrating the volume of ablation (cm3) over the energy delivery (joule). Left-sided graph showing lung ablations and right-sided graph showing liver ablations. In the lung, the volume was different according to the duration of ablation more than the energy. In the liver, low energy is permitted to achieve more reproducible volume ablation.
Pneumothorax was unilateral in four animals and bilateral in nine animals at the end of lung ablation procedures. Nine animals did not require chest tube insertion, whereas four having large pneumothorax required chest tube placement to adequately measure the ablation zone on the final post-ablation enhanced CT. No hemothorax occurred. Significant atelectasis was found at the periphery of the three pulmonary ablations.
Distal portal vein thromboses were seen in nine of 50 ablations, whereas proximal portal thrombosis was found in five. Neither arterial bleeding nor hepatic vein thrombosis was observed.
Discussion
The use of MWA as a recent alternative to RFA and surgery represents a credible option for the treatment of pulmonary and hepatic tumors [Citation17,Citation23]. A predictable and reproducible ablation zone is the key for local tumor control and has been reported to be linked with a zone of ablation large enough to cover the tumor plus ablation margins of a minimum of 5 mm and ideally 10 mm [Citation24,Citation25] and thinnest margins are linked to local recurrence [Citation26]. Evaluation of margins with 3 D imaging of the ablation zone both immediately or later in follow-up are key points [Citation27–33]. The ablation zone must be predictable to avoid unnecessary destruction of parenchyma or complications within the target organ. Significant variability in technology appears to exist among different MWA systems, such as the operating frequency, the power of the generator, the power delivered to tissues after power loss in the cable, and the microwave applicator design, including its geometry, diameter, and cooling mechanism. Consequently, specific information on the recommended technical parameters and protocols should be implemented in clinical practice for each system [Citation34]. Further, recommended protocols must be evolved from in vivo data, owing to discrepancies between in-vitro and in vivo ablations. Such discrepancies are demonstrated in MWA ablation zones, which are reported to be similar during the first 2 min in vivo and ex vivo, but grow faster with time ex vivo than in vivo, reaching a plateau at 8 min for in vivo ablation volume, whereas ex vivo ablations continue to increase in size [Citation35]. A significant correlation between volume and energy deposit has been found for ex vivo experiments and not for in vivo experiments [Citation21]. Others have reported flattening of the ablation volume curve at constant power delivery when prolonging ablation duration, which reflects the same phenomenon [Citation36]. This pattern of in vivo MWA ablation was clearly demonstrated in our experiment, where the energy efficiency decreased from 0.63 to 0.48, then to 0.42–0.24, and finally to 0.17 × 10⁻³ cm3/J for a 3, 5, 10, and 15 min ablation time, respectively. This decrease in energy efficiency can be explained by the increased input of passive heating with time and tissue convective cooling in vivo. Interestingly, this decrease in energy efficiency with ablation time appears to be less steep for lung ablation, probably caused by the lower perfusion and aerated nature of lung tissue. When looking at the fixed duration of ablation of 10 min, it is noteworthy that energy efficiency was 0.55 × 10⁻³, 0.37 × 10⁻³, and 0.32 × 10⁻³ cm3/J for 50, 75, and 100 W, respectively, demonstrating higher energy efficiency at lower power.
Prolonging treatment duration beyond 10 min was responsible for poor reproducibility, as highlighted by our 0.24 and 0.21 short-axis CVs after 15 min in livers and 12 min in lungs, respectively. The highest reproducibility was obtained for a treatment time of 10 min with a CV of 0.12–0.20 in livers and 0.12–0.15 in lungs, whereas shortening the treatment time to 5 min increased CV to 0.23 and 0.22 in the two cases, respectively. Consequently, for the sake of reproducibility and efficiency, it is advisable to use treatments longer than 5 min with a maximum of 10 min. Of the 13 different protocols, the most reproducible ones were those having a delivery time of 10 min: 10 min at 50 W (31 × 25 mm) and 10 min at 100 W (45 × 32 mm) in livers and 10 min at 75 W (40 × 30 mm) in lungs. This excellent reproducibility is at least partially explained by an antenna-embedded specific automatic power compensation technology (patented).
Straight MWA antennas have the drawback of an ablation zone elongation along the needle axis, which can be improved. With the Antiphase™ technology, the ablation zone tended to be more spherical. We calculated SI using T502/L2, but it is noteworthy that different methods of calculation of SI have been reported in the MWA literature. Some authors have used the l/L ratio [Citation36], which is flatter than our formula for the same elongation of the ablation zone because it gives results closer to one. Consequently, comparisons between the publications are difficult. We report a median SI of 0.58 [0.50–0.83]. In a recent systematic review of various FDA-approved MWA systems in which SI was calculated with the same formula as in the present study, SI dropped significantly between ex vivo and in vivo experiments, and during the last 5 years, no study using a single probe met sphericity of 0.83. The best-reported results were in the range 0.56–0.66 [Citation19].
The median SI of 0.58 in lungs is close to the results obtained in livers, even if MWA in lungs faces specific problems owing to continuous inhalation and exhalation of air/gases, resulting in major changes in the dielectric constant of lung tissue. If a conventional MWA antenna is used, the composite choke ring at the tip of the antenna cannot meet the change in the lung dielectric constant, and the ablation area will become ellipsoidal. The antenna we used was adapted to the range of the lung dielectric constant by changing its internal design. It is noteworthy that the SI was between 0.53 and 0.65 for 5 and 10 min ablations. Our results seem to bring solutions for difficulties in reproducibility and sphericity of lung ablations that have been underlined previously, where the SI reported was in the 1.4–1.6 range using the L/l formula, which is equivalent to 0.39–0.51 according to our formula [Citation22]. With a single applicator, the ablation zones were elongated along the needle axis, and the small-diameter perpendicular to the antenna limited the possibility of ablation of tumors >3 cm in a single ablation.
Hepatic ablation-induced thromboses of the portal branch adjacent to the target area were reported in 17% of MWA, with a correlation between thrombus formation and blood-flow velocity, vessel-antenna spacing, and vessel diameter (p = 0.08) [Citation37]. Moreover, such thromboses of proximity vessels indicate the efficacy of MWA to prevent the heat-sink effect. We found 5 proximal thromboses, probably more frequent than in real life, which could have happened because of 3 liver ablations at the same time, on each lobe. There was no damage to the arterial tree or hepatic vein and no sign of hematoma or active bleeding, which is consistent with other in vivo studies. Pneumothorax is one of the most frequent side effects of lung thermal ablation and is, in fact, expected and not a complication per se [Citation38]. Pneumothorax cases in our study were always limited with no significant mass effect on the mediastinal structures and were probably more frequent than in real life because of the introduction of two needles on each side.
Our study has limitations, including that healthy lung and hepatic parenchyma differ from tumors with possible differences in energy absorption, including permittivity, which may vary according to temperature [Citation39]. However, the size of the pig lung and liver is comparable to that of humans, which allows for the evaluation of large ablation zones that stay away from the fissures and capsules and forms a relatively realistic in vivo experiment that is superior to those on explanted non-infused and non-ventilated tissues.
In conclusion, we reported an in vivo experiment with a new MWA system that demonstrated interesting predictability and sphericity abilities in both livers and lungs, as well as excellent reproducibility for 5–10-min ablations. This study can help future users in daily clinical practice.
| Abbreviations | ||
| CT | = | computed tomography |
| CV | = | coefficient of variation |
| MWA | = | microwave ablation |
| RFA | = | radiofrequency ablation |
| W | = | watt |
Acknowledgments
Thanks to the LIIE team for his contribution.
Disclosure statement
All the authors meet the International Committee of Medical Journal Editors (ICMJE).
Additional information
Funding
References
- Yuan Z, Wang Y, Zhang J, et al. A meta-analysis of clinical outcomes after radiofrequency ablation and microwave ablation for lung cancer and pulmonary metastases. J Am Coll Radiol. 2019;16(3):302–314.
- Palussière J, Catena V, Buy X. Percutaneous thermal ablation of lung tumors – radiofrequency, microwave and cryotherapy: where are we going? Diagn Interv Imaging. 2017;98(9):619–625.
- Ahmed M, Solbiati L, Brace CL, et al. Image-guided tumor ablation: standardization of terminology and reporting criteria—a 10-year update. J Vasc Intervent Radiol. 2014;25(11):1691–1705.e4.
- Dupuy DE. Microwave ablation compared with radiofrequency ablation in lung tissue-is microwave not just for popcorn anymore? Radiology. 2009;251(3):617–618.
- Hines-Peralta AU, Pirani N, Clegg P, et al. Microwave ablation: results with a 2.45-GHz applicator in ex vivo bovine and in vivo porcine liver. Radiology. 2006;239(1):94–102.
- Simo KA, Tsirline VB, Sindram D, et al. Microwave ablation using 915-MHz and 2.45-GHz systems: what are the differences? HPB. 2013;15(12):991–996.
- Lubner MG, Brace CL, Hinshaw JL, et al. Microwave tumor ablation: mechanism of action, clinical results, and devices. J Vasc Intervent Radiol. 2010;21(8 Suppl):S192–S203.
- Benson AB, Venook AP, Al-Hawary MM, Arain MA, et al. Colon cancer, version 2.2021, NCCN clinical practice guidelines in oncology. J Natl Compr Canc Netw. 2021;19(3):329–359.
- Benson AB, D'Angelica MI, Abbott DE, et al. Guidelines insights: hepatobiliary cancers, version 2.2019. J Natl Compr Canc Netw. 2019;17(4):302–310.
- Carberry GA, Nocerino E, Cristescu MM, et al. Microwave ablation of the lung in a porcine model: vessel diameter predicts pulmonary artery occlusion. Cardiovasc Intervent Radiol. 2017;40(10):1609–1616.
- Yu NC, Raman SS, Kim YJ, et al. Microwave liver ablation: influence of hepatic vein size on heat-sink effect in a porcine model. J Vasc Intervent Radiol. 2008;19(7):1087–1092.
- Kim C. Understanding the nuances of microwave ablation for more accurate post-treatment assessment. Future Oncol. 2018;14(17):1755–1764.
- Schramm W, Yang D, Haemmerich D. Contribution of direct heating, thermal conduction and perfusion during radiofrequency and microwave ablation. In: 2006 International Conference of the IEEE Engineering in Medicine and Biology Society [Internet]. New York, NY: IEEE; 2006 [cited 2020 Aug 25]. p. 5013–5016. Available from: http://ieeexplore.ieee.org/document/4462929/
- Vogl TJ, Roman A, Nour Eldin NEA, et al. Comparison between 915 MHz and 2450 MHz microwave ablation systems for the treatment of small diameter lung metastases. Diagn Intervent Radiol. 2018;24(1):31–37.
- Ringe KI, Lutat C, Rieder C, et al. Experimental evaluation of the heat sink effect in hepatic microwave ablation. PLOS One. 2015;10(7):e0134301.
- Vogl TJ, Basten LM, Nour-Eldin N-EA, et al. Microwave ablation (MWA) of pulmonary neoplasms: clinical performance of high-frequency MWA with spatial energy control versus conventional low-frequency MWA. Am J Roentgenol. 2019;213(6):1388–1396.
- Bhardwaj N, Strickland AD, Ahmad F, et al. A comparative histological evaluation of the ablations produced by microwave, cryotherapy and radiofrequency in the liver. Pathology. 2009;41(2):168–172.
- Brace CL, Diaz TA, Hinshaw JL, et al. Tissue contraction caused by radiofrequency and microwave ablation: a laboratory study in liver and lung. J Vasc Intervent Radiol. 2010;21(8):1280–1286.
- Amabile C, Ahmed M, Solbiati L, et al. Microwave ablation of primary and secondary liver tumours: ex vivo, in vivo, and clinical characterisation. Int J Hyperthermia. 2017;33(1):34–42.
- Shyn PB, Bird JR, Koch RM, et al. Hepatic microwave ablation zone size: correlation with total energy, net energy, and manufacturer-provided chart predictions. J Vasc Intervent Radiol. 2016;27(9):1389–1396.
- Ruiter SJS, Heerink WJ, de Jong KP. Liver microwave ablation: a systematic review of various FDA-approved systems. Eur Radiol. 2019;29(8):4026–4035.
- Prud’homme C, Teriitehau C, Adam J, et al. Lung microwave ablation – an in vivo swine tumor model experiment to evaluate ablation zones. Int J Hyperthermia. 2020;37(1):879–886.
- Wang Y, Liu B, Cao P, et al. Comparison between computed tomography-guided percutaneous microwave ablation and thoracoscopic lobectomy for stage I non-small cell lung cancer: MWA vs. lobectomy for early NSCLC. Thorac Cancer. 2018;9(11):1376–1382.
- Sotirchos VS, Petrovic LM, Gönen M, et al. Colorectal cancer liver metastases: biopsy of the ablation zone and margins can be used to predict oncologic outcome. Radiology. 2016;280(3):949–959.
- Kurilova I, Bendet A, Petre EN, et al. Factors associated with local tumor control and complications after thermal ablation of colorectal cancer liver metastases: a 15-year retrospective cohort study. Clinical Colorectal Cancer. 2021;20(2):e82–e95.
- Kim Y, Lee WJ, Rhim H, et al. The minimal ablative margin of radiofrequency ablation of hepatocellular carcinoma (>2 and <5 cm) needed to prevent local tumor progression: 3D quantitative assessment using CT image fusion. Am J Roentgenol. 2010;195(3):758–765.
- Wang X, Sofocleous CT, Erinjeri JP, et al. Margin size is an independent predictor of local tumor progression after ablation of Colon cancer liver metastases. Cardiovasc Intervent Radiol. 2013;36(1):166–175.
- Shady W, Petre EN, Do KG, et al. Percutaneous microwave versus radiofrequency ablation of colorectal liver metastases: ablation with clear margins (A0) provides the best local tumor control. J Vasc Intervent Radiol. 2018;29(2):268–275.e1.
- Keil S, Bruners P, Schiffl K, et al. Radiofrequency ablation of liver metastases—software-assisted evaluation of the ablation zone in MDCT: tumor-free follow-up versus local recurrent disease. Cardiovasc Intervent Radiol. 2010;33(2):297–306.
- Tanis E, Spliethoff JW, Evers DJ, et al. Real-time in vivo assessment of radiofrequency ablation of human colorectal liver metastases using diffuse reflectance spectroscopy. Eur J Surg Oncol. 2016;42(2):251–259.
- Sotirchos VS, Fujisawa S, Vakiani E, et al. Fluorescent tissue assessment of colorectal cancer liver metastases ablation zone: a potential real-time biomarker of complete tumor ablation. Ann Surg Oncol. 2019;26(6):1833–1840.
- Calandri M, Yamashita S, Gazzera C, et al. Ablation of colorectal liver metastasis: Interaction of ablation margins and RAS mutation profiling on local tumour progression-free survival. Eur Radiol. 2018;28(7):2727–2734.
- Kaye EA, Cornelis FH, Petre EN, et al. Volumetric 3D assessment of ablation zones after thermal ablation of colorectal liver metastases to improve prediction of local tumor progression. Eur Radiol. 2019;29(5):2698–2705.
- Lencioni R, de Baere T, Martin RC, et al. Image-guided ablation of malignant liver tumors: recommendations for clinical validation of novel thermal and non-thermal technologies – a Western perspective. Liver Cancer. 2015;4(4):208–214.
- Lubner MG, Hinshaw JL, Andreano A, et al. High-powered microwave ablation with a small-gauge, gas-cooled antenna: initial ex vivo and in vivo results. J Vasc Intervent Radiol. 2012;23(3):405–411.
- Hoffmann R, Rempp H, Erhard L, et al. Comparison of four microwave ablation devices: an experimental study in ex vivo bovine liver. Radiology. 2013;268(1):89–97.
- Chiang J, Willey BJ, del Rio AM, et al. Predictors of thrombosis in hepatic vasculature during microwave tumor ablation of an in vivo porcine model. J Vasc Intervent Radiol. 2014;25(12):1965–1971.e2.
- Kashima M, Yamakado K, Takaki H, et al. Complications after 1000 lung radiofrequency ablation sessions in 420 patients: a single center’s experiences. Am J Roentgenol. 2011;197(4):W576–W580.
- Deshazer G, Merck D, Hagmann M, et al. Physical modeling of microwave ablation zone clinical margin variance: modeling of microwave ablation zone clinical margin variance. Med Phys. 2016;43(4):1764–1776.