
 ?Mathematical formulae have been encoded as MathML and are displayed in this HTML version using MathJax in order to improve their display. Uncheck the box to turn MathJax off. This feature requires Javascript. Click on a formula to zoom.
Abstract
Objective
Renal sympathetic denervation (RDN) is an alternative treatment for resistant hypertension (RH). This study aims to compare ablation effects using three radiofrequency applicators (i.e., balloon-based four electrodes, spiral and monopolar devices).
Methods
An idealized three-dimensional model of the renal artery was established using COMSOL Multiphysics to mimic radiofrequency ablation (RFA). Radiofrequency (RF) energy was delivered to the tissue at the same simulation settings, i.e., 4, 6, and 8 W for 60 s, using the three abovementioned RF applicators. The temperature distribution in the tissue was calculated using the coupled electrical–thermal–fluid finite element method. Lesion borders were defined using 50 °C isotherms. The maximum lesion depth, width, area, and circumferential coverage rate were compared among the three applicators at a blood flow of 0.4 m/s. Monopolar RF ablations in a renal artery phantom model were performed to validate the reliability of the simulation method.
Results
The balloon-based system yields greater lesion depths and widths compared with spiral and monopolar denervation under the same power. The range of maximum lesion depth is 1.58–3.11 mm for balloon-based RDN, 0.90–1.81 mm for spiral RDN and 1.12–2.38 mm for monopolar RDN, at a power of 4–8 W. The corresponding ranges of maximum lesion width are 2.22–5.73, 1.48–3.54, and 1.93–5.31 mm, respectively, and the circumferential coverage rates of the renal artery are 41.43%–91.99%, 31.71%–66.23%, and 9.55%–23.06%, respectively. The average velocity after balloon-based, spiral, and monopolar RDN increases by 3, 5, and 1 cm/s, respectively. The validation of the computer model offered prediction errors are <5% in terms of temperature at different locations (i.e., 2, 4, and 8 mm).
Conclusions
In terms of lesion size, balloon-based RDN appears to be the best option for the treatment of RH. However, the change in flow velocity in the arterial flow field suggests that its hemodynamic changes must be prioritized for investigating its safety. Although spiral catheter ablation yields the smallest lesion size and a significant change in flow velocity in the flow field, its coverage rate is larger than that of monopolar RDN; compared with balloon-based RDN, it did not obstruct most of the blood flow.
Introduction
Resistant hypertension (RH) is a chronic disease characterized by uncontrollable levels of 140/90 mmHg with the use of four or more blood pressure (BP)-lowering drugs [Citation1]. This chronic disease can cause a higher risk of cardiovascular events, such as myocardial infarction, coronary heart disease, heart failure, and ischemic stroke, as well as chronic kidney disease and death [Citation2]. Therefore, it has received significant attention in the field of global public health. Hypertension can be caused by many factors, including adverse diet and living habits, excessive activation of the renal sympathetic nerve, and hyperactivation of the renin–aldosterone–angiotensin system [Citation3]. Studies have shown that removing sympathetic nerves may reduce BP [Citation4]. However, surgical sympathectomy has been abandoned because of its side effects, trauma, slow recovery, and high morbidity [Citation5].
Radiofrequency renal denervation (RF-RDN) using radiofrequency (RF) energy is a minimally invasive approach that disrupts the renal sympathetic nerves to lower BP. This approach uses the RF energy generated by electrodes to disrupt the renal sympathetic nerves. In clinics, an RF electrode is inserted into the femoral artery and guided into the renal artery via Computed Tomography (CT) or Magnetic Resonance Imaging (MRI). Subsequently, radiofrequency ablation (RFA) is performed directly on the artery wall. Compared with sympathectomy, this method significantly reduces pain and has higher patient acceptance. Therefore, performing RDN to treat RH has become a topic of interest among researchers and clinicians.
Despite conflicting efficacy results (Symplicity HTN-3 [Citation6]), subsequent generator designs have confirmed the effectiveness of RDN [Citation7,Citation8]. Sievert et al. [Citation9] demonstrated the effectiveness of percutaneous renal artery application of bipolar RF energy based on 2 years of follow-up studies; the results show significant office BP reductions and few patients experiencing serious adverse events. Qu et al. [Citation10] confirmed that a self-developed novel four-electrode RFA catheter (Spark) significantly reduced the levels of BP and plasma renin, aldosterone, as well as angiotensin I and II in a porcine model. Sakaoka et al. [Citation11] investigated the safety of RDN using the IberisBloom system in a porcine model. The results indicated no change in serum creatinine after RF-RDN, no augmentation of medial damage or neointimal formation in the renal artery, and no or minimal damage to surrounding tissue. AI Raisi et al. [Citation12–15] conducted a series of experimental evaluations to investigate the efficacy of different RDN, including the Symplicity Flex system, EnligHTN system, and Symplicity Spyral system, and compared their lesion sizes to illustrate the ablation effect of different systems.
However, the abovementioned study only evaluated the thermal performance parameters of one or two applicators. In addition, researchers usually use animal models and human renal arteries to verify the safety and effectiveness of RDN. A few disadvantages were identified, such as long experimental periods and high costs.
Numerical simulation can predict the ablation effect, and more researchers are considering it as an evaluation method. Although the results yielded by this method may differ from clinical results, they reflect the change rule of ablation to some extent. Studies involving computer simulations of RDN are scarce. Guo et al. [Citation16] simulated the temperature field of monopolar RDN; however, the renal artery model used was in two dimensions. Dong [Citation17] used a three-dimensional numerical model to verify the effectiveness of single-electrode therapy through computational modeling and in vitro experiments. Baik et al. [Citation18] verified the feasibility of a laparoscopic-based system through numerical simulations and swine experiments. However, the bifurcation position of the artery was not considered in their model, and the flow field was not analyzed. Liu et al. [Citation19] performed particle image velocimetry (PIV) experiments to analyze the safety of flow fields, albeit based on a two-dimensional arterial model. These studies focused primarily on monopolar therapy, and the coagulation area after multi-electrode therapy was not clarified. In addition, the bioheat effect (temperature field distribution, thermal injury dimensions, etc.) and the change in the flow field during RDN have not been elucidated. To overcome the abovementioned limitations, the coupling effect of various RF generators in electromagnetic, temperature, and flow fields must be analyzed from the perspective of methodology. Hence, this study evaluated the ablation characteristics of various RDN applicators using the multi-field coupling method. The characteristics evaluated included the lesion size (i.e., the maximum lesion depth, width, and area), tissue–electrode interface temperature, and arterial circumferential coverage rate. The maximum lesion depth, width, and area can reflect the thermal injury dimensions of renal sympathetic nerves. The tissue–electrode interface temperature was used to evaluate the possible injury to the renal artery wall. The circumferential arterial coverage rate is the ratio of the angle covered by the ablation zone around the renal artery to the total angle (360°); it reflects whether full artery ablation is performed.
Currently, the typically used system for RDN is the Symplicity™ Flex (Medtronic, Minneapolis, MN, USA) monopolar system. Other RF systems used include the multi-electrode (×4) Symplicity™ Spyral system (Medtronic, Inc. MN, USA) [Citation20], Iberis® (Terumo, Tokyo, Japan, spiral form) multi-electrode RDN catheter, EnligHTN™ (St Jude Medical, MN, USA), bipolar balloon-based Vessix™ Vascular V2 (Boston Scientific, MA, USA), unipolar balloon-based OneShot™ (Covidien, CA, USA) ultrasonic ablation system, and PARADISE® (ReCor Medical system, CA, USA) [Citation21,Citation22].
Based on the abovementioned system, this study established the geometric models of three RF applicators (i.e., balloon-based four electrodes, spiral four electrodes, and single electrode) to mimic RFA. Three RF applicators were used for the renal artery in the same manner. The difference is that the spiral or balloon-based catheters can expand based on the artery size and release four electrodes to achieve the full ablation of the renal artery. To analyze the ablation characteristics of different RF generators, we compared the therapeutic effect of the three generator designs based on the same treatment parameters. Subsequently, the ablation effect of each generator was obtained using clinically visible power protocols. The three-dimensional heat distribution was obtained to visualize the therapeutic effect and enrich the measurement data of the coagulation zone. The effect of different treatment strategies can be determined in advance to facilitate clinicians in selecting the appropriate probe. Moreover, some experience has been gained regarding the application of computer simulations and should therefore be applied to assist in the structural design of generators.
Methods
Geometric model in simulation
In this study, SolidWorks software (Dassault Systemes, Waltham, MA, USA) was used to establish geometric models of different RF systems and renal arteries. Subsequently, multi-field coupling calculation was performed using COMSOL Multiphysics software (COMSOL, Burlington MA, USA). shows a schematic diagram of the RFA of the renal artery (using a spiral multielectrode as an example). The main renal artery had an inner diameter of 5 mm and a wall thickness of 1 mm [Citation23]. The branch artery diameter was 3.5 mm, and the bifurcation angle was ∼50°. The RF electrode models and their sizes are shown comprehensively in and , respectively [Citation7,Citation24,Citation25]. The material properties of the entire model are listed in [Citation17,Citation26,Citation27].
Figure 1. A 3 D renal artery and surrounding tissue model.
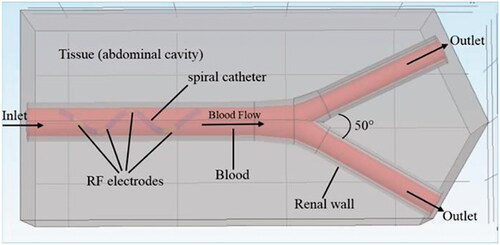
Figure 2. Electrode structure diagrams of three different RF applicators.
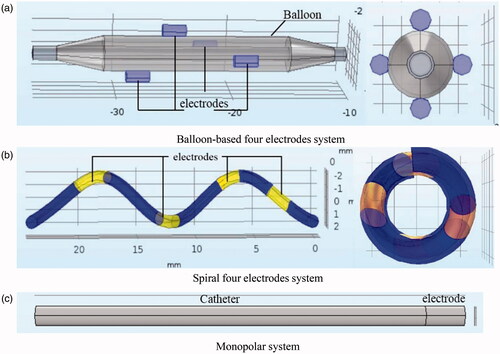
Table 1. The electrode sizes with three-electrode configurations [Citation7,Citation24,Citation25].
Table 2. The thermo-electric and fluid properties [Citation17,Citation26,Citation27].
Mathematical model
In the model, the blood flow in the renal artery was considered to be a laminar fluid flow. The thermal effect in the tissue was regarded as a coupled heat flow problem. The incompressible Navier–Stokes equation combined with the biological heat transfer equation can be used to describe the heat transfer problem involving flow in the RDN process. The right side of EquationEquation (1)(1)
(1) contains the velocity term [Citation28] for calculating heat loss due to blood flow.
(1)
(1)
where cb is the specific heat capacity of blood (J/(kg. K)), T is the tissue temperature, (K), ρ is the density (kg/m3), k is the thermal conductivity (W/(m. K)), t the time, (s),
is the blood velocity vector (m/s), Qr is the heat source generated by RF power (W/m3), Qp is the heat loss caused by microvascular perfusion (W/m3), and Qm is the heat energy generated by the tissue metabolic process. Qm is negligible because the metabolic heat source is extremely small during an RFA compared with the other terms [Citation29]. Because the RF electrode is attached closely to the artery wall during RDN, the main RF energy is concentrated in the renal arteries. Therefore, Qp is negligible [Citation30].
As blood flow was investigated in this study, incompressible Navier–Stokes equations were used. The equations comprise the mass conservation equation (EquationEquation (2)(2)
(2) ), momentum conservation equation (EquationEquation (3)
(3)
(3) ), and energy conservation equation (EquationEquation 4
(4)
(4) ) [Citation17,Citation31].
(2)
(2)
(3)
(3)
(4)
(4)
where P is the pressure (Pa), ρ is the density of the fluid (kg/m3), I is the normal stress, (N), μ is the dynamic viscosity of the blood (Pa·s), c is the specific heat capacity of the liquid (J/(kg·K)), Sr is the volumetric heat source (W/m3), and F is the volume force vector (N/m3), which was absent in the numerical model.
The simulated RFA was performed in a low-frequency (470 kHz) electromagnetic field. The RF heat source Qr was calculated using EquationEquation (5)(5)
(5) , where σ (T) is the electrical conductivity (S/m). The magnitude of the vector electric field E is calculated using
where
is the voltage (V). The voltage is obtained by solving the Laplace equation show in EquationEquation (6)
(6)
(6) , which is the governing equation for electrical problems [Citation28].
(5)
(5)
(6)
(6)
Boundary and initial conditions
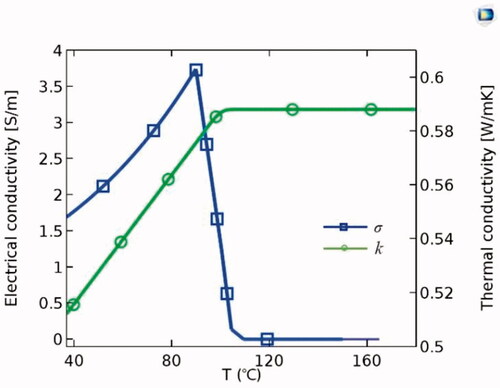
In the entire model, all the outer surfaces of the tissue were grounded with zero current density. The initial potential was set to 0 V, and constant powers [Citation12,Citation15] of 4, 6, and 8 W were applied to the monopolar [Citation24], spiral-based [Citation32], and balloon-based applicators, respectively, for 60 s. shows the thermal and blood flow boundary conditions. Blood flow in the renal artery was considered an incompressible Newtonian fluid. The no-slip condition was set for the arterial wall. The inlet velocity of the renal artery was set to 0.4 m/s based on the literature [Citation33], and the outlet pressure was 0 Pa. The initial temperature of the tissue was set to 37 °C. The thermal and electrical conductivities of the tissue were temperature-dependent piecewise functions [Citation34] (). The thermal conductivity (k) increased linearly below 100 °C at a growth rate of 0.12%/°C. When the temperature exceeded 100 °C, k remained constant. The electrical conductivity (σ) increased exponentially below 100 °C at a growth rate of 1.5%/°C. Subsequently, it was assumed that σ decreased by four orders of magnitude to model the tissue desiccation process [Citation28].
Figure 3. Thermal and fluid Boundary conditions.
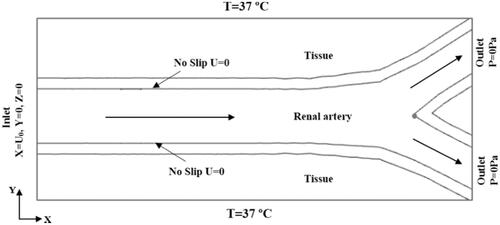
Figure 4. Temperature-dependent thermal and electrical conductivity.
Meshing settings
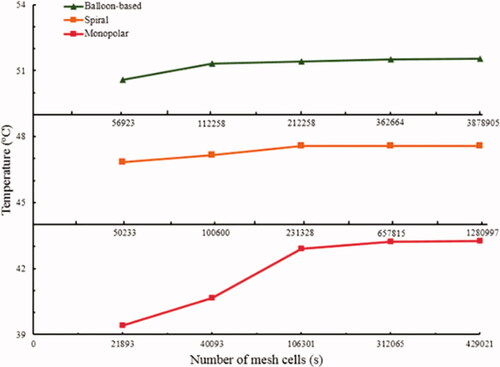
The models of the three RF applicators and the renal artery were partitioned using the tetrahedral mesh method and then solved using the finite element method. The time step was 1 s, and the initial time was 0.01 s. A grid independence study was performed to determine the optimal number of grids (). The grid numbers were 362,664, 657,815, and 312,065 for the balloon-based, spiral, and monopolar models, respectively. The corresponding average cell masses were 0.6632, 0.6698, and 0.6521 mm, respectively, whereas the minimum cell masses were 0.003241, 0.06648, and 0.01088 mm, respectively.
Figure 5. The tissue-electrode interface temperature curves with a number of mesh cells.
Assessment of lesion size in numerical model
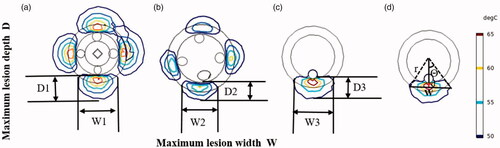
shows the circumferential ablation zone of the renal artery yielded by the three RF applicators. Temperatures exceeding 45 °C–50 °C resulted in irreversible nerve damage to neural tissues [Citation35]. Therefore, the maximum lesion depths (D1, D2, and D3) and widths (W1, W2, and W3) were defined as the maximum width of the 50 °C isotherms. We calculated the lesion angle for each RF application (using a monopolar-RDN as an example) using EquationEquation (7)(7)
(7) [Citation13] (). Accordingly, the arterial coverage rate was calculated using EquationEquation (8)
(8)
(8) .
(7)
(7)
where Lesion Angle is the lesion angle of each RF electrode application ( º), W is the maximum lesion width (mm), r is the vessel radius (mm), and d is the distance (i.e., d1 = 0.75 mm, d2 = 0.59 mm, and d3 = 0.5 mm at P = 8W) between the maximum lesion width and artery lumen (mm).
(8)
(8)
where Coverage Rate is the circumferential coverage rate of each RF lesion (%). Both the spiral and balloon-based applicators contained four electrodes, and the calculated total lesion angle must be magnified by four times.
Figure 6. Illustration of lesion size using the different applicators. (a) Balloon-based RDN, (b) spiral RDN, (c) Monopolar-RDN, and (d) Lesion angle.
Validation of numerical simulation
To validate the reliability of the simulation results, monopolar RF ablation was performed in a renal artery phantom model. The temperature field of the gel was compared with that of the simulated temperature field.
Polyvinyl alcohol hydrogel (PVA-H) phantom renal artery model
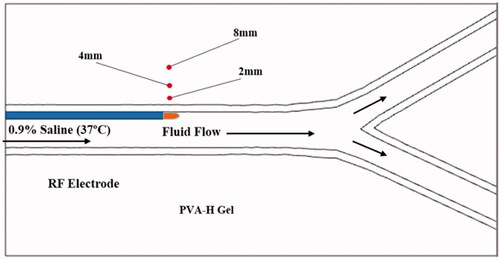
PVA-H was used to simulate biological tissues owing to its uniform electrical and thermal properties, good transparency, and low surface friction [Citation36]. Detailed preparation methods and the availability of PVA-H are described in our previous study [Citation19]. The renal artery in the experiment comprised the main vessel and two branch vessels, which is consistent with the simulated model. However, the real artery diameter was small, which rendered it difficult to observe the temperature field. Therefore, we enlarged the original model size based on the principle of fluid flow similarity. The main vessel diameter was 10 mm, and the branch diameter was 7.5 mm. The completed PVA-H gel was a 14 mm × 6 mm × 10 mm cuboid with an arterial channel (see ).
Figure 7. Schematic diagram in a renal artery phantom ablation.
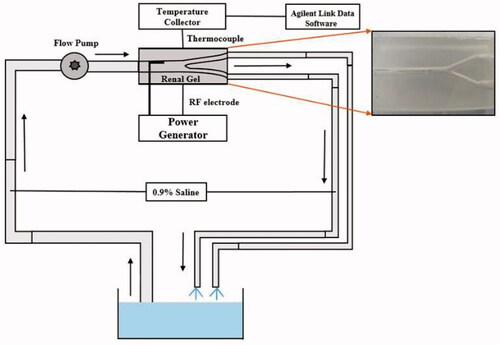
Open-loop blood circulation platform
An open-loop circulation system was established to stimulate blood flow (). A 0.9% saline was driven using a BT600L-CE peristaltic pump (LEAD FLUID Inc., Hebei, China) to the renal artery phantom. During the experiment, a constant-temperature water bath was used to maintain the liquid temperature at 37 °C. The flow in the experiment was based on the principle of hydrodynamic similarity [Citation37]. The simulated velocity was 0.4 m/s, and the Reynolds number calculated using EquationEquation (9)(9)
(9) was 600. Therefore, the corresponding velocity used in the phantom model was 0.06 m/s. Using EquationEquation (10)
(10)
(10) , a volume flow of 280 ml/min was obtained.
(9)
(9)
(10)
(10)
The subscripts e and m point to experimental and simulated variables, respectively. Where ρ is the density (kg/m3), v is the velocity (m/s), d is the diameter, is the dynamic viscosity of the liquid (Pa
s), Q is the flow rate (L/min), and A is the cross-sectional area (m2). The density of the 0.9% normal saline was 1,005 kg/m3, and its dynamic viscosity was 1.0 × 10˗3 Pa/s. Data of tissue temperature during ablation were acquired using thermocouples and then stored in a 34972a temperature data acquisition instrument (Agilent Technologies Inc., Beijing, China).
RFA in PVA-H phantom
The temperature field is an important index for evaluating the effects of RFA. The thermocouples were calibrated before the experiment, and their arrangements are shown in . The distances of these thermocouples from the vessel wall to the tissue were 2, 4, and 8 mm. The insertion depth was consistent with the plane of the electrode tip. An XJ-03RF monopolar RDN device (Xijie Medical Co., Xian, China) was used to output a constant power of 8 W in the phantom ablations. The electrode was guided into the main vessel from the inlet and then ablated along the vessel wall for 60–120 s. After one ablation, the tissue was allowed to cool to 37 °C before the next ablation was performed. This experiment was repeated five times for each gel. The temperature curves represent the average temperatures.
Figure 8. Schematic diagram of thermocouples arrangement.
Results
Comparison of lesion size under same power
shows the longitudinal temperature distribution along the renal artery for the three applicators. shows that the lesion width and depth of all three systems increased with time. The growth rate was the highest in the first 10 s. After heating for 60 s, the maximum lesion depths were 3.11, 1.81, and 2.38 mm for the balloon-based, spiral and monopolar RFAs, respectively. The balloon-based method formed a larger lesion depth and width compared with the monopolar and spiral methods at 60 s. The spiral device indicated the lowest lesion depth. The maximum lesion depth of the monopolar ablation differed slightly from that of the spiral ablation before 20 s, whereas it was higher than that at 20–60 s. The lesion width of the monopolar RDN was larger than that of the spiral RDN, and the values differed by 1.05, 1.51, and 1.77 mm at 20, 40, and 60 s, respectively. shows the circumferential thermal distribution for the three RF applicators. The corresponding circumferential coverage rates of the renal artery are shown in .
Figure 9. Temperature distribution in tissue using different RF applicators. (a) The balloon-based system, (b) spiral system, (c) monopolar system.
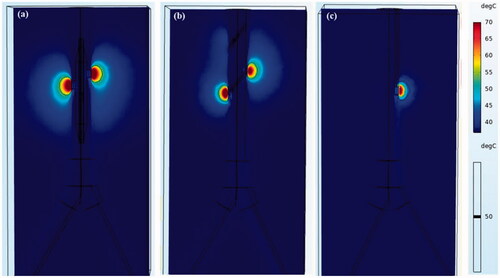
Figure 10. Maximum lesion depth and width curves of three applicators with heating time. D: Maximum lesion depth; W: Maximum lesion width. (D1, W1: for balloon-based RDN. D2, W2: for spiral RDN. D3, W3: for monopolar RDN).
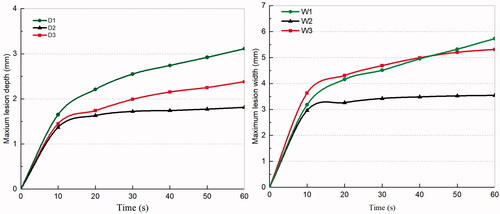
Figure 11. Temperature field in the short-cross section after RDN for three applicators (P = 8W) (a) balloon-based system, (b) spiral system, (c) monopolar system.
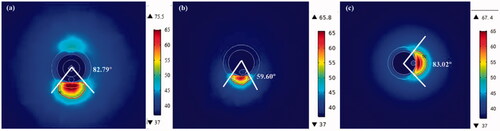
Table 3. Lesion size after RDN for three different applicators (P = 8W).
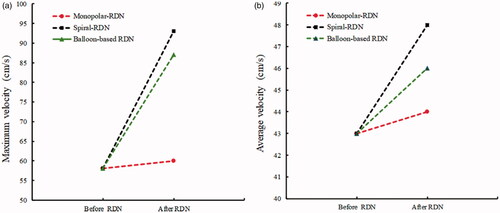
shows the changes in the tissue–electrode interface temperature with time. All the interface temperatures increased rapidly to a higher temperature in the first 10 s and reached a stable temperature after ∼20 s. The peak temperature for the balloon-based model was the highest at 51.53 °C, followed by that of the spiral model at 46.84 °C, and the monopolar model at 43.24 °C. shows the velocity distribution and effective ablation zone. The velocity distributions of the spiral RDN and balloon-based RDN exhibited the most significant changes compared with that of the normal blood flow. Therefore, we obtained the average and maximum velocities before and after denervation for the three RF applicators (). The average velocity after balloon-based, spiral, and monopolar RDN increased by 3, 5, and 1 cm/s, respectively, whereas the maximum velocity increased by 19, 35, and 2 cm/s, respectively.
Figure 12. Temperature curves of the tissue-electrode interface.
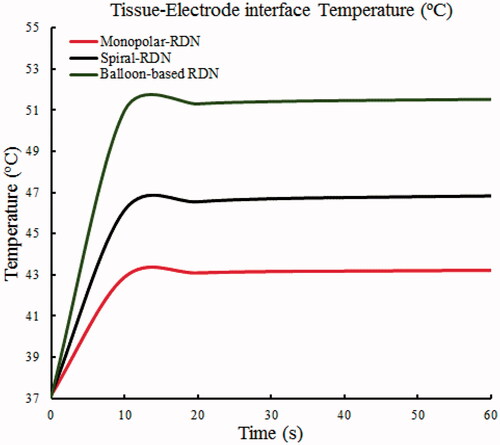
Figure 13. The velocity and lesion zone distribution of renal artery before and after RDN. (a) Before RDN, (b) Balloon-based RDN, (c) Spiral-RDN, (d) Monopolar-RDN.
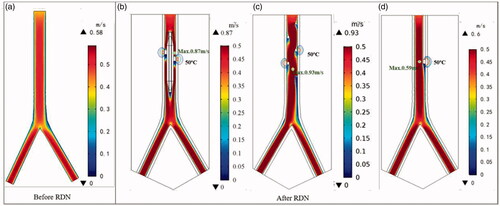
Figure 14. The blood velocity change after RDN with different electrodes. (a) Peak velocity (b) average velocity.
Lesion size for three heating patterns at different powers
The formation of lesions increased with the power applied (). In the clinically visible power range of 4–8 W, when using the balloon-based applicator, the lesion depth range was 1.58–3.11 mm, the maximum lesion width was 2.22–5.73 mm, and the coverage rate was 41.43%–91.99%. When using the spiral applicator, the lesion depth range was 0.90–1.81 mm, the maximum lesion width was 1.48–3.54 mm, and the coverage rate was 31.71%–66.23%. When using the monopolar applicator, the lesion depth range was 1.12–2.38 mm, the maximum lesion width was 1.93–5.31 mm, and the coverage rate was 9.55%–23.06%.
Table 4. Coagulation zone information for each applicator design.
In vitro experiments results
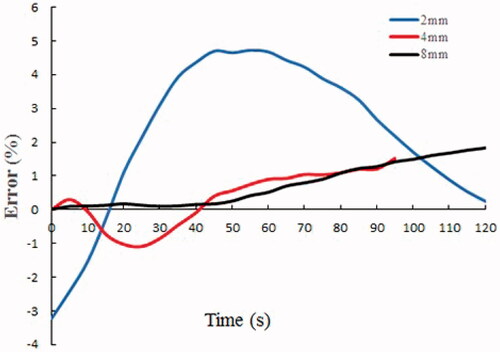
shows the temperature changes based on the experiment and simulation models at different locations in the phantom gel. For the 2 mm location, the maximum temperature difference between the experiment and simulation was 2.23 °C, and the corresponding relative error was 4.74%; for the 4 mm location, the maximum temperature difference was 0.69 °C, and the relative error was 1.52%; for the 8 mm location, the maximum temperature difference was 0.74 °C, and the relative error was 1.82%. The computer model offered prediction errors were <5% in terms of temperature around the electrode (). In addition, the mean error of the 2 mm location in the tissue was the largest, and the farther away from the electrode, the smaller was the mean error.
Figure 15. Comparison of experimental and simulated temperature curves.
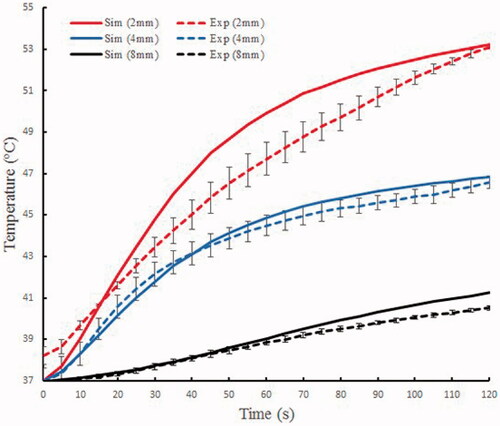
Figure 16. The error curves of the experiment and simulation.
Discussions
The ablation characteristics of three RF applicators, i.e., balloon-based four electrodes, four spiral electrodes, and monopolar systems, were compared in this study. The numerical results showed that the lesion depth and width were the largest in the balloon ablation and the smallest in the spiral approach under the same power. The maximum lesion depth in unipolar ablation was lower than that in the balloon-based ablation and higher than that in the spiral ablation, whereas the width was slightly smaller than that of the balloon ablation (). The formation of lesions was affected by several factors, including ablation power, ablation duration, electrode size, electrode area in contact with tissue, contact force, and blood flow. Balloon-based RDN occluded the renal artery, thereby reducing the effect of blood cooling and heat loss, resulting in larger lesion depths [Citation19,Citation38]. Because the four electrodes were not in the same plane, a small amount of blood can flow out. However, whether this treatment increases the risk of thrombosis is yet to be elucidated. Therefore, we will investigate the possibility of thrombosis and other phenomena occurring through PIV or in vivo experiments in our next study. Both the spiral and monopolar RDN were exposed to a significant amount of blood, and the blood flow dissipated some heat. By contrast, the spiral catheter is curved, resulting in a smaller electrode area in contact with the tissue. In addition, the total lesion area and angle of the balloon-based and spiral RDN were larger than those of the unipolar RDN ( and ) as they contained more (i.e., four) electrodes. The lesion depth and width generated using spiral catheter have been reported to be 2–3 and 3–7 mm, respectively [Citation12,Citation13,Citation39], with a lesion area of 21.9 mm2 [Citation39]. AI Raisi et al. [Citation13] reported a circumferential coverage angle per ablation of 54.90°±4.36°, which encompassed 15% of the arterial wall circumference, for a single-electrode RF application. In this study, for the spiral RDN, the lesion depth range was 0.90–1.81 mm; maximum lesion width, 1.48–3.54 mm; lesion angle per ablation, 59.60°; and circumferential coverage rate, 66.23%. When the monopolar device was used, the lesion angle was 83.01°, and the corresponding coverage rate was 23.06%. This difference may be due to the different electrode sizes or contact forces.
It is noteworthy that if the temperature is >100 °C, then an intramural gas bubble forms within the vessel wall. If excessive heating occurs, the vessel expands and finally results in renal artery rupture and possible retroperitoneal hemorrhage [Citation40]. Therefore, to reduce this risk, the electrode temperature of most RF generators is limited to <70 °C [Citation24,Citation32]. The simulation results show that the electrode-tissue interface temperature for the three-electrode models did not reach this threshold (). They increased rapidly to a higher temperature before 10 s and reached a stable temperature after ∼20 s. This is attributable to the rapid heating of the electrode. After 10 s, the energy generated by the current density was transferred to the tissue through heat conduction.
The spiral catheter is a flexible catheter that is distributed in four quadrants in a helical shape after being released into the renal artery. Subsequently, the generator activates the electrodes simultaneously or sequentially to perform ablation on the upper, lower, anterior, and posterior sides. Although this method does not obstruct blood, it may cause a more severe blood flow disorder (). The placement of the spiral electrode caused the blood to flow spirally along the catheter, thereby causing an increased effect of the average velocity after ablation compared with other electrode designs. The balloon-based catheter, which is flexible and controllable, forms an obstruction in the renal artery. After the balloon was placed into the renal artery, the normal blood flow was obstructed, the maximum velocity appeared at the front end of the electrode. Because the four electrodes were not in the same plane, a small amount of blood flow out, which may reduce the degree of renal artery stenosis. However, it was evident that the two applicators imposed a greater effect on the flow rate than the monopolar ablation (). The change in flow velocity after ablation is primarily related to the structure of the applicator. The structure of a single electrode is simple, and the change in blood flow during ablation is slight. In all the ablation models, a minimum velocity value appeared at the back end of the electrode, which is associated with the direction of blood flow around the catheter. The flow velocity exhibited an increasing trend [Citation41,Citation42]. Therefore, the possible complications of spiral and balloon-based RDN in clinical practice should be prioritized.
Further, we performed unipolar ablation in a renal artery phantom to validate the reliability of the simulation method. The temperature error curves of the three thermocouples exhibited a relatively consistent trend with the simulation. To some extent, the experiment and simulation exhibited consistency. It was also discovered that the heat deposition in the tissue within 2 mm was much greater than that in a deeper position, which may result in a higher temperature at 2 mm than at other positions.
These results indicate that, from the perspective of lesion size, balloon-based RDN appeared to be the best option. However, the velocity change after ablation in the flow field was significant. Whether this will cause posterior artery stenosis should be investigated in terms of hemodynamics to determine its safety. The flow field in the renal artery after monopolar ablation changed the least, and the lesion depth and width were higher than those of spiral ablation. However, the total ablation area and coverage rate were less than those of the spiral ablation. In other words, the monopolar ablation needs to be repeated many times to achieve the same coverage angle as the spiral method. To avoid a complicated operation, spiral RDN can be employed, and the change in the flow field should be monitored in real-time. In fact, each electrode design has an optimal power application protocol. To observe the therapeutic effect of each generator design, we obtained their coagulation zone information pertaining to the clinically visible application power, which provided some guidance when performing the numerical simulation to assist in the structural design of the generator.
However, our preliminary research has some limitations. First, the three RF applicators and the renal artery were simplified models. The electrode spacing for a balloon-based model may be variable, and the catheter sizes of the three generators varied from 4 to 8 Fr. The contact force between the electrode and tissue was not considered in our model. Second, only a slight temperature error occurred between the experimental and simulation results, which demonstrates the feasibility of the simulation method. However, only monopolar denervation in the phantom gel was performed owing to the limitations of various conditions. Simulations for the other two electrode models have not been validated. Because only the temperature at different positions was used to validate the simulation method, the lesion size should be investigated in future studies. Finally, only three samples were used for the experiment, which might be insufficient. However, we believe that the numerical simulation offers certain reliability and can be used to achieve an auxiliary ablation effect. In addition, PIV experiments or clinical trials to determine hemodynamic changes should be further investigated.
Conclusions
The balloon-based system yielded a greater lesion depth and width compared with the spiral and monopolar RF applications under the same setting. In terms of lesion size, the balloon-based RDN appears to be the best option for the treatment of RH. However, the change in flow velocity in the arterial flow field suggests that researchers should focus on the hemodynamic changes for investigating its safety. Although spiral catheter ablation yielded the smallest lesion size and significant changes in flow velocity in the flow field, the total ablation area and coverage rate were larger than that of monopolar RDN. In addition, compared with balloon-based RDN, spiral ablation did not obstruct most of the blood flow, thereby preventing post-arterial stenosis to some degree. To avoid a complicated operation, the spiral or balloon-based applicator can be employed; however, the change in the flow field must be monitored in real-time. The numerical simulation predicts the temperature field during RDN in advance, shortened the design cycle, and reduced the associated costs.
Disclosure statement
No potential conflict of interest was reported by the author(s).
Additional information
Funding
References
- Hiremath S, Sapir-Pichhadze R, Nakhla M, et al. Hypertension Canada's 2020 evidence review and guidelines for the management of resistant hypertension. Canadian J Cardiol. 2020;36(5):625–634.
- Daugherty SL, Powers JD, Magid DJ, et al. Incidence and prognosis of resistant hypertension in hypertensive patients. Circulation. 2012;125(13):1635–1642.
- Khawaja Z, Wilcox CS. Role of the kidneys in resistant hypertension. Int J Hypertens. 2011;2011:1–8.
- Smithwick RH, Thompson JE. Splanchnicectomy for essential hypertension: results in 1,266 cases. JAMA. 1953;152(16):1501–1504.
- Gulati R, Raphael CE, Negoita M, et al. The rise, fall, and possible resurrection of renal denervation. Nat Rev Cardiol. 2016;13(4):238–244.
- Esler M. Illusions of truths in the symplicity HTN-3 trial: generic design strengths but neuroscience failings. J Am Soc Hypertens. 2014;8(8):593–598.
- Ai Raisi SI, Pouliopoulos J, Swinnenc J, et al. Renal artery denervation in resistant hypertension: the good, the bad and the future. Heart, Lung Circulation. 2020;29(1):94–101.
- Akinseye OA, Ralston WF, Johnson KC, et al. Renal sympathetic denervation: a comprehensive review. Curr Probl Cardiol. 2021;46(3):100598.
- Sievert H, Schofer J, Ormiston J, et al. Bipolar radiofrequency renal denervation with the vessix catheter in patients with resistant hypertension: 2-year results from the REDUCE-HTN trial. J Hum Hypertens. 2017;31(5):366–368.
- Gan Q, Qu XK, Gong KZ, et al. Efficacy and safety of a novel multi-electrode radiofrequency ablation catheter for renal sympathetic denervation in pigs. J Geriatr Cardiol. 2015;12(6):618–625.
- Sakaoka A, Rousselle SD, Hagiwara H, et al. Safety of catheter-based radiofrequency renal denervation on branch renal arteries in a porcine model. Catheter Cardiovasc Interv. 2019;93(3):494–502.
- Ai Raisi SI, Barry MT, Qian P, et al. Comparison of new-generation renal artery denervation systems: assessing lesion size and thermodynamics using a thermochromic liquid crystal phantom model. Eurointervention. 2017;13(10):1242–1247.
- Ai Raisi SI, Pouliopoulos J, Barry MT, et al. Renal artery branch denervation: evaluation of lesion characteristics using a thermochromic liquid crystal phantom model. Heart Lung Circ. 2020;29(3):445–451.
- Ai Raisi SI, Pouliopoulos J, Qian P, et al. Comparison of two different radiofrequency ablation systems for renal artery denervation: evaluation of short-term and long-term follow up. Catheter Cardiovasc Interv. 2019;93(3):E105–E111.
- Ai Raisi SI, Pouliopoulos J, Barry MT, et al. Evaluation of lesion and thermodynamic characteristics of Symplicity and EnligHTN renal denervation systems in a phantom renal artery model. Eurointervention. 2014;10(2):277–284.
- Guo XM, Zhai F, Nan Q. The temperature field simulation of radiofrequency catheter-based renal sympathetic denervation for resistant hypertension. Biomed Mater Eng. 2014;24(1):315–321.
- Dong T, Nan Q, Tian Z, et al. Radiofrequency ablation of renal sympathetic nerve: numerical simulation and ex vivo experiments. Adv Mech Eng. 2018;10(6):1–11.
- Jinhwan B, Hwanik K, Sangyong L, et al. Laparoscopic ablation system for complete circumferential renal sympathetic denervation. IEEE Trans Biomed Eng. 2021;PP:1–11.
- Liu HX, Cheng YY, Tian Z, et al. Flow field study of radiofrequency ablation of renal sympathetic nerve: numerical simulation and PIV experiments. Electromagn Biol Med. 2020;39(4):262–272.
- Whitbourn R, Harding SA, Walton A. Symplicity multi-electrode radiofrequency renal denervation system feasibility study. EuroIntervention. 2015;11(1):104–109.
- Sievert H, Schofer J, Ormiston J, et al. Renal denervation with a percutaneous bipolar radiofrequency balloon catheter in patients with resistant hypertension: 6-month results from the REDUCE-HTN clinical study. EuroIntervention. 2015;10(11):1213–1220.
- Ormiston JA, Watson T, van Pelt N, et al. First-in-human use of the OneShot™ renal denervation system from covidien. EuroIntervention. 2013;8(9):1090–1094.
- Sakakura K, Ladich E, Cheng Q, et al. Anatomic assessment of sympathetic peri-arterial renal nerves in man. J Am Coll Cardiol. 2014;64(7):635–643.
- Patel HC, Dhillon PS, Mahfoud F, et al. The biophysics of renal sympathetic denervation using radiofrequency energy. Clin Res Cardiol. 2014;103(5):337–344.
- Cohen-Mazor M, Mathur P, Stanley JRL, et al. Evaluation of renal nerve morphological changes and norepinephrine levels following treatment with novel bipolar radiofrequency delivery systems in a porcine model. J Hypertens. 2014;32(8):1678–1692.
- González-Suárez A, D'Avila A, Pérez JJ, et al. Thermal impact of balloon occlusion of the coronary sinus during mitral isthmus radiofrequency ablation: an in-silico study. Int J Hyperth. 2019;36(1):1167–1177.
- Ye E, Baik J, Lee S, et al. Design and simulation of novel laparoscopic renal denervation system: a feasibility study. Int J Hyperth. 2018;35(1):9–18.
- González-Suárez A, Berjano E. Comparative analysis of different methods of modeling the thermal effect of circulating blood flow during RF cardiac ablation. IEEE Trans Biomed Eng. 2016;63(2):250–259.
- Labonte S. Numerical model for radiofrequency ablation of the endocardium and its experimental validation. IEEE Trans Biomed Eng. 1994;41(2):108–115.
- Tang PH. Research on bipolar radio frequency ablation system with cooling for resistant hypertension. Tianjin: Tianjin University of Commerce; 2014.
- Bergman TL, Lavine AS, Incropera FP, et al. Fundamentals of heat and mass transfer. 6th ed. Hoboken (NJ): Wiley; 2006.
- Sakaoka A, Terao H, Nakamura S, et al. Accurate depth of radiofrequency-induced lesions in renal sympathetic denervation based on a fine histological sectioning approach in a porcine model. Circ Cardiovasc Interv. 2018;11(2):1–8.
- Wolf RL, King BF, Torres VE, et al. Measurement of normal renal artery blood flow: cine phase-contrast MR imaging vs clearance of p-aminohippurate. Am J Roentgenol. 1993;161(5):995–1002.
- Trujillo M, Berjano E. Review of the mathematical functions used to model the temperature dependence of electrical and thermal conductivities of biological tissue in radiofrequency ablation. Int J Hyperthermia. 2013;29(6):590–597.
- Cosman ER. Radiofrequency lesions. Textbook of stereotactic and functional neurosurgery. Berlin Heidelberg: Springer; 2009.
- Ohta M, Handa A, Iwata H, et al. Poly-vinyl alcohol hydrogel vascular models for in vitro aneurysm simulations: the key to low friction surfaces. Technol Health Care. 2004;12(3):225–233.
- Long TY. Fluid mechanics. 2nd ed. China: China Building Industry Press; 2013.
- Jain MK, Wolf PD. A three-dimensional finite element model of radiofrequency ablation with blood flow and its experimental validation. Ann Biomed Eng. 2000;28(9):1075–1084.
- Mahfoud F, Ewen S, Böhm M, et al. Comparison of branch and distally focused main renal artery denervation using two different radio-frequency systems in a porcine model]. Int J Cardiol. 2017;241(15):373–378.
- Eick OJ, Gerritse B, Schumacher B. Popping phenomena in temperature-controlled radiofrequency ablation: when and why do they occur?. pace. Pacing Clin Electro. 2000;23(2):253–258.
- Tsioufis C, Papademetriou V, Dimitriadis K, et al. Catheter-based renal sympathetic denervation exerts acute and chronic effects on renal hemodynamics in swine. Int J Cardiol. 2013;168(2):987–992.
- Verloop WL, Hubens LEG, Spiering W, et al. The effects of renal denervation on renal hemodynamics and renal vasculature in a porcine model. PLOS One. 2015;10(11):e0141609.