
 ?Mathematical formulae have been encoded as MathML and are displayed in this HTML version using MathJax in order to improve their display. Uncheck the box to turn MathJax off. This feature requires Javascript. Click on a formula to zoom.
Abstract
Introduction
The radiofrequency ablation (RFA) of liver cancer is a desirable treatment option, as it is minimally invasive. An accurate numerical simulation can greatly help physicians better plan their surgical protocols. Previously, the displacement current in the RFA process was considered negligible, and therefore RFA simulation was modeled as a direct current (DC) system instead of an alternating current (AC) system. Our study investigated the hypothesis that the displacement current in the RFA process should not always be considered negligible.
Methods
AC measurements of ex vivo bovine liver ablation were performed, and numerical simulations were also conducted to test the hypothesis that the relative permittivity would significantly decrease after the liver tissue reached a high temperature.
Results
The displacement current was observed to be a sizable fraction of the conduction current, especially before the onset of the first pause. The simulation results indicated that the relative permittivity is likely to decrease to several hundred or lower at elevated temperatures.
Conclusions
Our study results suggest that the DC model may be inadequate, especially before the first roll-off and that additional information could be available during RFA treatment by considering the AC nature of RFA, which could lead to improved numerical simulation. Additional measurements of tissue parameters are needed to reach the full potential of the AC model for further development of ablation control.
Introduction
Radiofrequency ablation (RFA) has been a favorable method of tumor treatment owing to its minimally invasive nature. Because the RFA mechanism depends on the conduction of electric current through tissue and the electrical conductivity of tissue decreases significantly when the temperature is very high, it is crucial to implement an effective control mechanism to prevent excessive local heating so that the tumor region can be sufficiently ablated [Citation1–3]. Common control mechanisms include monitoring the output impedance and reading temperature probes [Citation2–6]. On the other hand, an accurate numerical simulation of RFA procedures can also benefit the design, testing, and evaluation of control mechanisms, thereby greatly aiding physicians in their surgical planning [Citation1].
In previous studies, the simulation of RFA around 500 kHz was implemented by ignoring the displacement current, and the overall system was treated like a direct current (DC) circuit governed by electrostatic equations. The tissue was considered to be purely resistive [Citation1,Citation4,Citation5,Citation7,Citation8]. It has been argued that at ∼500 kHz the wavelength is much longer than the liver, and the displacement current can be neglected according to liver tissue properties. The former argument means that the phase delay of RF signals within the liver can be reasonably ignored, so the liver can be treated like a lumped circuit element rather than a waveguide. Numerically, at 37 °C, the relative permittivity (unitless; also known as the dielectric constant) of the human liver is ∼2860 at 480 kHz [Citation9], and therefore the RF wavelength is ∼11.7 m, and indeed much larger than the liver. On the other hand, the alternating current (AC) density can be expressed as
(1)
(1)
where
is the electrical conductivity,
is the electric field,
is the conduction current density,
is the displacement current density,
is the angular frequency,
is the electric displacement field,
is the vacuum permittivity,
is the relative permittivity,
is the loss angle, and
is the loss tangent. In comparison, the DC current density is simply
because no displacement current is involved. The loss tangent is a metric value between the resistive (lossy) and the reactive (lossless) components of the AC electric field, and with
S/m and
for human liver at 37 °C [Citation9], the inverse of the loss tangent can be calculated as ∼0.52, so the displacement current is actually about one-half of the conduction current and should not be neglected.
In this study, the AC components in ex vivo bovine liver RFA were measured, and test models were constructed to simulate the AC ablation process. The results indicated that the displacement current indeed played a role in the RFA process at 480 kHz, and the AC model has the potential for providing additional information during the RFA procedure, enabling new mechanisms of RFA output control, and implementing a more complete numerical simulation model.
Materials and methods
Experimental configurations of bovine liver ablation
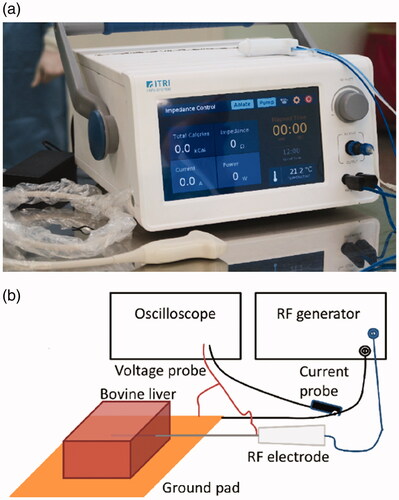
The RFA probe and the RF generator for the experiments were both developed in our laboratory; technical notes for the equipment can be found in the supporting information. The RFA probe was 17-gauge in size with an internal cooling chamber and an active length of 2 cm, and the RF generator, shown in , provided a sinusoidal wave at 480 kHz and used an embedded algorithm for impedance control. The experiments were performed on fresh, never-frozen ex vivo bovine livers that were ∼ cm3 in size and were allowed to reach 20 ± 1 °C before each experiment. The ground pad was positioned below the liver tissue, as shown in the schematic diagram of . The RF generator was set to deliver 40 VA (volt-ampere, which is dimensionally equivalent to a watt) of power at the beginning, and the ablation time was set to 12 min. The RF voltage
total RF current
and total impedance
were constantly monitored by the RF generator; when the total impedance exceeded the initial value by ∼5%, the RF energy output was paused for 15 s. A thermocouple was implemented within the RFA probe for monitoring the needle temperature to ensure that the internal water cooling (set at 10 °C) was functional. An oscilloscope (Tektronix DSO 5204) with its voltage and current probes (part numbers TPP1000 and TCP0020, respectively) was connected to the RFA probe cables, as shown in to continuously resolve the instantaneous phase difference between the voltage and the current waveforms. The details of the verification experiments for the phase measurements can be found in the supporting information. After the ablation was completed, the tissue was sliced open along the direction of probe insertion for optical inspection and photography to ensure there was indeed tissue necrosis, and the lesion sizes were measured with a ruler (1 mm resolution).
Figure 1. (A) RF generator developed in our laboratory that was used for the ex vivo bovine liver experiments, and (B) schematic diagram of the experimental setup for bovine liver ablation.
Simulation using finite element method
The finite element method (FEM) simulation was performed with COMSOL Multiphysics software (Burlington, MA, U.S.A.). To exploit the symmetry of the RFA probe, a 2 D cylindrically symmetric model was constructed, and liver tissue was modeled as a cylinder 14 cm in diameter and 15 cm in height. The actual dimensions of our 17-gauge RFA probe as shown in the schematic representation of were modeled. The material properties were set as shown in . The exposed probe tip was set as the electric terminal; the sidewalls of the liver tissue were set as the ground to simulate the ground pad, as shown in , following the approaches of Macchi et al. and Yero et al. [Citation7,Citation10].
Figure 2. Schematic representation of the simulation model (not drawn to scale; unit: mm).
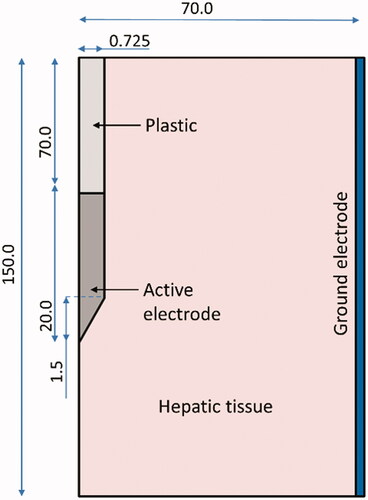
Table 1. Material properties used in the simulation model of the RFA probe.
The heating of hepatic tissue due to RF ablation was modeled by Penne’s bioheat equation [Citation1–3,Citation8,Citation10,Citation11]:
(2)
(2)
where
is the density,
is the specific heat,
is the temperature,
is the time,
is the thermal conductivity,
is the current density, and
is the electric field. The blood perfusion term,
and the metabolic heat generation term,
were dropped for this ex vivo study [Citation2,Citation8]. The relationships between
and the applied voltage,
were governed by
EquationEquation (1)
(1)
(1) , and
which can be summarized as [Citation12]
(3)
(3)
Because no comprehensive data for electrical and thermal conductivities for ex vivo bovine liver were available for the temperature range from 20 to 100+°C, and Trujillo et al. had already demonstrated that different methods of modeling these two parameters did not yield significant variations in the results [Citation13], experimental values for similar tissue or other models were used here instead. The density of the liver tissue was set to 1079 kg/m3 [Citation3], and the thermal conductivity in was modeled as follows [Citation14]:
(4)
(4)
The electrical conductivity in S/m was also modeled as a temperature-dependent curve [Citation3]; the same curve was used by Arenas et al. in a study that compared the experimental and simulation results of bovine hepatic tissue [Citation8], where
(5)
(5)
The latent heat of water evaporation was included. By considering the water content of the liver tissue, as well as the heat capacities of the liver, water, and steam [Citation3,Citation13], the overall curve of specific heat in was defined as
(6)
(6)
The initial temperature of the entire model was set to 20 °C, and the environmental temperature outside of the liver tissue was maintained at 20 °C during the simulation. The internal water cooling was set to 10 °C; to take into account the effect of flow rate, a flow-dependent model was adopted by treating the internal cooling water as a heat sink with a heat capacity of [Citation15]
(7)
(7)
where M is the mass flow rate, h is the specific heat of water, T0 is the set temperature of water cooling, T is the local temperature, and V is the total volume of water in the internal channel. To simulate the impedance control, an implicit event was set up in the COMSOL interface to monitor the total impedance. When the impedance increased beyond the initial value by ∼5%, the energy output was paused for 15 s.
To the best of the authors’ knowledge, the relative permittivity at 480 kHz of the bovine liver at different temperatures was not available in the literature, so estimates were made based on numerical data from the human and porcine liver because hepatic relative permittivity is similar among different species [Citation16]. The relative permittivity was first modeled as a fixed value of = 2860 at all temperatures for comparison. In terms of temperature-dependent models, however, most of the literature has focused on the frequency regime of the microwave, because in microwave ablation (MWA), relative permittivity plays an important role [Citation17,Citation18]. Furthermore, previous studies have shown that the relative permittivity of ex vivo porcine liver depends on the rate of heating in addition to temperature [Citation7,Citation11]. In the absence of sufficient and comprehensive data from the literature, a test model for temperature-dependent relative permittivity was constructed first by converting the curve of fast heating in , from Macchi et al. [Citation7] to numerical data using the software WebPlotDigitizer [Citation19]. The numerical data were then scaled such that
at 37 °C, which is the same value as human liver, because on a cellular level, bovine and human liver parenchyma are structurally similar [Citation20,Citation21]; this is one reason that bovine liver is commonly used for ex vivo RFA tests. In this model, the relative permittivity is reversible, and the value remains at ∼1445 above 100 °C. For additional comparison, a DC model was established with the same parameters and simulation procedures, except that the interface of the electric currents was set to DC. For all simulations, the output power was set to 40 VA or 40 W at the beginning.
Figure 3. Test models of ex vivo bovine liver relative permittivity for numerical simulation. Blue solid line: relative permittivity before reaching 100 °C; numerical values were adapted from Macchi et al. [Citation7] and the details can be found in the main text. Horizontal dashed lines: test values of relative permittivity once a domain unit reached 100 °C.
![Figure 3. Test models of ex vivo bovine liver relative permittivity for numerical simulation. Blue solid line: relative permittivity before reaching 100 °C; numerical values were adapted from Macchi et al. [Citation7] and the details can be found in the main text. Horizontal dashed lines: test values of relative permittivity once a domain unit reached 100 °C.](/cms/asset/416637ec-c515-4d21-9e84-9c814f457c2c/ihyt_a_1971779_f0003_c.jpg)
Two-curve models were constructed to test the hypothesis that the RF relative permittivity depends on whether the tissue is heating up or cooling down, which has already been shown to be the case for MWA [Citation17]. The temperature-dependent curve previously described, denoted as the forward curve here, was used when the tissue was heated from 20 to 100 °C, and it was assumed that if the tissue did not reach 100 °C before cooling down again, it would retrace the forward curve as the temperature decreased. Once the tissue reached 100 °C, however, the relative permittivity would drop to a lower value of 100, 200, 300, 600, 900, 1200, or 1445, and it would remain at this value thereafter, which is denoted as the backward curve here. The curves of the two-curve models are plotted in . It should be emphasized again here that the backward curve of a fixed value is intended here for numerical demonstration only, whereas the actual shape and transition region require additional measurements. In the COMSOL implementation, the interface of Domain ODEs and DAEs was included to set up a flag variable linked to the mesh so that its value would change from 0 to 1 when the local temperature reached 100 °C. When the relative permittivity of a mesh unit was needed, the value was retrieved from the forward curve if the flag variable value were 0; if the flag value were 1, the relative permittivity would be the value associated with the backward curve.
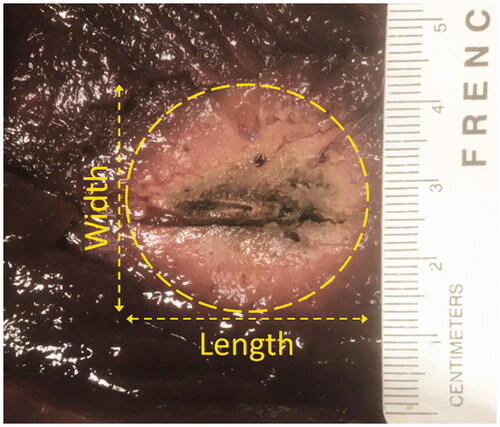
Figure 4. Example image showing the cross-section of necrosis after 12 min of ex vivo bovine liver ablation.
The Arrhenius damage model was used to calculate bovine liver necrosis as follows [Citation1,Citation3,Citation5,Citation7,Citation10,Citation13,Citation15]:
(8)
(8)
where
is the thermal damage parameter at time
s−1 is the frequency factor,
J/mol is the activation energy for irreversible tissue damage,
J/K-mol is the gas constant, and
is the local temperature at time
Inspired by Irastorza et al. and Ooi et al. [Citation3,Citation15], the necrosis was assessed here for
which corresponds to a 99% probability of hepatic cell death.
The model consisted of ∼2300 triangular elements and ∼1230 vertices. The mesh was heterogeneous, with elements of size ∼0.3 mm close to the probe and ∼5 mm near the model boundaries. Convergence tests were performed to ensure that the mesh is sufficiently small. The initial time step was ∼0.001 s, after which the time step was automatically controlled by COMSOL.
Results
Experimental data from bovine liver ablation
The ablation experimental results for bovine liver from three different animals were similar overall, although some aspects were not identical owing to the typical variability between biological samples, such as the time at which each pause onset took place. Therefore, the common features are discussed here, and one set of experimental results is shown in for illustration. According to previous reports in the literature, electrode polarization in biological tissues is no longer a significant component of impedance at around 480 kHz [Citation22–24]; in addition, our RFA system was designed and implemented to meet the requirements of substantial equivalence to FDA-approved RFA products on the market, including the materials and the configurations of electrodes, the measurement of impedance, the principles of impedance control, and so on. As a result, the researchers believed that the experimental data were mainly a result of the change in bovine liver tissue properties during ablation instead of electrode polarization.
Figure 5. Phase difference (blue line, left -axis) between the current and the voltage, as well as the inverse of the loss tangent (red line, right
-axis) during one ablation of ex vivo bovine liver.
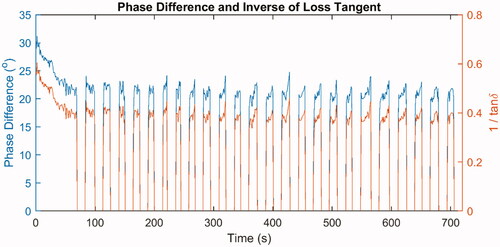
Figure 6. AC equivalent circuit model of liver tissue.
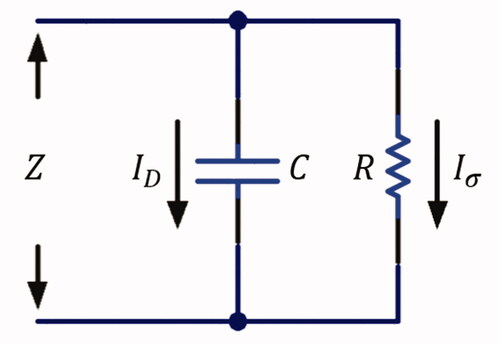
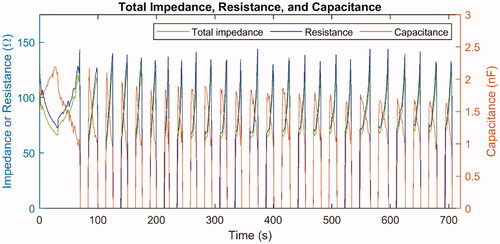
Figure 7. Total impedance (green line, left -axis) as well as the calculated values of resistance (blue line, left
-axis) and capacitance (red line, right
-axis) in the equivalent circuit model during one ablation of ex vivo bovine liver.
After 12 min of ablation, the lesion lengths were measured and were found to be an average of ∼31.2 mm with a standard deviation of ∼0.3 mm. The lesion widths were found to be an average of ∼28.2 mm with a standard deviation of ∼0.9 mm. One example lesion is shown in , in which the length is ∼30.9 mm and the width is ∼29.0 mm. Moreover, the phase difference was ∼28–30o at the beginning of the ablation, and it fell to ∼15–20o by the time of the first roll-off. The phase difference never recovered to the initial value, and eventually, it would reach values of ∼12–20o. The dataset of the experimental phase difference associated with , as well as the corresponding inverse of the loss tangent, are plotted in . Let and
denote the RF voltage and RF current at time
where
is the phase difference, and the inverse of the loss tangent can then be calculated as
because
It could be observed that the ratio between the displacement current and the conduction current was ∼0.4–0.6; therefore, the displacement current should not be considered negligible. As the liver tissue was heated above 100 °C, the electrical conductivity of the hot region decreased significantly; if the relative permittivity of the heated tissue remained large, the phase difference was expected to increase significantly as well, which was not the case. This justified setting the relative permittivity to a lower value once the tissue reached a high temperature in the numerical simulation.
depicts a schematic diagram showing that the liver tissue can be electrically modeled as a parallel connection of a resistor and a capacitor [Citation7,Citation11,Citation25], with its total admittance defined as
(9)
(9)
where
is the impedance,
is the RF current,
is the RF voltage,
is the conductance, and
is the susceptance. The conductance is the inverse of the resistance
and the susceptance can be expressed as
where
is the angular frequency of the RF signal and
is the capacitance. Let
and
denote the conduction and the displacement current, respectively, where
flows through the resistor and
flows through the capacitor in the equivalent circuit model. The total current
can then be expressed as
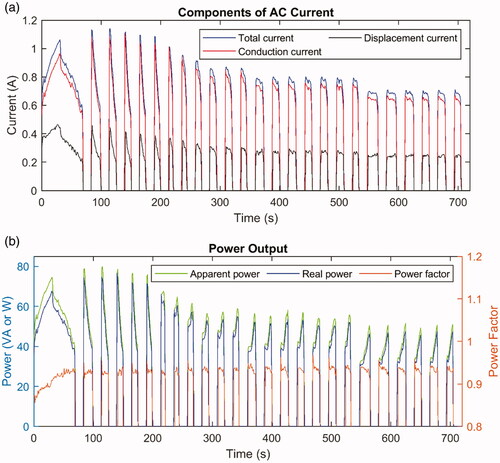
Figure 8. (A) Total current (blue line), calculated conduction current
(red line), and calculated displacement current
(black line). (B) Apparent power (green line, left
-axis), real power (blue line, left
-axis), and power factor (red line, right
-axis) during one ablation of ex vivo bovine liver.
The resistance and capacitance can then be calculated, and they are plotted in ; the total impedance is also plotted for comparison. The resistance would sharply rise right before each pause onset because the electrical conductivity would significantly fall at temperatures above 100 °C. On the other hand, it should be noted that the capacitance also fell before each roll-off, which qualitatively agreed with the assumed curves as plotted in because the capacitance is proportional to the relative permittivity. The decrease in relative permittivity could be attributed to the rupture of cell membranes due to necrosis, which is further discussed later in this report.
The phase difference could also be used to calculate the conduction and the displacement current, which are plotted in along with the measured total current. The conduction current in is in phase with the voltage and contributes to the thermal output; namely, it delivers the active power, which is also called the real power. However, the displacement current
is out of phase and does not generate heat, and it is responsible for the reactive power or the imaginary power. The value of
is defined as the apparent power (in units of VA) and includes the reactive power, while the real power should be calculated as
The ratio between the real power and the apparent power is defined as the power factor, which can be calculated as
The apparent power, real power, and power factor are plotted in , where it can be observed that the power factor should indeed be considered, especially before the first pause onset. The observation could be repeated across different experiments to show that by considering the power factor or not, the energy output difference was ∼4–8% during the ablation and the difference was ∼8–9% before the first pause onset. For the dataset plotted here, the output energy difference was ∼8.2% for the entire ablation and ∼9.4% before the first roll-off, considering the power factor or not.
FEM simulation results
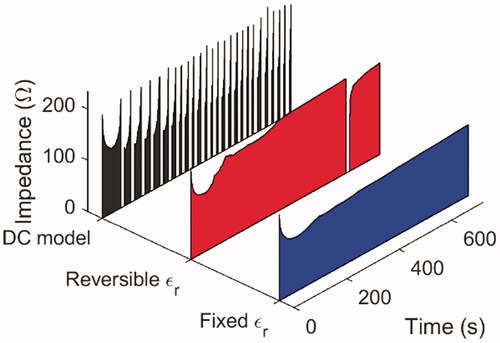
The simulated total impedance of the AC model with a fixed the AC model with a temperature-dependent and reversible
and the DC model without the inclusion of
are plotted in . If the displacement current were negligible, the AC models would generate results similar to that of the DC model, except that the computation time may be longer, which was not the case. In particular, no pause onset was triggered at all for the AC model with a fixed relative permittivity, and it was only triggered once for a reversible
whereas the DC model showed regular occurrences of roll-off. This is because, in the equivalent circuit model of liver tissue, the resistance would significantly increase above 100 °C, and in the DC model, the electric current was forced to pass through this region as conduction current, which continued to heat the liver tissue until eventually a roll-off was triggered. In the AC model, however, the electric current had another pathway through the liver tissue as the displacement current, and if the relative permittivity remained sufficiently large at elevated temperatures, the capacitance in the equivalent circuit model would also remain high; namely the impedance through this pathway would be smaller, and the total impedance would also be too small to trigger a pause onset. Because the electric current would preferentially seek the path of lower impedance, the tissue would be heated more slowly, which would impede the further increase in resistance.
Figure 9. The simulated total impedance of the AC model with a fixed relative permittivity (blue-shaded curve), the AC model with a reversible and temperature-dependent relative permittivity (red-shaded curve), and the DC model (black-shaded curve) during the ablation of ex vivo bovine liver.
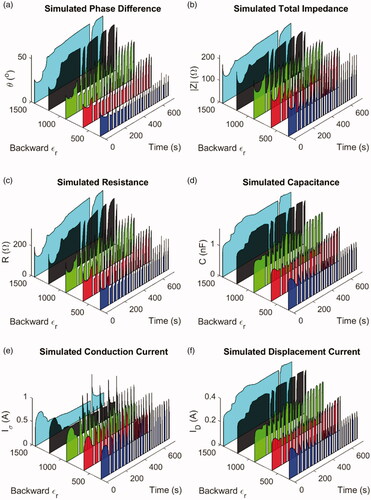
For the test models of AC simulation with an irreversible relative permittivity, the results of a backward from 300 to 1445 are plotted because the results of
or
were similar to those of
The simulated phase difference is plotted in , the total impedance in , the resistance for the equivalent circuit model in , the capacitance in , the conduction current in , and the displacement current in . It should be emphasized again that because of the lack of comprehensive experimental data on the relative permittivity, as well as the difference between the experimental and simulation geometries, the results here were not meant to reproduce exactly the experimental data but to demonstrate the trend in agreement. As can be seen in , when the relative permittivity of liver tissue after reaching 100 °C was set to a lower value, the overall behavior was more analogous to the experiments. When the relative permittivity was set too high, it became difficult for a pause onset to be triggered, for reasons similar to the scenarios for a fixed or reversible
Conversely, if the value dropped to 600 or even 300, the simulation results would look similar to the experimental counterparts. By comparing , it was also observed that the displacement current was a sizable fraction of the conduction current, even when the backward
was set to a lower value, again indicating that it should not be considered negligible here.
Figure 10. AC simulation results of various test models with an irreversible relative permittivity, including (A) phase difference between the RF voltage and current, (B) total impedance, (C) resistance in the equivalent circuit, (D) capacitance in the equivalent circuit, (E) conduction current, and (F) displacement current. It could be observed that when the backward was set to a smaller value, the simulation results appeared similar to the experimental data.
The further numerical analysis also suggested that the backward should be set to a lower value. The total number of roll-off occurrences was counted during the simulated 12-min ablation. The average power factor, defined as the ratio of energy output with the power factor considered to the energy output without the power factor, was calculated before the first roll-off and for the entire 12 min. The necrosis length
and width
of 99% cell death probability was also calculated after 12 min of ablation. Since the necrosis region can be approximated as an ellipsoid with
and
as the principal diameters, the approximate volume can be calculated as
The results from the test models with irreversible
along with the DC model simulation results and the experimental results, are listed in . When the average power factors, necrosis volume, and number of roll-off occurrences are considered together, from the trends in it can be seen that the experimental results were more similar to the AC models with a lower backward
then to the DC model; this is discussed further below.
Table 2. Roll-off numbers, initial impedance, average power factors, and lesion sizes from the AC simulation models, the DC model, and the experimental results.
The experimental average power factors were closer to the results from the AC models with a lower backward then to the DC model. It was also observed that when the backward
was 900 or higher, the average power factor during the entire ablation was lower than that before the first roll-off; this was because when the
was high, the tissue surrounding the RFA probe would stay hot without triggering a pause onset as previously discussed, so the phase difference remained larger and the average power factor was smaller. The opposite was observed when the backward
was set to a smaller value, and the results were more analogous to the experimental results. In such scenarios, the average power factor was at first lower because the tissue was not yet heated above 100 °C, and therefore the phase difference was larger; at elevated temperatures, the phase difference would decrease owing to a smaller backward
and a pause onset could be triggered for the tissue to cool down. Such a transition of tissue
from a high to a low value during ablation also indicates the necessity of using an AC simulation model instead of a DC model, especially before the first pause onset.
From it can also be observed that the experimental volume of necrosis was closer to the AC models than to the DC model. Since AC models with a higher backward would result in a different trend of average power factors as discussed in the previous paragraph, as well as an overly small number of roll-off occurrences, altogether it can be seen that the experimental results were more similar to the AC models with a lower backward
In addition, some other numbers may also be overestimated in the DC model. If the relative permittivity and the electrical conductivity are homogeneous or have the same space dependence in a medium, it can be proven that the product of the medium’s resistance and capacitance would be [Citation26]
(10)
(10)
Because hepatic tissue before ablation could be considered homogeneous, EquationEquation (9)(9)
(9) can be rewritten as
(11)
(11)
For the test models in , the phase difference from was calculated to be ∼27.1o at 20 °C, which agreed well with the initial phase difference observed in the experiments. In the DC simulation, moreover, the magnitude of impedance was calculated as
by ignoring the displacement current, while in the AC simulation, it was
For the same initial power setting of
the initial voltage output was calculated as
which was larger in the DC simulation than in the AC counterpart. Because the power factor is always 1 for the DC setting, the actual power delivered to the liver tissue is also overestimated as
From it can be seen that the initial impedance was indeed higher in the DC model than in the AC model. The simulated initial impedance was not close enough to the experimental value, on the other hand. This could be because the axisymmetric 2 D simulation geometry could not exactly reproduce the 3 D experimental setup for the shape and size of liver tissue, the location of the ground electrode, and so on, as indicated by Yero et al. [Citation10]. Future studies with a 3 D geometry identical to the experimental setup may further improve the agreement.
Discussion
From the experimental data and the AC simulation results, it was observed that the displacement current was not always so small that it could be altogether omitted in the simulation. As discussed in the previous section, several numbers may be overestimated in the DC approximation. Using S/m and
as numerical examples for human liver at 37 °C, the magnitude of the impedance, initial voltage, and initial power delivered to the liver tissue would be ∼12.9%, ∼6.2%, and ∼12.9% higher in the DC simulation than in the AC, respectively, when all other conditions are the same. The overestimation of these calculations may cause the DC simulation to disagree with experimental or clinical results, and it could also affect other simulation conclusions. As previously discussed, the DC ablation volume was ∼10.0% larger than the AC counterpart of a backward
for example. The AC simulation of RFA could therefore improve results and facilitate pre-clinical planning for surgeons, thus helping save the time and cost of actual surgery.
When the phase difference is measured, in addition, this additional information provides several benefits. The real power and energy delivered to the tissue can be more precisely calculated and, as discussed previously, the output energy may differ by ∼9.4% before the first roll-off. Because in some RFA protocols the surgeon performs short-duration ablations multiple times to treat the same tumor region, a more accurate reading of energy output could be clinically important. Surgeons could also become more experienced in less time because the difference in tissue parameters between different patients or between different treatment areas could be better reported during ablation. It is also possible to develop novel mechanisms for ablation control; patents have already been granted for the detection and control of phase-sensitive power during RFA [Citation27,Citation28], and the patent disclosures proposed that the change in the phase difference could be used for RFA control. As shown in this study, the change in physical quantities like the capacitance value can also be combined with other parameters to increase the safety or efficiency of ablation. Because the dielectric properties of tumor and normal tissue may be quite different [Citation29], it may also be possible to develop methods of intraoperative feedback, monitoring, or assessment for ablating tumors in vivo.
Additional studies are needed to measure the relative permittivity of the liver under different conditions to improve numerical modeling. In a frequency regime of several hundred kHz, the relative permittivity of biological tissue is in the dispersion region, and its value is affected by the polarization of cellular membranes; when the membranes break owing to necrosis, they no longer act as ion barriers and the relative permittivity decreased [Citation7,Citation11,Citation16,Citation25]. As a result, it can be expected that the relative permittivity is determined by the level of tissue necrosis and irreversible structural change in addition to temperature [Citation25], and the relative permittivity may depend on how fast the tissue temperature is changing and whether the tissue is being heated up or cooled down [Citation7]. Pop et al. [Citation25] and Yero et al. [Citation11] also reported that reversible and irreversible effects were both present during RFA heating, such as in the temperature range above 80 °C for porcine liver [Citation11]. Test models with a transition temperature of 80 °C were also simulated in this study (results not shown here), and indicated trends similar to models with a transition at 100 °C. Further experimental studies are needed to determine the details of transition temperature (or temperature range). In the literature very few measurements were performed above 100 °C; such studies could be especially valuable [Citation1,Citation17]. From the results in this study, the relative permittivity is expected to drop to several hundred or even lower when the tissue cools from a high temperature, similar to the conditions for MWA, in which the relative permittivity fell to ∼10% of that at room temperature [Citation18]. The availability of such tissue parameters could enable the full potential of the AC simulation models discussed in this study.
Additional measurements of tissue parameters can also determine if the value of is sufficiently small to justify using electrostatic equations for the DC approximation. For example, Macchi et al. showed that in porcine liver at 37 °C the relative permittivity was 2523 and the electrical conductivity was 0.2851 S/m [Citation7], which resulted in a smaller value for
The corresponding power factor was 0.973, and the DC approximation was more applicable, which was the model used in the study. Another example is the case of some ex vivo samples, because the relative permittivity and/or electrical conductivity may change as a function of time after animal death or after the tissue is frozen and then thawed. Yet another scenario is the possible difference in electrical properties between tumors and normal tissues. For example, Smith et al. studied the dielectric properties of healthy and cancerous rabbit liver [Citation29], and from the data points, it can be estimated that the phase difference at 25 °C in normal tissues and in confluent nodules would be ∼20.2o and ∼6.6o, respectively; here, the DC approximation would be better suited for tumors and less applicable for normal tissues.
Finally, it is also possible that other tissue parameters may include an irreversible component, such as the electrical conductivity [Citation25,Citation30,Citation31] and the thermal conductivity [Citation32]. In this study, these properties were modeled as reversible so that the effects of irreversible relative permittivity could be investigated under controlled conditions, similar to the approach by Ji et al. [Citation18]. Future studies like these will provide a comprehensive database for RFA simulations to be more precise and valuable [Citation17,Citation31], especially for the prediction of experimental results in arbitrary 3 D, multiple-electrode, in-vivo-with-blood-perfusion, or real-anatomy scenarios.
Conclusions
Experiments on ex vivo bovine liver ablation were conducted to measure the phase difference between the RF voltage and current, which revealed that the displacement current was a sizable fraction of the total current and therefore should not be ignored, especially before the first pause onset. The phase information was then used to calculate the values of resistance and capacitance in the equivalent circuit model, as well as the real output power delivered to the tissue; these values can provide more accurate information during the ablation and may have the potential for the development of novel mechanisms for RFA control. FEM simulations based on AC electric currents, bioheat models, and multi-physics interfaces were also performed to test various assumptions about the irreversible relative permittivity of liver tissue cooling from a high temperature. The results indicated that a DC model may be inadequate, especially before the first roll-off, and that the relative permittivity in an AC model would likely fall to a low value of several hundred or lower after the liver tissue reaches an elevated temperature. Our study suggests that numerical simulations of RFA could benefit from additional experiments on tissue parameters under various conditions and that the AC simulation of RFA could be useful for better designs of RFA equipment and better planning of surgical protocols.
Supplemental Material
Download PDF (566.1 KB)Disclosure statement
The Biomedical Technology and Device Research Laboratories at the Industrial Technology Research Institute are developing their own RFA system.
Correction Statement
This article has been republished with minor changes. These changes do not impact the academic content of the article.
Additional information
Funding
References
- Berjano EJ. Theoretical modeling for radiofrequency ablation: state-of-the-art and challenges for the future. Biomed Eng Online. 2006;5(1):24–17.
- Haemmerich D, Chachati L, Wright AS, et al. Hepatic radiofrequency ablation with internally cooled probes: effect of coolant temperature on lesion size. IEEE Trans Biomed Eng. 2003;50(4):493–500.
- Irastorza RM, Trujillo M, Berjano E. How coagulation zone size is underestimated in computer modeling of RF ablation by ignoring the cooling phase just after RF power is switched off. Int J Numer Methods Biomed Eng. 2017;33(11):e2869.
- Quaranta V, Manenti G, Bolacchi F, et al. FEM analysis of RF breast ablation: multiprobe versus cool-tip electrode. Anticancer Res. 2007;27(2):775–784.
- Haemmerich D, Wood BJ. Hepatic radiofrequency ablation at low frequencies preferentially heats tumour tissue. Int J Hyperthermia. 2006;22(7):563–574.
- Pinto CH, Taminiau AH, Vanderschueren GM, et al. Technical considerations in CT-guided radiofrequency thermal ablation of osteoid osteoma: tricks of the trade. AJR Am J Roentgenol. 2002;179(6):1633–1642.
- Macchi EG, Gallati M, Braschi G, et al. Dielectric properties of RF heated ex vivo porcine liver tissue at 480 kHz: measurements and simulations. J Phys D: Appl Phys. 2014;47(48):485401.
- Arenas J, Perez JJ, Trujillo M, et al. Computer modeling and ex vivo experiments with a (saline-linked) irrigated electrode for RF-assisted heating. Biomed Eng Online. 2014;13(1):164–116.
- Foundation for Research on Information Technologies in Society. Tissue Frequency Chart. https://itis.swiss/virtual-population/tissue-properties/database/tissue-frequency-chart/
- Yero DD, González FG, Van Troyen D, et al. Modeling of RF thermal ablation taking into account the temperature dependence of the tissue properties. Revista Ingeniería Electrónica, Automática y Comunicaciones. 2018;40(1):81–95.
- Yero DD, González FG, Van Troyen D, et al. Dielectric properties of ex vivo porcine liver tissue characterized at frequencies between 5 and 500 kHz when heated at different rates. IEEE Trans Biomed Eng. 2018;65(11):2560–2568.
- Candeo A, Dughiero F. Numerical validation of the efficiency of dual-frequency radiofrequency ablation. In: Excerpt from the Proceedings of the COMSOL Conference in Milan Milan, Italy: COMSOL; 2009.
- Trujillo M, Berjano E. Review of the mathematical functions used to model the temperature dependence of electrical and thermal conductivities of biological tissue in radiofrequency ablation. Int J Hyperthermia. 2013;29(6):590–597.
- Watanabe H, Yamazaki N, Kobayashi Y, et al. Temperature dependence of thermal conductivity of liver based on various experiments and a numerical simulation for RF ablation. In: 2010 Annual International Conference of the IEEE Engineering in Medicine and Biology. Buenos Aires, Argentina: IEEE EMBS (IEEE Engineering in Medicine and Biology Society); 2010. p. 3222–3228.
- Ooi EH, Lee KW, Yap S, et al. The effects of electrical and thermal boundary condition on the simulation of radiofrequency ablation of liver cancer for tumours located near to the liver boundary. Comput Biol Med. 2019;106:12–23.
- Gabriel C, Gabriel S, Corthout E. The dielectric properties of biological tissues: I. Literature survey. Phys Med Biol. 1996;41(11):2231–2249.
- Brace CL. Temperature-dependent dielectric properties of liver tissue measured during thermal ablation: Toward an improved numerical model. In: 2008 30th Annual International Conference of the IEEE Engineering in Medicine and Biology Society; 2008. p. 230–233.
- Ji Z, Brace CL. Expanded modeling of temperature-dependent dielectric properties for microwave thermal ablation. Phys Med Biol. 2011;56(16):5249–5264.
- Rohatgi A. WebPlotDigitizer. https://automeris.io/WebPlotDigitizer
- Santago A, Kemper A, McNally C, et al. The effect of temperature on the mechanical properties of bovine liver. Biomed Sci Instrum. 2009;45:376–381.
- Kemper AR, Santago AC, Stitzel JD, et al. Biomechanical response of human liver in tensile loading. Ann Adv Automot Med. 2010;54:15–26.
- Miklavčič D, Pavšelj N, Hart FX. Electric properties of tissues. In: Wiley encyclopedia of biomedical engineering. Hoboken (NJ): John Wiley & Sons, Inc. 2006.
- Raicu V, Saibara T, Irimajiri A. Dielectric properties of rat liver in vivo: a noninvasive approach using an open-ended coaxial probe at audio/radio frequencies. Bioelectrochem Bioenerg. 1998;47(2):325–332.
- Bordi F, Cametti C, Gili T. Reduction of the contribution of electrode polarization effects in the radiowave dielectric measurements of highly conductive biological cell suspensions. Bioelectrochemistry. 2001;54(1):53–61.
- Pop M, Molckovsky A, Chin L, et al. Changes in dielectric properties at 460 kHz of kidney and fat during heating: importance for radio-frequency thermal therapy. Phys Med Biol. 2003;48(15):2509–2525.
- Cheng DK. Field and wave electromagnetics. Boston (MA): Addison-Wesley; 1989.
- Edwards SD, Stern RA. Systems and methods for radiofrequency ablation with phase sensitive power detection. United States patent 5,423,808, 1995.
- Edwards SD, Stern RA. Systems for radiofrequency ablation with phase sensitive power detection and control. United States patent 5,722,975, 1998.
- Smith SR, Foster KR, Wolf GL. Dielectric properties of VX-2 carcinoma versus normal liver tissue. IEEE Trans Biomed Eng. 1986;33(5):522–524.
- Wi H, McEwan AL, Lam V, et al. Real-time conductivity imaging of temperature and tissue property changes during radiofrequency ablation: an ex vivo model using weighted frequency difference. Bioelectromagnetics. 2015;36(4):277–286.
- Zurbuchen U, Holmer C, Lehmann KS, et al. Determination of the temperature-dependent electric conductivity of liver tissue ex vivo and in vivo: importance for therapy planning for the radiofrequency ablation of liver tumours. Int J Hyperthermia. 2010;26(1):26–33.
- Bhattacharya A, Mahajan R. Temperature dependence of thermal conductivity of biological tissues. Physiol Meas. 2003;24(3):769–783.