
 ?Mathematical formulae have been encoded as MathML and are displayed in this HTML version using MathJax in order to improve their display. Uncheck the box to turn MathJax off. This feature requires Javascript. Click on a formula to zoom.
Abstract
Purpose
The aim of this study was to assess the feasibility of T2 relaxation time in predicting the immediate technical outcome i.e., nonperfused volume ratio (NPVr) of magnetic resonance-guided high-intensity focused ultrasound (MRgHIFU) treatment of symptomatic uterine fibroids and to compare it with existing T2-weighted imaging methods (Funaki classification and scaled signal intensity, SSI).
Materials and methods
30 patients with 32 uterine fibroids underwent an MRI study including a quantitative T2 relaxation time measurement prior to MRgHIFU treatment. T2 relaxation times were measured with a multi-echo fast imaging-based technique with 16 echoes. The correlation between pretreatment values of the uterine fibroids and treatment outcomes, that is nonperfused volume ratios (NPVr), was assessed with nonparametric statistical measures. T2 relaxation time-based method was compared to existing T2-weighted imaging-based methods using receiver-operating-characteristics (ROC) curve analysis and Chi-square test.
Results
Nonparametric measures of association revealed a statistically significant negative correlation between T2 relaxation time values and NPVr. The T2 relaxation time classification (T2 I, T2 II, and T2 III) resulted in the whole model p-value of 0.0019, whereas the Funaki classification resulted in a p-value of 0.56. The T2 relaxation time classification (T2 I and T2 II) achieved a whole model of a p-value of 0.0024, whereas the SSI classification had a p-value of 0.0749.
Conclusions
A longer T2 relaxation time of the fibroid prior to treatment correlated with a lower NPVr. Based on our results, the T2 relaxation time classifications seem to outperform the Funaki classification and the SSI method.
1. Introduction
Magnetic resonance-guided high-intensity focused ultrasound (MRgHIFU) treatment is based on the noninvasive heating capability of high-intensity ultrasound causing coagulative necrosis of the targeted lesions which is combined with real-time magnetic resonance imaging (MRI) for thermal mapping and anatomical monitoring during the treatment. The MRgHIFU treatment has been demonstrated to be a safe and effective treatment for symptomatic uterine fibroids [Citation1–4].
Histologically uterine fibroids consist of smooth muscle cells and myofibroblasts which produce an extracellular matrix (ECM) containing collagen as well as other compounds [Citation5]. Uterine fibroids have been shown to have intra- and inter-fibroid differences reflecting the heterogeneity within and between uterine fibroids [Citation6–8]. For example, uterine fibroids have been demonstrated to exhibit different collagen contents and compositions, as well as different cellular compositions between small and large uterine fibroids [Citation7,Citation8]. Variations within large uterine fibroids have also been reported in which a spatial difference was detected in the fibroid activity [Citation6].
Certain MRI-related parameters have been shown to correlate with histology of the uterine fibroids [Citation9,Citation10]. Thus, the high signal intensity in T2-weighted images has been correlated with high proliferative activity and high cellularity, whereas a low signal intensity in T2-weighted images and a shorter T2 relaxation time have been correlated with a high fiber content of the tissue [Citation9,Citation10]. Poor technical MRgHIFU treatment outcomes have been associated with extensive cellularity and vascularity; these seem to be attributable to heat dissipation due to perfusion and conduction [Citation11]. For these reasons, some kind of uterine fibroid characterization prior to the MRgHIFU treatment is usually performed with different techniques. Several MRI-related parameters have been shown to predict the technical treatment outcome or treatment efficiency parameters [Citation12–18]. In particular, T2-based methods have been used in uterine fibroid characterization, e.g., the relative T2-weighted signal intensity (Funaki classification [Citation12]) and scaled signal intensity (SSI [Citation18]). The Funaki classification is based on T2-weighted images in which the signal intensity of the uterine fibroid is compared to signal intensities from myometrium and muscle: hypointense (Funaki I), intermediate (Funaki II), and hyperintense (Funaki III). Even though the Funaki classification is widely used in predicting the outcome of uterine fibroid HIFU treatment, it only provides a semi-quantitative assessment of the suitability of HIFU as a treatment option for this particular fibroid. On the other hand, SSI is a semi-quantitative method in which the signal intensity of uterine fibroid is compared to the signal intensity of muscle and abdominal fat on a scale of 0–100 which should provide a more accurate assessment than can be obtained with the Funaki classification. However, T2-weighted imaging is a qualitative method to assess tissue pathology due to the influence of several factors, e.g., the coil receiver sensitivity and gain effects [Citation19,Citation20]. A quantitative imaging method would not depend on these factors and could therefore provide a more reliable and comparable assessment of tissue structure and a more reliable prediction of the technical outcome.
T2 relaxation time mapping is an MR imaging-based technique that can provide quantitative information about tissue structures, e.g., its fiber content [Citation9]. In this technique images with several different echo times are obtained based on which the T2 relaxation time maps can be calculated using a mathematical model.
The aim of this study was to assess the feasibility of T2 relaxation time in predicting the immediate NPV ratios of magnetic resonance-guided high-intensity focused ultrasound (MRgHIFU) treatment of symptomatic uterine fibroids and comparing it to the existing T2-weighted imaging-based methods (Funaki classification and scaled signal intensity method).
2. Materials and methods
2.1. Patients
This prospective study was approved by the Ethics Committee of the Hospital District (ETMK: 95/1801/2015 6/16/2015). Written informed consent for the MRgHIFU procedure and for using the data was obtained from all patients.
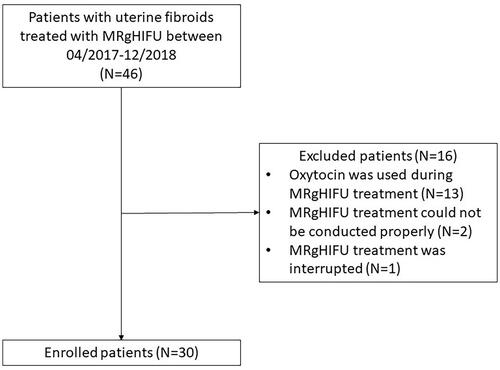
Patients were enrolled for the MRgHIFU treatment of uterine fibroids between April 2017 and December 2018. Inclusion and exclusion criteria for the MRgHIFU treatment have been described in the previous report [Citation17]. The patients of this study had to meet the following inclusion criteria: (1) patient had undergone T2 relaxation time mapping before MRgHIFU treatment, (2) oxytocin was not used during MRgHIFU treatment, and (3) MRgHIFU treatment could be conducted without problems or interruptions that might affect the end result. A total of 30 patients were included in this study, and 16 patients were excluded due to the following reasons: oxytocin was used during treatment (N = 13), treatment could not be conducted properly due to a retroverted uterus (N = 1), interference of small bowels with the ultrasound beam (N = 1), and interrupted treatment due to the patient experiencing significant discomfort during sonications (N = 1), see CONSORT diagram ().
Figure 1. A CONSORT flow diagram of the patient selection process in this study.
2.2. Screening MRI
Fifteen patients had their screening MRI performed with the same MRI scanner (Ingenia 3.0 T, Philips Healthcare, Best, The Netherlands) which has an integrated MRgHIFU system (Sonalleve V2, Profound Medical Inc., Mississauga, Canada) and fifteen patients had their screening MRI performed in their local hospital with different MRI scanners. The screening MRI protocol in our hospital included T2-weighted, T1-weighted, T2 relaxation time mapping, and contrast-enhanced T1-weighted imaging (). The screening MRI protocol in other hospitals usually included T2-weighted, T1-weighted, and contrast-enhanced T1-weighted imaging with slightly varying sequence parameters. Sagittal T2-weighted images were used for the determination of the Funaki classification: mean echo time 97 ms (range: 75–138 ms) and mean repetition time 5189 ms (range: 3500–10412 ms). The interventional radiologist (GK) evaluated the patient’s suitability from the screening MR images as described in a previous report [Citation17].
Table 1. MRI sequence parameters for screening and MRgHIFU therapy.
2.3. Funaki classification and scaled signal intensity (SSI)
The average T2 signal intensity (SI) of uterine fibroid, abdominal muscle, abdominal fat, and myometrium were obtained from regions of interest (ROIs) which were drawn with Osirix software (v.7.0, Pixmeo) on sagittal T2-weighted images. From these signal intensities, the Funaki classification was determined: Funaki I, hypointense (SI of the fibroid ≤ SI of the abdominal muscle); Funaki II, intermediate (SI of the abdominal muscle < SI of the fibroid < SI of the myometrium); and Funaki III, hyperintense (SI of the fibroid ≥ SI of the myometrium). Relative T2 signal intensities (rT2) were also calculated (average SI of fibroid/average SI of skeletal muscle and average SI of fibroid/average SI of the myometrium) for correlation analysis.
From these signal intensities, scaled signal intensity could be calculated (EquationEquation 1(1)
(1) ) on the scale of 0–100 in which the average SI of fibroid is compared to the average SI of the muscle and abdominal fat as described in a previous study [Citation18].
(1)
(1)
2.4. T2 relaxation time mapping
T2 relaxation mapping sequence and fitting software of the scanner (Philips) were validated using a set of aqueous paramagnetic relaxation phantoms as described previously [Citation21]. Four solutions were prepared in sterilized polypropylene centrifuge tubes (50 ml) by dissolving copper sulfate pentahydrate (CuSO4 · 5 H2O, purity ≥98%, Sigma-Aldrich) in double distilled water to concentrations of 26.905 mM, 19.359 mM, 13.341 mM, and 4.482 mM, resulting in T2 relaxation times of 50 ms, 69 ms, 99 ms, and 275 ms, respectively. T2 relaxation times of the phantoms were measured with both coil setups using a multi-echo, turbo spin-echo (TSE), echo-planar imaging (EPI) based technique by acquiring images with 16 echo times (TE 12–192 ms) and T2 relaxation times were calculated using scanner software.
T2 relaxation time mapping was acquired either as a part of the routine clinical screening protocol using a torso coil with 32 channels (four patients) or immediately prior to the MRgHIFU treatment with a HIFU coil system which consisted of two separate coils with a total of five channels (26 patients). The T2 images were acquired with 16 echo times of 12–192 ms. The T2 relaxation time maps were reconstructed using MRI scanner software (Philips).
ROIs were drawn with Carestream Vue PACS (v. 12.2.0.1007, Philips) in the three middle slices of the fibroid. The ROI border was placed a few millimeters inside the fibroid to avoid any partial volume effect. The ROI size was therefore dependent on the size of the fibroid. The averaged quantitative T2 relaxation time values were obtained for each fibroid.
2.5. MRgHIFU system and treatment procedure
All treatment procedures were performed using an extracorporeal, clinical tabletop MRgHIFU system (Sonalleve V2, Profound Medical Inc., Mississauga, Canada) equipped with a direct skin cooling device in combination with a 3.0 T clinical MR scanner (Ingenia, Philips, Best, the Netherlands).
The patient preparation, procedure, and medication were performed as previously described [Citation22]. The radiologist (GK) planned the treatment by positioning the ellipsoid treatment cells (axial diameters: 4, 8, 12, 14, and 16 mm) into the targeted fibroid one by one. The available therapy sonication acoustic power range was 140–300 W. During the sonication, heating of the targeted area and possible undesired heating of surrounding tissue were monitored with real-time MR thermometry by using the proton resonance frequency shift technique.
Immediately after the treatment, contrast-enhanced T1-weighted images were acquired by injecting the contrast agent (DOTAREM, Guerbet, Aulnay-Sous-Bois, France, 0.1 mmol/kg) to evaluate the NPV.
2.6. T2 relaxation time classification
In order to compare the T2 relaxation time classification to the Funaki classification, the T2 relaxation time classification needed to be divided into three groups. The technical success of the treatment outcome was usually measured by NPVr which is an objective and quantitative measure. Furthermore, the NPVr has been shown to correlate with the clinical treatment outcome [Citation11,Citation23]. Clinical success is commonly defined as at least a 10-point reduction in the symptom severity score (SSS) after the treatment [Citation24]. An NPVr of more than 80% has been shown to result in clinical success in more than 80% of patients [Citation23]. Correspondingly, the odds of clinical success have been shown to be 2.8 in those with an NPV of 30% or greater compared with those with an NPV of less than 30% [Citation11]. Because of this rather robust correlation between the technical and clinical success as well as the objective nature of NPVr, the classification created in this study was based on NPVr rather than on SSS. The NPVr thresholds were chosen as follows; an NPVr of more than 80% representing a good treatment outcome, an NPVr between 30% and 80% representing a moderate treatment outcome, and an NPVr less than 30% representing a poor treatment outcome.
In order to compare the T2 relaxation time classification to the SSI classification, the T2 relaxation time classification needed to be divided into two groups. An NPVr of 45% was used to determine an optimal cut-off value for the T2 classification similarly to in a previous study investigating the SSI classification [Citation18].
2.7. Statistical analysis
Statistical analysis was performed using JMP Pro statistical software version 13.1.0 (SAS Institute Inc.). A p-value less than 0.05 was considered statistically significant.
The normal distribution of each dataset was analyzed with the Shapiro-Wilk W test. Normally distributed numerical data are presented as mean ± standard deviation and data with skewed distribution are presented as the median [interquartile range (IQR)]. The correlation between normally distributed parameters was analyzed by Pearson product-moment correlation and non-normally distributed parameters were analyzed by Spearman’s rank correlation analysis. Receiver-operating-characteristic (ROC) curve analyses were performed to determine optimal cutoff values. The whole models were examined using ROC curve analysis, and statistical significance was tested with Chi-square test. Group means of normally distributed datasets were compared using Tukey-Kramer honestly significant difference (HSD) test for all pairs and non-normally distributed datasets were compared using the Steel-Dwass method for all pairs.
3. Results
3.1. MRgHIFU treatment
A total of 30 patients with 32 uterine fibroids were treated without any significant adverse events. In all cases, nonperfused regions were detected after treatment, resulting in a mean NPVr of 57 ± 29%. An overview of the study population and the MRgHIFU treatment parameters is shown in .
Table 2. Summary of the study population and MRgHIFU treatment parameters.
3.2. T2 relaxation time mapping
T2 relaxation time phantoms were measured with the HIFU coil and the torso coil setup. Validation measurement results for each relaxation time phantom are presented in . The median T2 relaxation time value of all fibroids was 66 ms [58–85 ms].
Table 3. T2 relaxation time validation measurement results for each relaxation time phantom with both coil setups.
3.3. Correlations between pretreatment and treatment outcome parameters
T2 relaxation time, rT2(fibroid/muscle), rT2(fibroid/myometrium) and SSI all displayed statistically significant negative correlations with NPVr, resulting in the following correlation coefficients and p-values: −0.54 (p-value 0.001*), −0.37 (p-value 0.035*), −0.47 (p-value 0.007*), and −0.37 (0.035*), respectively.
3.4. Classifications
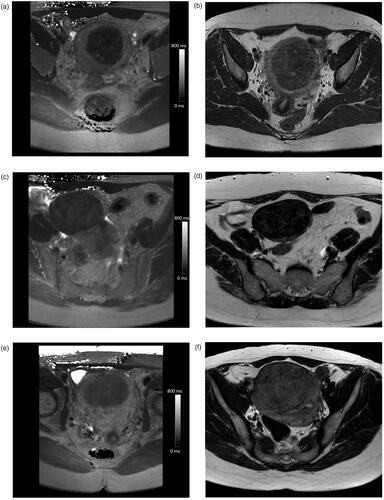
The analysis of the ROC curve indicated an optimal T2 cutoff value of 57.6 ms for NPVr > 80%, and 78.3 ms for NPVr < 30%, resulting in the following T2 relaxation time classification: T2 I (NPVr > 80%), T2 II (NPVr 30–80%), and T2 III (NPVr < 30%) which could be compared to the Funaki classification. Examples of the pretreatment T2 relaxation time maps and the corresponding screening T2-weighted images for each classification group are presented in .
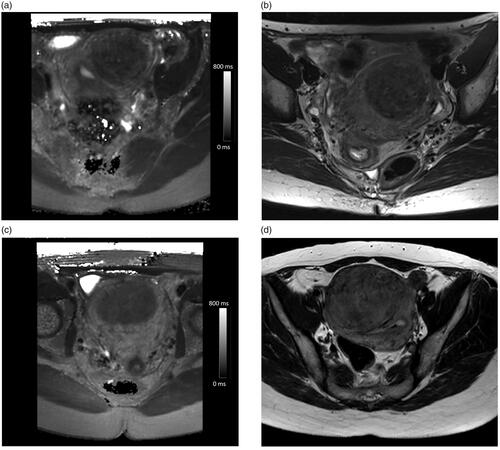
Figure 2. Example pretreatment axial T2 relaxation time maps and the corresponding screening MRI axial T2-weighted images illustrating the Funaki classification: (a) T2 I: T2 value of 48 ms, (b) Funaki II, (c) T2 II: T2 value of 66 ms, (d) Funaki I, (e) T2 III: T2 value of 89 ms, and (f) Funaki II.
Groups within the classifications were compared with the Steel-Dwass method for all pairs which indicated that there was no statistical difference between Funaki classification groups, whereas there were statistically significant differences between the T2 relaxation time classification groups (). ROC curve analysis by NPVr was performed for T2 relaxation time and Funaki classifications ().
Figure 3. Box–Whisker plots presenting NPV ratios for (a) Funaki classification and (b) T2 relaxation time classification groups, and group means within the classifications were compared with the Steel-Dwass method for all pairs (*p-value < 0.05).
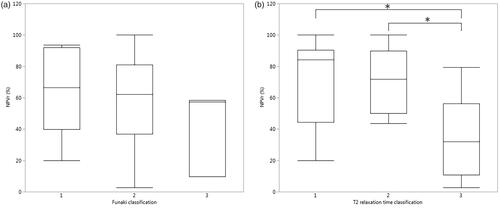
Figure 4. ROC curve analysis by NPVr was performed for (a) Funaki classification and (b) T2 relaxation time classification (red line group I, green line group II, and blue line group III).
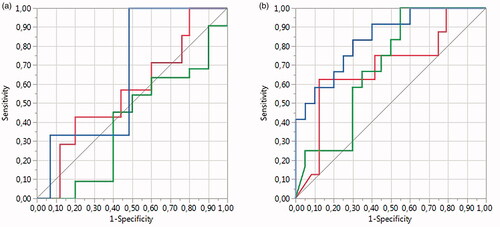
The T2 relaxation time classification resulted in an area under the curve (AUC) values of 0.69 (T2 I), 0.69 (T2 II), and 0.84 (T2 III), resulting in a whole model p-value of 0.0019, whereas the AUCs for the Funaki classification was 0.57 (Funaki I), 0.40 (Funaki II), and 0.66 (Funaki III), resulting in a whole model p-value of 0.56. The fibroid volumes and treatment parameters displayed no statistically significant differences between the T2 relaxation time and Funaki classification groups except for the total energy between T2 relaxation time groups I and III (p-value 0.021*). A summary of the fibroid characteristics and MRgHIFU treatment parameters for each T2 relaxation time and the Funaki classification groups is presented in .
Table 4. Summary of fibroid characteristics and MRgHIFU treatment parameters in each T2 relaxation time and Funaki classification group presented as median [interquartile range] or mean ± standard deviation.
The analysis of the ROC curve revealed an optimal T2 cutoff value of 68.0 ms for NPVr > 45%, resulting in the following T2 relaxation time classifications: T2 I (NPVr > 45%), and T2 II (NPV ≤ 45%), which could be compared to the SSI classification. Examples of the pretreatment T2 relaxation time maps and the corresponding screening T2-weighted images for each classification group are presented in .
Figure 5. Example pretreatment axial T2 relaxation time maps and corresponding screening MRI axial T2-weighted images illustrating SSI classification: (a) T2 I: T2 value of 63 ms, (b) SSI II, (c) T2 II: T2 value of 89 ms, and (d) SSI II.
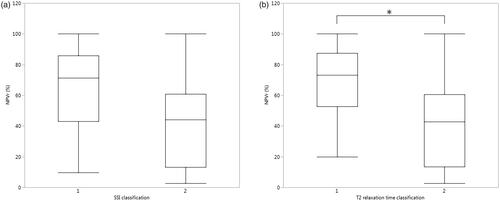
Group means within the classifications were compared with Tukey-Kramer honestly significant difference (HSD) test for all pairs, which indicated that there was no statistical difference in SSI classification group means, whereas there were statistically significant differences between T2 relaxation time classification group means ().
Figure 6. Box–Whisker plots presenting NPV ratios for (a) SSI classification and (b) T2 relaxation time classification groups, and group means within the classifications when compared with all pairs Tukey–Kramer HSD test (*p-value < 0.05).
ROC curve analysis by NPVr was performed for T2 relaxation time and SSI classifications (). The T2 relaxation time classification resulted in an area under the curve (AUC) value of 0.79, resulting in a whole model of p-value of 0.0024, whereas the AUC for the SSI classification was 0.71, resulting in a whole model p-value of 0.0749. The fibroid volumes and treatment parameters displayed no statistically significant differences between the T2 relaxation time and SSI classification groups. A summary of the fibroid characteristics and MRgHIFU treatment parameters in each T2 relaxation time and SSI classification group is presented in .
Figure 7. ROC curve analysis by NPVr was performed for (a) SSI classification and (b) T2 relaxation time classification.
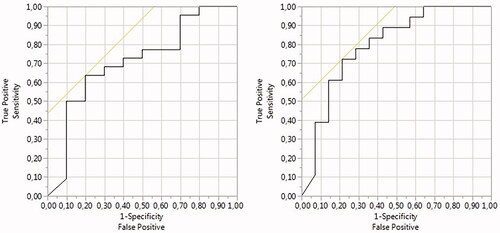
Table 5. Summary of fibroid characteristics and MRgHIFU treatment parameters in each T2 relaxation time and SSI classification group presented as median [interquartile range] or mean ± standard deviation.
4. Discussion
Uterine fibroids have been recognized to display histopathological heterogeneity within and between fibroids which can be evident as differences in cellularities, fiber and collagen contents, and proliferative activity [Citation6–10]. These histopathological differences are reflected in the different healing properties of the tissues which lead to varied MRgHIFU treatment results [Citation11]. Therefore, several MRI-based prediction methods have been devised to help in the MRgHIFU treatment selection process of the patients [Citation12–18]. The most commonly used methods are based on T2-weighted imaging [Citation12,Citation18]. However, T2-weighted imaging is a qualitative method in which the signal intensity and image contrast are influenced by several imaging factors [Citation19,Citation20]. Therefore, a quantitative imaging method could be more reliable in predicting the MRgHIFU treatment outcome which has been demonstrated in the previous studies with diffusion-weighted imaging [Citation17]. T2 relaxation time mapping is an MRI technique that can provide quantitative information about the tissue properties of uterine fibroids [Citation9,Citation25].
The T2 relaxation time validation measurement results of this study indicate that T2 relaxation time maps can be reliably measured from uterine fibroids using a multi-echo fast imaging-based sequence and calculated with the scanner software (Philips) regardless of the coil setup. The median T2 relaxation time of uterine fibroids in this study was 66 ms [58–85 ms] which was a similar value as reported in previous studies [Citation9,Citation25].
T2 relaxation times, T2-weighted signal intensity ratios and SSI all displayed statistically significant negative correlations with NPVr which demonstrates that these could be good predictors of MRgHIFU treatment outcomes. In support of our findings, a statistically significant negative correlation has been reported in previous studies between T2-weighted signal intensity ratios and NPV ratios as well as the correlation between SSI and NPV [Citation17,Citation18]. These results indicate that a higher T2-weighted signal intensity and a longer T2 relaxation time of the uterine fibroid prior to treatment predict a poorer technical outcome of MRgHIFU treatment.
In order to compare T2 relaxation time to the Funaki classification, the T2 relaxation time classification was divided into three groups: T2 I (NPVr > 80%), T2 II (NPVr 30–80%), and T2 III (NPVr < 30%) and based on the ROC curve analysis, the optimal cutoff values of T2 relaxation time were estimated as 57.6 ms for NPVr > 80%, and 78.3 ms for NPVr < 30%. The T2 relaxation time-based classification and the Funaki classification were compared with the ROC curve analysis which demonstrated that the T2 relaxation time classification had higher sensitivity, specificity, and AUC values for each group in comparison to the corresponding Funaki classification groups. The statistical significance of both classifications was tested with the Chi-square test which revealed that only the T2 relaxation time classification was a statistically significant predictor of the NPVr. This result supports our hypothesis that a quantitative method could be more reliable in predicting the treatment outcome. This has been also reported in a previous study using another quantitative method [Citation17]. The total treatment energy between T2 relaxation time groups I and III revealed a statistically significant difference which could indicate that a longer T2 relaxation time of uterine fibroid requires higher energy to be delivered during the treatment which could be due to differences in tissue characteristics of the uterine fibroids. The high perfusion of uterine fibroids has been correlated with a poor ablation efficiency which is caused by heat dissipation [Citation26].
The T2 relaxation time was also compared to the SSI classification and therefore the T2 relaxation time classification was divided into two groups: T2 I (NPVr > 45%), and T2 II (NPV ≤45%) and based on the ROC curve analysis, the optimal cutoff value of T2 relaxation time was 68.0 ms for NPVr > 45%. The T2 relaxation time-based classification and the SSI classification were compared with a ROC curve analysis which revealed that the T2 relaxation time classification had higher sensitivity, specificity and AUC values for each group as compared to the SSI classification groups. Statistical significance of both classifications were tested with the Chi-square test which indicated that the T2 relaxation time classification was the only statistically significant predictor of the NPVr. This result also supports our working hypothesis.
Our results have demonstrated that quantitative T2 relaxation time mapping could provide a more reliable prediction of the MRgHIFU treatment outcome than currently used methods. This method could therefore be generalizable to other vendors’ HIFU systems and also applicable to other clinicians’ routines. However, further studies with a larger sample size will be required to confirm these results.
One of the limitations of this study is the small number of Funaki type III fibroids and the small overall sample size. This is caused by the MRgHIFU treatment selection process where usually Funaki type III fibroids are excluded. The number of subjects could not be increased as we changed the treatment protocol to include an oxytocin infusion during the MRgHIFU treatment which has been shown to improve technical outcomes and significantly decrease the blood flow of the uterine fibroids [Citation27,Citation28]. Second, fifteen patients had screening MRI with different scanners which could have affected the Funaki classification results. Third, previous studies have shown that the fibroid volume correlates with NPVr which may be an additional factor affecting the T2 relaxation time classification and the interpretation of the results [Citation23,Citation29]. However, in this study, there were no statistically significant differences in fibroid volumes between the classification groups which suggests that fibroid volume was not a significant factor. Fourth, a statistically significant difference was found between T2 relaxation time groups I and III for the total energy which could have affected the results. Fifth, the T2 relaxation time mapping is not yet commonly used in clinical routines due to the required expertise in image acquisition and post-processing. However, we have demonstrated that multi-echo fast imaging-based technique can be used reliably for T2 relaxation time image acquisition with scanner software being applied for calculating the T2 relaxation time maps which significantly accelerates the imaging and analysis processes. Sixth, T2 relaxation times of uterine fibroids were defined using a mono-exponential decay function but there could also be different T2 relaxation time components in uterine fibroids such as blood and tissue, which should be investigated in future studies.
5. Conclusions
Higher T2-weighted signal intensity and a longer T2 relaxation time of the uterine fibroid prior to treatment predict the poorer technical outcome of the MRgHIFU treatment. The T2 relaxation time classification seems to be able to predict the NPV ratio prior to the MRgHIFU treatment and may even outperform the Funaki and SSI classifications. Multi-echo fast imaging-based technique and scanner software can be used reliably for T2 relaxation time mapping of uterine fibroids which significantly accelerates the imaging and analysis processes and therefore T2 relaxation time mapping could be included as a quantitative measure in the MRI screening protocol in the MRgHIFU treatment of uterine fibroids.
Disclosure statement
No potential conflict of interest was reported by the author(s).
Additional information
Funding
References
- Stewart EA, Gostout B, Rabinovici J, et al. Sustained relief of leiomyoma symptoms by using focused ultrasound surgery. Obstet Gynecol. 2007;110(2):279–287.
- Funaki K, Fukunishi H, Funaki T, et al. Mid-term outcome of magnetic resonance-guided focused ultrasound surgery for uterine myomas: from six to twelve months after volume reduction. J Minim Invasive Gynecol. 2007;14(5):616–621.
- Funaki K, Fukunishi H, Sawada K. Clinical outcomes of magnetic resonance-guided focused ultrasound surgery for uterine myomas: 24-Month follow-up. Ultrasound Obstet Gynecol. 2009;34(5):584–589.
- Al Hilli M, Stewart E. Magnetic resonance-guided focused ultrasound surgery. Semin Reprod Med. 2010;28(3):242–249.
- Moore AB, Yu L, Swartz CD, et al. Human uterine leiomyoma-derived fibroblasts stimulate uterine leiomyoma cell proliferation and collagen type i production, and activate RTKs and TGF beta receptor signaling in coculture. Cell Commun Signal. 2010;8:10–12.
- Wei JJ, Zhang XM, Chiriboga L, et al. Spatial differences in biologic activity of large uterine leiomyomata. Fertil Steril. 2006;85(1):179–187.
- Jayes FL, Liu B, Feng L, et al. Evidence of biomechanical and collagen heterogeneity in uterine fibroids. PLOS One. 2019;14(4):e0215646–16.
- Holdsworth-Carson SJ, Zhao D, Cann L, et al. Differences in the cellular composition of small versus large uterine fibroids. Reproduction. 2016;152(5):467–480.
- Swe TT, Onitsuka H, Kawamoto K, et al. Uterine leiomyoma: correlation between signal intensity on magnetic resonance imaging and pathologic characteristics. Radiat Med. 1992;10(6):235–242.
- Oguchi O, Mori A, Kobayashi Y, et al. Prediction of histopathologic features and proliferative activity of uterine leiomyoma by magnetic resonance imaging prior to GnRH analogue therapy: correlation between T2-weighted images and effect of GnRH analogue. J. Obstet. Gynaecol. 1995;21(2):107–117.
- Fennessy FM, Tempany CM, McDannold NJ, et al. Uterine leiomyomas: MR imaging–guided focused ultrasound surgery—results of different treatment protocols 1. Radiology. 2007;243(3):885–893.
- Funaki K, Fukunishi H, Funaki T, et al. Magnetic resonance-guided focused ultrasound surgery for uterine fibroids: relationship between the therapeutic effects and signal intensity of preexisting T2-weighted magnetic resonance images. Am J Obstet Gynecol. 2007;196(2):1–6.
- Kim Y-S, Keserci B, Partanen A, et al. Volumetric MR-HIFU ablation of uterine fibroids: Role of treatment cell size in the improvement of energy efficiency. Eur J Radiol. 2012;81(11):3652–3659.
- Kim Y-S, Kim B-G, Rhim H, et al. Uterine fibroids: semiquantitative perfusion MR imaging parameters associated with the intraprocedural and immediate postprocedural treatment efficiencies of MR imaging-guided high-intensity focused ultrasound ablation. Radiology. 2014;273(2):462–471.
- Wei C, Fang X, Wang CB, et al. The predictive value of quantitative DCE metrics for immediate therapeutic response of high-intensity focused ultrasound ablation (HIFU) of symptomatic uterine fibroids. Abdom Radiol. 2018;43(8):2169–2175.
- Hocquelet A, Denis de Senneville B, Frulio N, et al. Magnetic resonance texture parameters are associated with ablation efficiency in MR-guided high-intensity focussed ultrasound treatment of uterine fibroids. Int J Hyperthermia. 2017;33(2):142–149.
- Sainio T, Saunavaara J, Komar G, et al. Feasibility of apparent diffusion coefficient in predicting the technical outcome of MR-guided high-intensity focused ultrasound treatment of uterine fibroids–a comparison with the funaki classification. Int J Hyperth. 2021;38(1):85–94.
- Park H, Yoon SW, Sokolov A. Scaled signal intensity of uterine fibroids based on T2-weighted MR images: a potential objective method to determine the suitability for magnetic resonance-guided focused ultrasound surgery of uterine fibroids. Eur Radiol. 2015;25(12):3455–3458.
- Bojorquez JZ, Bricq S, Acquitter C, et al. What are normal relaxation times of tissues at 3 T? Magn Reson Imaging. 2017;35:69–80.
- Hardy PA, Henkelman RM, Bishop JE, et al. Why fat is bright in rare and fast spin-echo imaging. J Magn Reson Imaging. 1992;2(5):533–540.
- Thangavel K, Saritaş EÜ. Aqueous paramagnetic solutions for MRI phantoms at 3 T: a detailed study on relaxivities. Turk J Elec Eng Comp Sci. 2017;25(3):2108–2121.
- Sainio T, Komar G, Saunavaara J, et al. Wedged gel pad for bowel manipulation during MR-guided high-intensity focused ultrasound therapy to treat uterine fibroids: a case report. J Ther Ultrasound. 2018;6(1):10.
- Mindjuk I, Trumm C, Herzog P, et al. MRI predictors of clinical success in MR-guided focused ultrasound (MRgFUS) treatments of uterine fibroids: results from a single Centre. Eur Radiol. 2015;25(5):1317–1328.
- Stewart EA, Rabinovici J, Tempany CMC, et al. Clinical outcomes of focused ultrasound surgery for the treatment of uterine fibroids. Fertil Steril. 2006;85(1):22–29.
- Verpalen IM, Anneveldt KJ, Vos PC, et al. Use of multiparametric MRI to characterize uterine fibroid tissue types. MAGMA. 2020;33(5):689–700.
- Kim Y-S, Lim HK, Kim J-H, et al. Dynamic contrast-enhanced magnetic resonance imaging predicts immediate therapeutic response of magnetic resonance-guided high-intensity focused ultrasound ablation of symptomatic uterine fibroids. Invest Radiol. 2011;46(10):639–647.
- Lozinski T, Filipowska J, Krol P, et al. Oxytocin administration in high-intensity focused ultrasound treatment of myomata. Biomed Res Int. 2018;2018:7518026.
- Otonkoski S, Sainio T, Komar G, et al. Oxytocin selectively reduces blood flow in uterine fibroids without an effect on myometrial blood flow: a dynamic contrast enhanced MRI evaluation. Int J Hyperthermia. 2020;37(1):1293–1300.
- Suomi V, Komar G, Sainio T, et al. Comprehensive feature selection for classifying the treatment outcome of high-intensity ultrasound therapy in uterine fibroids. Sci Rep. 2019;9(1):1–11.