
Abstract
Objectives
To develop an effective nomogram model for predicting the local progression after computed tomography-guided microwave ablation (MWA) in non-small cell lung cancer (NSCLC) patients.
Methods
NSCLC patients treated with MWA were randomly allocated to either the training cohort or the validation cohort (4:1). The predictors of local progression identified by univariable and multivariable analyses in the training cohort were used to develop a nomogram model. The C-statistic was used to evaluate the predictive accuracy in both the training and validation cohorts.
Results
A total of 304 patients (training cohort: n = 250; validation cohort: n = 54) were included in this study. The predictors selected into the nomogram for local progression included the tumor subtypes (odds ratio [OR], 2.494; 95% confidence interval [CI], 1.415–4.396, p = 0.002), vessels ≥3 mm in direct contact with tumor (OR, 2.750; 95% CI, 1.263–5.988; p = 0.011), tumor diameter (OR, 2.252; 95% CI, 1.034–4.903; p = 0.041) and location (OR, 2.442; 95% CI, 1.201–4.965; p = 0.014). The C-statistic showed good predictive performance in both cohorts, with a C-statistic of 0.777 (95% CI, 0.707–0.848) internally and 0.712 (95% CI, 0.570–0.855) externally (training cohort and validation cohort, respectively). The optimal cutoff value for the risk of local progression was 0.39.
Conclusions
Tumor subtypes, vessels ≥3 mm in direct contact with the tumor, tumor diameter and location were predictors of local progression after MWA in NSCLC patients. The nomogram model could effectively predict the risk of local progression after MWA. Patients showing a high risk (>0.39) on the nomogram should be monitored for local progression.
Introduction
Although lung cancer is surpassed and no longer the most common cancer worldwide, it remains the leading cause of cancer mortality, with more than 2.2 million new cases and 1.79 million deaths estimated in 2020 [Citation1]. Moreover, lung cancer remains the leading cause of cancer incidence and mortality in China [Citation2], where non-small cell lung cancer (NSCLC) accounts for 85% of the diagnoses [Citation3]. Over two-thirds of NSCLC patients are diagnosed at an advanced stage and only 20–40% of them are candidates for curative surgery [Citation4]. In recent decades, thermal ablation aims to induce a zone of thermal coagulative necrosis encompassing the entire tumor and a surrounding safety margin and has been recommended as a primary therapeutic strategy for early-stage patients who have contraindications to surgery or stereotactic radiotherapy, and/or an adjuvant to other treatments for advanced-stage patients [Citation5–7]. Radiofrequency ablation (RFA) and microwave ablation (MWA) are the two most common types of thermal ablation, while the latter has the advantages of a higher intratumoral temperature, a larger ablation scope, decreased ablation duration, and deeper penetration [Citation8].
Local tumor progression refers to the appearance of viable tumors in the ablation zone after at least one follow-up study has documented an adequate ablation with no viable tissue [Citation9]. It has been reported that the incidence of local progression after thermal ablation in the lung ranged from 3% to 42% [Citation10,Citation11], with an incidence rate of 31–42% among patients treated with RFA [Citation11,Citation12], and 9–37% among patients treated with MWA according to a systemic review [Citation13]. Previous studies have explored the predictors of local progression [Citation14–16], including tumor diameter, tumor stage, tumor-adjacent to pleura, vessels >3mm in direct contact with the tumor, irregular tumor shape, and energy delivery, some of which remain debatable and the importance of each predictor attributing to local progression remains unclear. A pragmatic and reliable predictive model based on objective measurements is necessary for predicting the occurrence of local progression to select high-risk patients. Nomograms are statistical models specifically designed to maximize predictive accuracy, which can provide prognostic information based on a combination of variables that allow for an individualized prediction of target events. Previous studies have established the nomogram models in predicting the main complications and survival after MWA in lung cancer patients and validated the accuracy [Citation17–Citation19]. However, as far as we know, no such tool is yet available for predicting the local progression after MWA. Therefore, a retrospective study was conducted to develop an effective nomogram model for predicting local progression after MWA in NSCLC patients.
Methods
Patient criteria
This single-center retrospective study included all consecutive NSCLC patients who received MWA in this institution. The institutional ethics review board approved this study. The study protocol was conducted in accordance with the Declaration of Helsinki. The informed consent was waived owing to the retrospective nature of this study. Confirmed NSCLC patients treated with MWA between November 2016 and August 2020 at this institution were screened for this study and were randomly allocated to either the training cohort or the validation cohort at a ratio of 4:1. The baseline therapy of MWA was determined by the multidisciplinary treatment group. Randomization allocation was created using the Stata 9.0 (Stata Corp., College Station, TX) statistical software. The inclusion criteria for this study were as follows: (a) age older than 18 years; (b) the histopathological subtypes of NSCLC were confirmed depending on the bronchoscope before MWA, or/and the biopsies before or concomitant with MWA, and (c) Eastern Cooperation Oncology Group (ECOG) score of 0–2. The exclusion criteria were as follows: (a) tumor diameter over 6 cm; (b) absence of contrast-enhanced computed tomography (CT) scans before MWA, which was unable to judge the direct contact between vessels and ablation zone; (c) other concomitant therapies performed during the MWA procedure, such as the implantation of radioactive seeds; (d) incomplete data; and (e) lost to follow-up.
Definitions and pre-MWA management
Local progression was defined in accordance with the guidelines of the Society of Interventional Radiology (SIR) and was described above [Citation9]. Overall survival (OS) was defined as the interval from the start of MWA to death or the last follow-up (February 28th, 2021). For patients who died during the follow-up period, OS was calculated as the interval from the MWA procedure to death. For patients who survived but were lost to follow-up, OS was calculated as the interval from the MWA procedure to the last follow-up. Progression-free survival (PFS) was defined as the interval from the MWA procedures to the time of objective progression, including local progression and/or metastases, which was evaluated by two independent interventional radiologists. For patients who did not die or progress, the censoring date was defined as the last clinical assessment date.
All NSCLC patients underwent chest CT (CT590; GE Healthcare, Pittsburgh, Pennsylvania) before the MWA procedure to evaluate the location, quantity, and size of tumors. PET/CT or contrast-enhanced CT was performed to evaluate the lymph node and distant metastases. The NSCLC tumor stage was identified via the clinical TNM staging system of the Union for International Cancer Control (8th edition) [Citation20]. All laboratory examinations were conducted 1–4 d before MWA.
MWA procedure
As described previously [Citation21], the MWA procedures followed the SIR guidelines [Citation9] and were performed under CT (CT590; GE) by several experienced interventional radiologists. An MTC-3C MWA system (Vison Medicine, Nanjing, China) or an ECO-100A1 MWA system (ECO Medical Instrument, Nanjing, China) was used, with a microwave emission frequency of 2450 ± 50 MHz and an adjustable continuous-wave output power of 20 to 80 W. The MWA needles (Vison or ECO) were 10-18 cm in effective length and 15–17 G in outside diameter according to the tumor location and distance to the pleura, with a 15 mm active tip. Preprocedural CT was performed to inform the treatment plan and to clarify the suitable position, puncture site location, optimal puncture trajectory, and the number of MWA needles. Local anesthesia was used for most patients, while intravenous anesthesia was used for select patients who cannot tolerate intraprocedural pain. Needles were introduced into the planned site, and MWA was performed at the planned power and duration, with adjustments of suitable power and duration being carried out according to the intraprocedural location of MWA needles as needed. The procedure was terminated when the ablation zone included a 5–10 mm rim of ground-glass opacification (GGO) beyond the lesion boundary. Finally, a repeat chest CT scan was performed to evaluate the ablation zone and detect possible complications. The minimum size of the GGO rim refers to the minimum distance between the external boundary of GGO and the edge of the tumor. For patients without a histopathological subtype, a synchronous coaxial-cannula biopsy was performed. A 15 G coaxial introducer needle (Co-Axial Introducer Needle; Argon Medical Devices, Athens) was first advanced into the tumor, and then the stylet was replaced by a 16 G full-core biopsy needle (BioPince; Argon Medical Devices, Athens) through the cannula. A 17 G MWA needle (Vison or ECO) was introduced into the tumor through the cannula.
Peri-MWA management and follow-up
Complications were assessed according to the criteria from the SIR [Citation9]. Short-term follow-up with CT was conducted 1–5 d after MWA during hospitalization and 3–4 weeks after MWA at an outpatient visit to detect postprocedural complications, including pneumothorax and pleural effusion. Chest tube placement was performed for patients with moderate and severe pneumothorax or pleural effusion and was terminated when the retraction of the lung surface or pleural effusion disappeared. Long-term follow-up with CT was conducted every 2–4 months after MWA. Local progression was assessed by two experienced radiologists who were blinded to the clinical information.
Statistical analysis
As described previously [Citation18,Citation19], categorical variables are described as frequencies and percentages, and continuous variables are described as the mean ± SDs. Statistical analyses were performed using SPSS 25.0 for Windows (IBM, Somers, NY). The data of the two cohorts were compared by Student’s t-test for continuous variables and by Pearson’s chi-square test or Fisher’s exact test for categorical variables. The possible predictors for local progression were analyzed by univariate logistic regression analyses in the training cohort, including 19 parameters on demographics, treatment history, ablation factors, and radiological features. Variables with p < 0.05 in the univariate analyses were entered as candidate variables into the multivariate logistic regression analyses. Model discrimination was assessed using C-statistic. A p < 0.05 was considered to indicate statistical significance in the multivariate analyses.
The establishment of the nomogram was based on the results of multivariate analyses of the training cohort. The nomogram was constructed with the regression modeling strategies package in R (Version 3.0.2; R Project for Statistical Computing; www.r-project.org). After establishing the predictive nomogram for local progression, C-statistics and the receiver operating characteristic (ROC) curve were used to validate the accuracy and discriminative capacity of the nomogram both internally (training cohort) and externally (validation cohort). The C-statistic was calculated as the area under the ROC curve and used to evaluate the predictive ability of the risk model. The optimum cutoff value for clinical use was determined by maximizing the Youden index (sensitivity + specificity-1).
Results
Patient characteristics and clinical outcomes
A total of 304 NSCLC patients (250 in the training cohort and 54 in the validation cohort; ) received MWA in a mean follow-up of 24.9 ± 12.5 months were included. The mean tumor diameter was 2.9 ± 1.6 cm and the mean distance to pleura was 10.2 ± 10.7 mm. Detailed demographic characteristics are presented in . In addition, there are 50 (16.4%) patients who received chemotherapy, 100 (32.9%) patients who received tyrosine kinase inhibitors (TKIs), 29 (9.5%) patients who received radiotherapy, and 27 (8.9%) patients who received immune checkpoint inhibitors after MWA. A total of 88 patients (28.9%) developed pneumothorax and 18 patients (5.9%) developed pleural effusion after MWA. Of these, 40 (13.2%) patients with pneumothorax and 8 (2.6%) patients with pleural effusion received chest tube placement. The tubes were removed when the pneumothorax or/and pleural effusion disappeared and all the patients recovered. The detailed complications and clinical outcomes between the two cohorts are presented in ; a significant difference is found in local progression rate (20.8% vs. 33.3%; p = 0.047) and PFS (12.0 months vs. 11.8 months; p = 0.049). The local progression rate was 23.0% (70/304), with the meantime of 10.4 ± 8.0 months from MWA to local progression. In terms of further treatment, only 26 of 70 (37.1%) patients received further MWA, with a success rate of 17 out of 26 (65.4%).
Figure 1. The flowchart shows the patient selection. NSCLC: Non-small cell lung cancer; MWA: Microwave ablation; CT: Computed tomography.
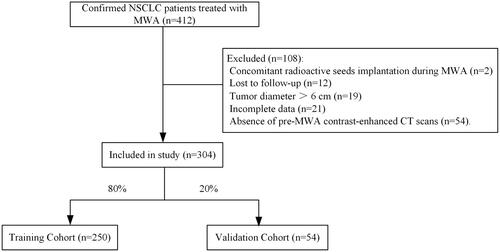
Table 1. Clinical characteristics of NSCLC patients treated with MWA.
Table 2. Clinical outcomes of NSCLC patients treated with MWA.
Predictors of local progression in the training cohort
The results of univariable and multivariable logistic regression analyses for local progression are presented in . The predictors of local progression after MWA were tumor subtypes (odds ratio [OR], 2.494; 95% confidence interval [CI], 1.415–4.396, p = 0.002), vessels ≥3 mm in direct contact with tumor (OR, 2.750; 95% CI, 1.263–5.988; p = 0.011), tumor diameter (OR, 2.252; 95% CI, 1.034–4.903; p = 0.041) and location (OR, 2.442; 95% CI, 1.201–4.965; p = 0.014).
Table 3. Univariable and multivariable logistic regression analyses for local progression after mwa in the training cohort.
Development and validation of the nomogram
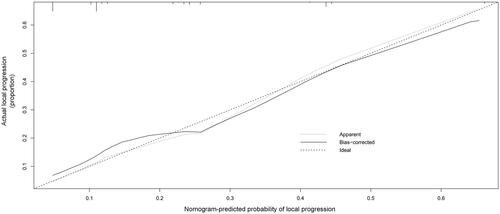
Based on the above four predictors, a nomogram was developed to make early predictions of local progression after MWA (). Based on this nomogram, the total score for each patient was calculated according to the characteristics before and/or during MWA, to predict the occurrence of local progression with risk percentages. According to the internal validation in the training cohort, the C-statistic of this nomogram was 0.7770 (95% CI, 0.707-0.848; ), while the index of external validation in the validation cohort was 0.712 (95% CI, 0.570-0.855; ). Both the internal validation and external validation showed good predictive performance. The calibration curve showed a good agreement between the prediction and observation in the probability of local progression in the training cohort ().
Figure 2. Nomogram for predicting local progression after MWA. To use the nomogram, an individual patient’s value is located on each variable axis, and a line is drawn upward to determine the number of points received for each variable value. The sum of these numbers is located on the Total Point axis, and a line is drawn downward to the risk axes to determine the likelihood of local progression.
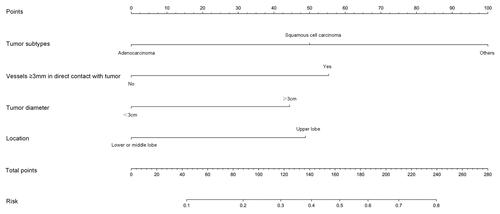
Figure 3. Receiver operating characteristic curve (ROC) analysis for the nomogram in internal and external validation. The diagonal red line represents that the index of AUC was 0.5, which was a reference value. Harrell’s C statistic was calculated as the area between the ROC curve (blue curve) and the horizontal axis. (a) The area under the curve (C-statistic) was 0.777 (95% CI, 0.707–0.848) in the training cohort for predicting local progression. (b) The area under the curve (C-statistic) was 0.712 (95% CI, 0.570–0.855) in the validation cohort for predicting local progression.
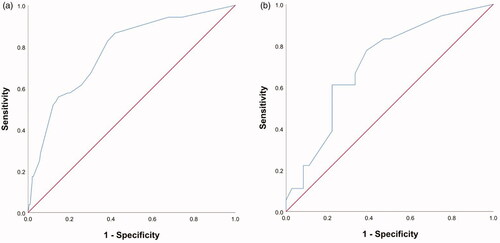
Figure 4. Calibration curve for predicting local progression after MWA in the training cohort.
The developed nomogram in clinical practice
The sensitivity and specificity for predicting local progression on this nomogram were 0.877 (95% CI, 0.820–0.918) and 0.509 (95% CI, 0.372–0.645). According to the maximized Youden index, the optimal cutoff value for the risk of local progression was 0.39. Patients with a predictive risk >0.39 according to the nomogram had a high risk of local progression ().
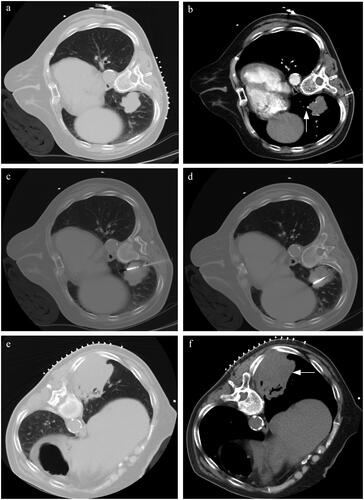
Figure 5. A typical case. (a) A patient with suspected NSCLC was admitted. The pre-MWA CT scan revealed the location and size of the lesion (4 cm in maximum tumor diameter). (b) The contrast-enhanced CT scan reveals the presence of vessels ≥3mm in direct contact with tumor (white arrow). (c,d) Synchronous coaxial-cannula biopsy and MWA were performed, with multiple adjustments of the MWA needle during the procedure. The histopathological subtype was squamous cell carcinoma. The total points for local progression on the nomogram were approximately 150 points. The estimated risk of local progression after MWA was approximately 0.44 for this patient, which indicated a high risk of local progression and was monitored by radiological reexamination. (e,f) The CT reexamination was performed every 3 months, and the local progression was detected one year after MWA (white arrow).
Discussion
The RFA is reported to induce tissue necrosis up to 5 cm and is more suitable for smaller tumors [Citation22,Citation23]. The limited size and homogeneity of tumor necrosis, combined with the effects of tumor biology, often lead to incomplete ablation. MWA has been reported as a more effective energy source than RFA, which can create a larger lesion up to 5–6 cm and reduce the residual of tumor [Citation23]. Although the best candidates for thermal ablation are patients with tumor diameter less than 3 cm [Citation5–Citation7], the efficacy of MWA has been explored in advanced stage NSCLC with a mean tumor diameter of 5 cm [Citation24]. At our institution, the combination therapy of MWA and other systemic treatments are performed for tumors exceeding 6 cm in diameter, which is excluded owing to the high suspicion of incomplete ablation. It was reported that the local control rate after thermal ablation ranges from 42-85% in the follow-up up to 5-years [Citation9], with 1, 3, 5-years local control rates of 96%, 64%, 48%, respectively, for stage I patients [Citation25], and 20.5% of local control rate for advanced-stage patients [Citation26]. This study reveals a local progression rate of 23.0%, which is comparable to that of 9–37% as reported [Citation13]. Moreover, the meantime from MWA to local progression is 10.4 ± 8.0 months and is close to that of 10.6–62.0 months as reported [Citation27,Citation28].
Tumor diameter is demonstrated to be a significant predictor of local progression after thermal ablation in lung cancer, especially for the tumor diameter exceeding 3 cm [Citation10,Citation11,Citation14,Citation29]. In a systemic review, Nelson et al. [Citation13] found the local progression rate of 5% to 19% after MWA among tumors smaller than 3 to 4 cm. The optimal stratification of tumor diameter in predicting the risk of local progression remains debatable. In 2017, Zhong et al. [Citation26] explore the effects of MWA in NSCLC patients and found a local progression rate of 20.5% in advanced-stage patients, wherein 81.3% of local progression occurred in the tumor with a diameter exceeding 3 cm. Meanwhile, another study stratified the high risk of local progression after RFA in the tumor diameter of 4 cm [Citation30]. In addition, Okuma et al. [Citation31] found 44 (32%) of 138 lung tumors in 72 patients develop local progression after thermal ablation, and identified the tumor diameter over 2 cm is a distinguished predictor. In this study, 112 (36.8%) of 304 NSCLC patients with tumor diameter exceeding 3 cm presented with a higher local progression rate, which is in accordance with the optimal stratification of tumor diameter as reported by most studies [Citation5–Citation7].
The presence of vessels >3 mm in direct contact with the ablation zone have an increased local progression rate after RFA, which is associated with the decreased coagulation necrosis in RFA [Citation32]. Blood vessels in the ablated tissue provide a conduit for heating that can occur in all approaches of thermal ablation and leads to worse local tumor control, which is called the heat-sink effect that refers to a process that limits thermal ablation due to convective tissue cooling [Citation10,Citation32]. MWA has a greater magnitude of heating a larger volume of heated tissue and better tissue penetration than RFA and is less sensitive to the heat sink effect [Citation23]. In addition, it has been suggested that multiple-tine probes and the use of ionic fluid infusion are used in RFA to decrease the heat-sink effect [Citation33]. In this study, 101 (33.2%) of 304 NSCLC patients have vessels ≥3mm in direct contact with tumor according to the pre-MWA CT scans, which presents with a high risk of local progression after MWA and is a significant predictor.
This study reveals that tumor subtypes and location are predictors of local progression after MWA, both of which have little been reported previously. The adenocarcinoma has a lower local progression rate, a potential explain was the more available treatment options for adenocarcinoma than other subtypes, including the combination therapy of chemotherapy, immunotherapy, and TKIs after MWA [Citation17]. However, some variables were not analyzed as predictors of local progression or were not selected for the nomogram. Liu et al. [Citation14] analyzed 15 unresectable NSCLC patients treated with MWA and found local progression was predominantly seen in pleural-based tumors with a diameter exceeding 30 mm. The mean minimum distance to pleura was 10.2 ± 10.7 mm in this study, which indicates a set of tumors adjacent to the pleura. The presence of a minimum 5 mm rim of GGO around tumors is regarded as a technical success for thermal ablation. Although it may facilitate microwave energy transmission to the pleura, no significant correlation with local progression was found, which is potentially due to the sufficient ablation for the subpleural tumors at our institution. Moreover, Zhong et al. [Citation26] analyzed 113 patients treated with MWA in a mean follow-up of 22.1 months and found the advanced stage patients are more vulnerable to develop the local progression after MWA, which is not identified in this study. Vogl et al. [Citation34] compared the high-frequency MWA (2450 MHz) and conventional low-frequency MWA (915 MHz) and found that the former can achieve less local progression rate (12.8% vs. 36.3%). At our institution, the high-frequency MWA systems are generally used and further investigation of frequency and local progression is unavailable. Another study focused on primary and secondary lung neoplasms up to 3 cm in diameter and observed the irregular tumor shape as a predictor of local progression [Citation16]. It seems that radiological features are associated with tumor local control after MWA. Recently, Markich et al. [Citation35] explored radiomics for predicting the local progression after RFA in colorectal cancer lung metastases. They extracted 64 radiomics features on pre-RFA CT images and found 4 features are independent predictors of local progression. Nevertheless, whether the radiomics could complement the clinical and technical features to predict the local progression after thermal ablation in NSCLC patients remains unclear.
Based on the results of univariable and multivariable analyses, a predictive nomogram model was established to predict local progression after MWA. The data from the training cohort as internal validation and data from the validation cohort as external validation were used to validate the accuracy of this nomogram. The C-statistic values provided sufficient predictive accuracy in both cohorts, which indicated the high accuracy of the nomogram. According to the maximized Youden index, the cutoff value for local progression risk was 0.39, which signifies sufficient predictive accuracy. The nomogram can be applied to identify NSCLC patients who may develop local progression after MWA, and they may be helpful for stratifying the risk of local progression and decision-making regarding further surveillance and/or interventions.
However, this study has several limitations. First, this was a retrospective study; thus, patient selection bias may exist. Second, although a validation cohort was established and showed high accuracy for predictive performance, external validation from other datasets is warranted. Third, although the mean follow-up was 24.9 ± 12.5 months, a longer follow-up is warranted. Fourth, the correlation between radiomics based on the CT images before MWA and local progression may exist potentially, which should be investigated in a further study.
In conclusion, tumor subtypes, vessels ≥3 mm in direct contact with the tumor, tumor diameter, and location were predictors of local progression after MWA in NSCLC patients. The nomogram model could effectively predict the risk of local progression after MWA. Patients showing a high risk (>0.39) on the nomogram should be monitored for local progression.
Disclosure statement
No potential conflict of interest was reported by the author(s).
Additional information
Funding
References
- Sung H, Ferlay J, Siegel RL, et al. Global cancer statistics 2020: GLOBOCAN estimates of incidence and mortality worldwide for 36 cancers in 185 countries. CA A Cancer J Clin. 2021;71(3):209–249.
- Cao W, Chen HD, Yu YW, et al. Changing profiles of cancer burden worldwide and in China: a secondary analysis of the global cancer statistics 2020. Chin Med J. 2021;134(7):783–791.
- Chen W, Zheng R, Baade PD, et al. Cancer statistics in China, 2015. CA Cancer J Clin. 2016;66(2):115–132.
- Mazzone P. Preoperative evaluation of the lung resection candidate. Cleve Clin J Med. 2012;79 Electronic Suppl 1(Electronic Suppl 1):eS17–22.
- National Comprehensive Cancer Network (NCCN). 2021. Clinical practice guidelines in oncology. Non-small cell lung cancer, version 2. [cited 15 Dec 2020]. Available from: www.nccn.org/patients
- Postmus PE, Kerr KM, Oudkerk M, et al. Early and locally advanced non-small-cell lung cancer (NSCLC): ESMO clinical practice guidelines for diagnosis, treatment and follow-up. Ann Oncol. 2017;28(suppl_4):iv1–21.
- Donington J, Ferguson M, Mazzone P, et al. American College of Chest Physicians and Society of Thoracic Surgeons consensus statement for evaluation and management for high-risk patients with stage I non-small cell lung cancer. Chest. 2012;142(6):1620–1635.
- Macchi M, Belfiore MP, Floridi C, et al. Radiofrequency versus microwave ablation for treatment of the lung tumours: LUMIRA (lung microwave radiofrequency) randomized trial. Med Oncol. 2017;34(5):96.
- Genshaft SJ, Suh RD, Abtin F, et al. Society of interventional radiology quality improvement standards on percutaneous ablation of non-small cell lung cancer and metastatic disease to the lungs. J Vasc Interv Radiol. 2021;32(8):1242.e1–1242.e10.
- Hiraki T, Sakurai J, Tsuda T, et al. Risk factors for local progression after percutaneous radiofrequency ablation of lung tumors: evaluation based on a preliminary review of 342 tumors. Cancer-Am Cancer Soc. 2006;107(12):2873–2880.
- Palussiere J, Lagarde P, Auperin A, et al. Percutaneous lung thermal ablation of non-surgical clinical N0 non-small cell lung cancer: results of eight years’ experience in 87 patients from two centers. Cardiovasc Intervent Radiol. 2015;38(1):160–166.
- Hiraki T, Gobara H, Iguchi T, et al. Radiofrequency ablation for early-stage nonsmall cell lung cancer. Biomed Res Int. 2014;2014:152087.
- Nelson DB, Tam AL, Mitchell KG, et al. Local recurrence after microwave ablation of lung malignancies: a systematic review. Ann Thorac Surg. 2019;107(6):1876–1883.
- Liu H, Steinke K. High-powered percutaneous microwave ablation of stage I medically inoperable non-small cell lung cancer: a preliminary study. J Med Imaging Radiat Oncol. 2013;57(4):466–474.
- Lu DS, Raman SS, Vodopich DJ, et al. Effect of vessel size on creation of hepatic radiofrequency lesions in pigs: assessment of the “heat sink” effect. AJR Am J Roentgenol. 2002;178(1):47–51.
- Vogl TJ, Worst TS, Naguib NN, et al. Factors influencing local tumor control in patients with neoplastic pulmonary nodules treated with microwave ablation: a risk-factor analysis. AJR Am J Roentgenol. 2013;200(3):665–672.
- Xu S, Qi J, Li B, et al. Survival prediction for non-small cell lung cancer patients treated with CT-guided microwave ablation: development of a prognostic nomogram. Int J Hyperthermia. 2021;38(1):640–649.
- Xu S, Qi J, Li B, et al. Risk prediction of pneumothorax in lung malignancy patients treated with percutaneous microwave ablation: development of nomogram model. Int J Hyperthermia. 2021;38(1):488–497.
- Xu S, Qi J, Li B, et al. Risk prediction of pleural effusion in lung malignancy patients treated with CT-guided percutaneous microwave ablation: a nomogram and artificial neural network model. Int J Hyperthermia. 2021;38(1):220–228.
- Lim W, Ridge CA, Nicholson AG, et al. The 8th lung cancer TNM classification and clinical staging system: review of the changes and clinical implications. Quant Imaging Med Surg. 2018;8(7):709–718.
- Xu S, Bie ZX, Li YM, et al. A comparative study of cavitary and noncavitary non-small cell lung cancer patients treated with CT-guided microwave ablation. J Vasc Interv Radiol. 2021;32(8):1170–1178.
- Zhu JC, Yan TD, Morris DL. A systematic review of radiofrequency ablation for lung tumors. Ann Surg Oncol. 2008;15(6):1765–1774.
- Brace CL, Hinshaw JL, Laeseke PF, et al. Pulmonary thermal ablation: comparison of radiofrequency and microwave devices by using gross pathologic and CT findings in a swine model. Radiology. 2009;251(3):705–711.
- Pusceddu C, Melis L, Sotgia B, et al. Usefulness of percutaneous microwave ablation for large non-small cell lung cancer: a preliminary report. Oncol Lett. 2019;18(1):659–666.
- Yang X, Ye X, Zheng A, et al. Percutaneous microwave ablation of stage I medically inoperable non-small cell lung cancer: clinical evaluation of 47 cases. J Surg Oncol. 2014;110(6):758–763.
- Zhong L, Sun S, Shi J, et al. Clinical analysis on 113 patients with lung cancer treated by percutaneous CT-guided microwave ablation. J Thorac Dis. 2017;9(3):590–597.
- Ni X, Han JQ, Ye X, et al. Percutaneous CT-guided microwave ablation as maintenance after first-line treatment for patients with advanced NSCLC. Onco Targets Ther. 2015;8:3227–3235.
- Healey TT, March BT, Baird G, et al. Microwave ablation for lung neoplasms: a retrospective analysis of long-term results. J Vasc Interv Radiol. 2017;28(2):206–211.
- Wolf FJ, Grand DJ, Machan JT, et al. Microwave ablation of lung malignancies: effectiveness, CT findings, and safety in 50 patients. Radiology. 2008;247(3):871–879.
- Huang L, Han Y, Zhao J, et al. Is radiofrequency thermal ablation a safe and effective procedure in the treatment of pulmonary malignancies? Eur J Cardiothorac Surg. 2011;39(3):348–351.
- Okuma T, Matsuoka T, Yamamoto A, et al. Determinants of local progression after computed tomography-guided percutaneous radiofrequency ablation for unresectable lung tumors: 9-year experience in a single institution. Cardiovasc Intervent Radiol. 2010;33(4):787–793.
- Gillams AR, Lees WR. Radiofrequency ablation of lung metastases: factors influencing success. Eur Radiol. 2008;18(4):672–677.
- Lee JM, Youk JH, Kim YK, et al. Radio-frequency thermal ablation with hypertonic saline solution injection of the lung: ex vivo and in vivo feasibility studies. Eur Radiol. 2003;13(11):2540–2547.
- Vogl TJ, Roman A, Nour-Eldin NA, et al. A comparison between 915 MHz and 2450 MHz microwave ablation systems for the treatment of small diameter lung metastases. Diagn Interv Radiol. 2018;24(1):31–37.
- Markich R, Palussiere J, Catena V, et al. Radiomics complements clinical, radiological, and technical features to assess local control of colorectal cancer lung metastases treated with radiofrequency ablation. Eur Radiol. 2021. Online ahead of print.