
Abstract
Purpose
To discuss the possible reasons why percutaneous intratumoral ethanol injection (PEI) combined with radiofrequency ablation (RFA) to treat hepatocellular carcinoma (HCC) reduced the recurrence and metastasis compared with RFA alone.
Materials and methods
Forty VX2 tumor-bearing rabbits were randomly divided into four groups (n = 10): the PEI, RFA, PEI-RFA, and control groups. Five rabbits from each group were sacrificed on the 3rd and 7th days after ablation. The number of metastatic tumors in the lung was counted. The ablation volume was measured, and residual tumor specimens were prepared for hematoxylin and eosin staining and caspase-3, Ki-67, and VEGF immunohistochemical staining.
Results
The volume of ablation in the PEI-RFA group was significantly larger than that in the RFA and PEI groups (p < 0.05). However, no significant differences in the number of lung metastases after ablation were observed among the groups (p > 0.05). The number of microthrombi in the PEI-RFA group was greater than that in the control and RFA groups (p < 0.001 and p < 0.05). The Ki-67 labeling index (LI) and H-score of VEGF in the PEI-RFA group were lower than those in the RFA group, while the H-score of caspase-3 was higher than that in the RFA group on the 7th day after ablation (p < 0.05).
Conclusion
PEI occluded blood vessels by inducing microthrombi formation, and thereby reducing heat dissipation and increasing the effect of RFA. More importantly, in comparison with an incomplete RFA, PEI-RFA inhibited the increase in the Ki-67 and VEGF expression levels and the decrease in the caspase-3 expression level to happen at some extent and therefore improved the prognosis.
Introduction
Percutaneous intratumoral ethanol injection (PEI) combined with radiofrequency ablation (RFA) has been used clinically to treat hepatocellular carcinoma (HCC) for many years. Many clinical and experimental studies have consistently shown that PEI combined with RFA (PEI-RFA) could reduce the heat-sink effect and generate a larger ablation volume, with an increase of the complete ablation rate and a decrease of the local and overall recurrence rates in comparison with RFA alone [Citation1–Citation2]. Chen et al. demonstrated that PEI-RFA achieved equivalent survival outcomes as of the repeated hepatectomy in elderly patients with recurrent HCC [Citation3]. Huang et al. revealed that PEI-RFA is safe and effective in the treatment of medium and large-sized HCCs with a high rate of local tumor control [Citation4]. However, the specific mechanism of PEI enhanced RFA therapeutic efficacy is poorly understood.
Tumor size is one of the important predictive factors affecting treatment outcomes of HCC after RFA [Citation5]. Results of RFA therapy in HCC tumors large than 3 cm are often less favorable since it is difficult to reach sufficiently high temperatures further away from the heat source. Moreover, the abundant blood supply of HCC may help to dissipate the thermal energy and weaken the ablation effect, therefore induced tumor cells remnant. Thus, in clinical practice, the completed RFA was defined as no living cells existed in the ablation area, while incompletely RFA was defined as the living tumor cells or even macroscopic tumor could be found in the ablation area. Cumulative evidence has demonstrated that incomplete RFA, as a thermal stimulus, may promote the proliferation of residual tumor cells, anti-apoptosis, and angiogenesis thereby induce a rapid tumor progression [Citation6–8]. In contrast to RFA, PEI is a method of chemical ablation that causes cellular dehydration, protein denaturation, and vascular thrombosis within the treated tumor [Citation9–Citation10]. Moreover, it has been reported that acute ethanol exposure could inhibit IL-6 production, which might indirectly reduce the expression of VEGF [Citation11]. Thus, different from RFA, PEI-RFA theoretically produces different biological effects in residual tumors. However, concerning PEI-RFA in the clinical setting, most studies had focused on the outcome parameters and were observational. Therefore, the true effects of PEI-RFA in HCC remain unclear. In particular, the impacts of PEI-RFA on tumor cell survival, proliferation, angiogenesis, and invasion, have not been reported and require further study.
Therefore, we studied the therapeutic results of rabbits VX2 liver tumor models treated with different ablation methods of PEI, RFA, and PEI-RFA. The study items were the ablation area, microthrombi formation, cell proliferation, cell apoptosis, and tumor angiogenesis in the residual tumors, for the purpose to find out the reason PEI-RFA promotes local efficacy and to provide a theoretical evidence in the application of PEI-RFA.
Materials and methods
Establishment of the VX2 liver tumor model
The study protocol was approved by the Ethical Committee of Sun Yat-sen University, China. All the animal experiments complied with the standard ethical guidelines prescribed by the ethical committees mentioned above. Samples of tumor tissue were first collected through a 16-gauge biopsy needle from tumor-bearing rabbits under the guidance of ultrasound and then placed into an 18-gauge needle together with a gelatin sponge. The tumor tissue was then implanted into the left hepatic lobe of New Zealand rabbits (2.5 ∼ 3.5 kg, either sex), pushed by a homemade needle core under the guidance of ultrasound.
Ablation therapy
The tumor-bearing rabbits were randomly divided into four groups when their tumors reached 1.5 cm in diameter: PEI, RFA, PEI-RFA, and the control group (n = 10). The PEI group was intratumorally injected with ethanol (0.5 ml per rabbit) using a 21-gauge PTC needle under the guidance of ultrasound. The RFA group underwent RFA treatment by a 17-gauge hollow cooling cool-tip electrode with 1 cm exposed upfront. The power output was 8–10 W with a duration of 2 min. For the PEI-RFA group, RFA treatment was performed 2 min after PEI (the rest of the RFA procedure remained the same). The control group was given sham treatment (puncture needle injected without electricity or ethanol). Five to ten minutes after the ablation, contrast-enhanced ultrasound (CEUS) was performed, and the longitudinal diameter (a) and latitudinal diameter (b) were recorded. The ablation volume was calculated using the formula: V = a × b2/2.
Gross pathological and immunohistochemical analysis
Five rabbits from each group were sacrificed on the 3rd and 7th days after ablation. The livers and lungs were harvested, and the number and size of the masses were noted. The tumors were fixed with 4% paraformaldehyde and made into paraffin sections. The histopathological changes were observed, and microthrombi were counted after HE staining Ki-67, caspase-3, vascular endothelial growth factor (VEGF), and IL-6 staining were performed in the residual tumor following the instructions of the manufacturer. Then, all slides were observed and scored.
To assess Ki-67, five randomly selected high-magnification fields (20 × objective) were analyzed per slide. The number of Ki-67-positive cells and total cells were counted per field of view using Image-Pro Plus software. The LI (labeling index) was calculated using the formula LI = positive cell number/total cell number × 100%. To assess the expression of caspase-3, VEGF, and IL-6, the intensities of the positively stained cells were quantified in each of five randomly selected fields by ImageJ software (20 × objective). The staining intensity was graded as 0 (no staining), 1 (weak positive), 2 (moderately positive), and 3 (strong positive). The percentage of stained tumor cells for each intensity (varying from 0 to 100%) was also calculated. The H-score was calculated using the following equation: H-SCORE = ΣPi (i + 1), where i is the value of staining intensity and Pi is the percentage of stained tumor cells. Microthrombi were histologically quantified by counting the total number of microthrombi in 50 consecutive high-magnification fields (40× objective) in each section of the residual area around the ablation zone and the number of microthrombi per unit area (/mm2) was calculated.
Statistical analysis
Statistical analysis was performed using GraphPad Prism version 7.0. Continuous data were expressed as means ± standard deviation (SD). One-way ANOVA and Tukey’s multiple comparisons test were used to compare the differences among different groups. The differences between the two time points were determined by Student’s t-test. p < 0.05 was considered significant.
Results
The rate of liver tumor formation rate in rabbits was 89.8%. The mean tumor volume was 0.06 ± 0.01 cm3 on the 7th day after tumor was implanted, and on the 21st day, the mean diameter of the tumor was 1.4 ± 0.3 cm. The ablation volume in the PEI-RFA group was significantly larger than that in the RFA and PEI groups (p < 0.05) (). However, no significant differences were observed in the number of lung metastases after ablation between the groups (p > 0.05) ().
Figure 1. Changes in the ablation volume of the VX2 rabbit tumors. *p < 0.05, **p < 0.01 versus RFA group at the same time point; ##p < 0.01 versus PEI group at the same time point. Bars represent the standard deviation (n = 5).
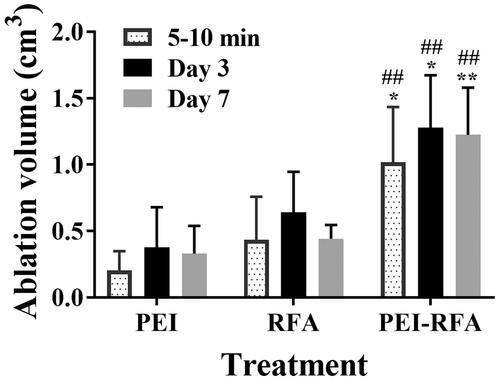
Table 1. The number of lung metastases in each group.
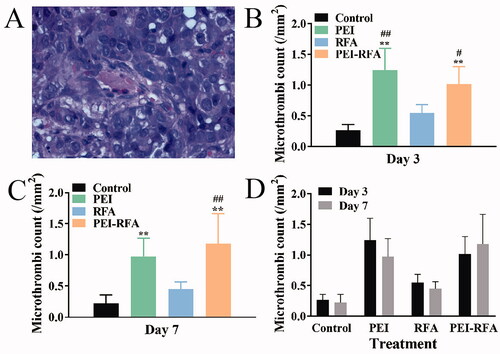
The counts number of microthrombi (/mm2) on the 3rd day after ablation in the control, RFA, PEI, and PEI-RFA groups were 0.26 ± 0.09, 1.24 ± 0.36, 0.55 ± 0.13, and 1.02 ± 0.28, respectively. The number of microthrombi was significantly increased in the PEI-RFA group compared with the control and RFA groups, but there was no difference compared with the PEI group. On the 7th day after ablation, the number of microthrombi in the control, RFA, PEI, and PEI-RFA groups were 0.22 ± 0.14, 0.98 ± 0.29, 0.45 ± 0.11, and 1.18 ± 0.48, respectively. There was a significant increase in the number of microthrombi in the PEI-RFA group compared with the control and RFA groups (p < 0.05). However, the number of microthrombi remained slightly higher than the PEI group without statistical significance (p > 0.05). There was no significant difference in the number of microthrombi in each group at different time points (p > 0.05) ().
Figure 2. The number of microthrombi (/mm2) in each group. (A) HE staining shows microthrombi (400×); The comparison of microthrombi per unit area among groups 3 d (B) and 7 d (C) after treatment (**p < 0.01 versus control group; #p < 0.05, ##p < 0.01 versus RFA group); (D) The comparison between a different time for the same treatment. Bars represent the standard deviation (n = 5).
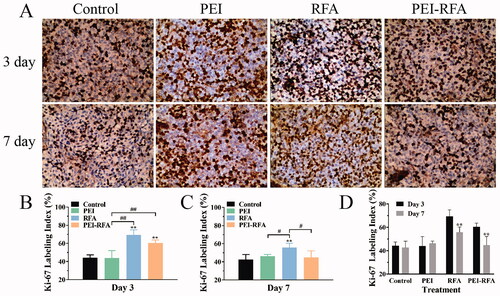
The LI of Ki-67 on the 3rd day after ablation in the control, PEI, RFA, and PEI-RFA group was 44.2 ± 3.2%, 43.9 ± 8.1%, 69.3 ± 5.7%, and 60.5 ± 3.3%, respectively. Ki-67 expression increased in both of RFA and PEI-RFA groups, however, the Ki-67 expression in the PEI-RFA group was lower than that in the RFA group (p > 0.05). On the 7th day, the LI of Ki-67 in the control, PEI, RFA, and PEI-RFA group was 42.8 ± 5.4%, 46.3 ± 1.91, 55.8 ± 4.6%, and 44.8 ± 7.4%, respectively. A remarkable increase in Ki-67 expression was observed in the RFA group compared with the other groups (p < 0.05). In the RFA and the PEI-RFA group, the expression of Ki-67 on day 7 was lower than that on day 3 (p < 0.01). There was no significant difference in Ki-67 expression between the control and PEI groups at different time points (p > 0.05) ().
Figure 3. The changes in Ki-67 expression in each group. (A) HE staining shows expression levels of Ki-67, the dark brown color indicates positive staining of Ki-67 (200×); (B) The comparison of Ki-67 labeling index among groups 3 d (B) and 7 d (C) after treatment (**p < 0.01 versus control group; #p < 0.05, ##p < 0.01 versus between groups); (D) The comparison between a different time for the same treatment (**p < 0.01). Bars represent the standard deviation (n = 5).
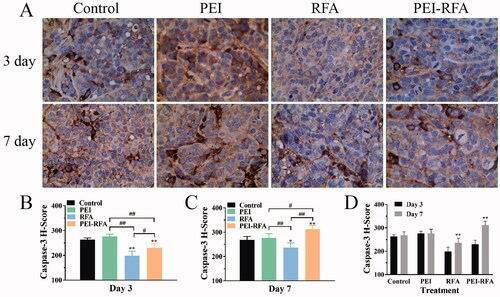
The H-scores of caspase-3 on the 3rd day after ablation in the control, PEI, RFA, and PEI-RFA group were 263.7 ± 6.8, 276.3 ± 9.2, 198.7 ± 18.4, and 230.0 ± 16.7, respectively. The expression of caspase-3 in the PEI-RFA group was significantly higher than that in the RFA group (p<0.05) but lower than that in the control and PEI groups (p<0.05). On day 7, the H-scores of caspase-3 in the control, PEI, RFA, and PEI-RFA group were 268.6 ± 14.1, 276.4 ± 17.7, 236.6 ± 19.2, and 312.0 ± 16.0, respectively. In comparison with day 3, the caspase-3 level in the RFA group and PEI-RFA group was significantly increased. However, the level of caspase-3 in the RFA group was lower than that in the other three groups. The highest expression level of caspase-3 was found in the PEI-RFA group ().
Figure 4. The changes in caspase-3 expression in each group. (A) HE staining shows expression levels of caspase-3, the cytoplasm was strongly stained as brown-yellow, moderately stained as dark yellow, and weakly stained as light yellow (400×); The comparison of caspase-3 H-score among groups 3 d (B) and 7 d (C) after treatment (*p < 0.05, **p < 0.01 versus control group; #p < 0.05, ##p < 0.01 versus between groups); (D) The comparison between a different time for the same treatment (**p < 0.01). Bars represent the standard deviation (n = 5).
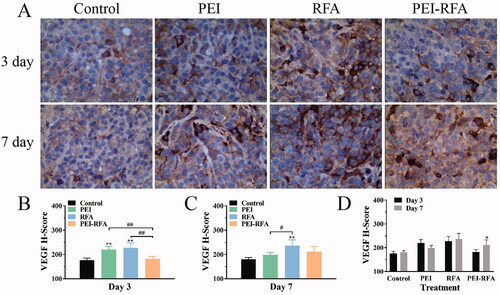
The H-scores of VEGF on the 3rd day after ablation in the control group, PEI group, RFA group and PEI-RFA group was 176.4 ± 8.6, 220.0 ± 14.3, 227.6 ± 20.3, and 182.3 ± 9.6, respectively. The expression of VEGF in the PEI-RFA group was significantly lower than that in the PEI and RFA groups (p < 0.05), but there was no significant difference compared with the control group (p > 0.05). On day 7, the H-scores of VEGF in the control, PEI, RFA, and PEI-RFA group were 180.4 ± 6.9, 198.4 ± 10.3, 236.6 ± 24.1, and 211.6 ± 21.5, respectively. On day 7, VEGF expression increased in the PEI-RFA group, but it was lower than that in the RFA group. There was also a slight, nonsignificant increase in VEGF level in the RFA group on day 7. VEGF expression in the RFA group was notably higher than that in the control and PEI groups (p < 0.05) ().
Figure 5. The changes in VEGF expression in each group. (A) HE staining shows expression levels of VEGF, the cytoplasm was strongly stained as brown-yellow, moderately stained as dark yellow, and weakly stained as light yellow (400×); The comparison of VEGF H-score among groups 3 d (B) and 7 d (C) after treatment (**p < 0.01 versus control group; #p < 0.05, ##p < 0.01 versus between groups); (D) The comparison between a different time for the same treatment (*p < 0.05). Bars represent the standard deviation (n = 5).
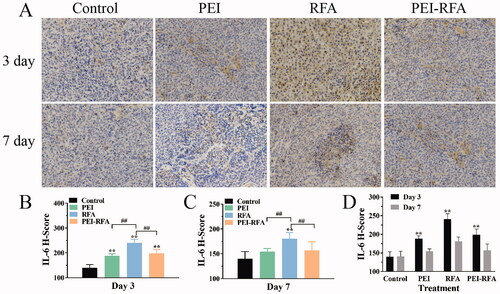
The H-scores of IL6 on the 3rd day after ablation in the control, PEI, RFA, and PEI-RFA group was 139.8 ± 13.2, 188.3 ± 8.0, 240.6 ± 14.8, and 198.5 ± 15.6, respectively. The expression of IL-6 in the PEI-RFA group was significantly higher than that in the control group (p < 0.05), slightly higher than that in the PEI group (p > 0.05), but lower than that in the RFA groups (p < 0.05). On day 7, the H-scores of IL-6 in the control, PEI, RFA, and PEI-RFA group were 140.2 ± 14.2, 154.5 ± 6.4, 180.7 ± 12.1, and 156.9 ± 17.3, respectively. The expression of IL-6 in the PEI-RFA group at day 7 decreased compared with the 3rd day after ablation, and significantly lower than that in the RFA group (p < 0.05), but no significant statistical difference was observed compared with the control and PEI groups (p > 0.05) ().
Figure 6. The changes in IL-6 expression in each group. (A) HE staining shows expression levels of IL-6, the cytoplasm was strongly stained as brown-yellow, moderately stained as dark yellow, and weakly stained as light yellow (200×); The comparison of IL-6 H-score among groups 3 d (B) and 7 d (C) after treatment (**p < 0.01 versus control group; ##p < 0.01 versus between groups); (D) The comparison between a different time for the same treatment (**p < 0.05). Bars represent the standard deviation (n = 5).
Discussion
In our study, PEI-RFA achieved a larger ablation area, consistent with prior studies [Citation12]. More importantly, we found that there was an increase in the number of microthrombi in the PEI-RFA group compared with the RFA group and PEI group. This finding provided direct evidence for to support the hypothesis that the increase in the number of microthrombi might be the reason to achieve a larger ablation volume after PEI-RFA. Ethanol has been reported to be a strong protein coagulant that causes vascular endothelial injury and platelet cohesion, resulting in a permanent occlusion of tumor-feeding vessels and tumor infarction [Citation10,Citation13]. Consistent with this, more thrombi were observed together with an enlarged ablation area in the PEI-RFA group. A safety margin has been reported to be one of the most important factors that affect recurrences after RFA [Citation14]. An enlarged ablation zone with a wider safety margin induced by RFA-PEI may lead to a better local tumor control.
Tumor angiogenesis is another crucial step in the growth and metastasis of tumor [Citation15]. Vascular endothelial growth factor (VEGF), which regulates angiogenesis and vascular permeability, is now believed to contribute to tumorigenesis and metastasis [Citation16–Citation17]. Previous studies have revealed that incomplete RFA of HCC could activate the HIF/VEGF pathway to mediate malignant transition [Citation8,Citation18]. In the present study, it was shown that the expression of VEGF in the RFA group increased remarkably, which was similar to the findings reported previously. Interestingly, we found that PEI combined with RFA efficiently inhibited VEGF expression. Ethanol has been reported to be an immunomodulation drug that can significantly impact patient clinical courses [Citation19]. Scalfani et al. revealed that acute ethanol exposure could inhibit IL-6 production [Citation20]. IL-6 regulates the expression of VEGFA by increasing the expression, nuclear translocation, and transcription activities of HIF-1α [Citation11, Citation21]. Moreover, the reduced levels of VEGF might be due to the dehydration and necrosis of tumor cells after PEI. We believe that these are potential explanations for the lower VEGF level in the PEI-RFA group compared to the other groups. These data suggest that PEI-RFA could impair the expression of VEGF to inhibit tumor growth and metastasis.
It was found in the present study that after incomplete RFA, Ki-67 expression was increased, while caspase-3 expression was decreased, indicating that residual tumors cells are more aggressive. These observations are consistent with those that were previously reported in the literature. Importantly, we found that in the PEI-RFA group, the caspase-3 level was higher, and the Ki-67 level was lower in comparison with the incomplete RFA group, suggesting that combined treatment could be more effective in the inhibition of cancer cell proliferation, as well as in the inducement cell apoptosis. There might be several underlying reasons for this. Firstly, the hyperthermic temperature triggered both the extrinsic and intrinsic apoptotic pathways in tumor cells [Citation12]. The destruction of intratumoral blood vessels by PEI inhibited the cooling effect of circulating blood, which attenuated energy loss during RFA and improved the thermal conduction by minimizing a carbonization zone around the electrode with the ethanol, finally inducing more cell thermal damage and apoptosis. Secondly, ischemia and hypoxia are the main factors leading to apoptosis [Citation22]. Ethanol-induced occlusion of microvessels aggravated the ischemia and hypoxia in the tumor and facilitated cell apoptosis. Thus, caspase-3 expression was higher in the PEI-RFA group than in the RFA group. Thirdly, after incomplete RFA, hypoxia in the residual tumor induces the secretion of the proangiogenic factor VEGF, resulting in angiogenesis, which facilitates tumor cell proliferation [Citation8,Citation23]. Moreover, overexpression of VEGF promotes tumor evasion from immune surveillance [Citation24–Citation25]. In the present study, the expression level of VEGF significantly decreased in the PEI-RFA group on day 3 and remained at a relatively low level on day 7, compared with the RFA group, suggesting that PEI combined with RFA might inhibit cell proliferation and enhance antitumor immune responses by inhibiting VEGF signaling. Overall, RFA-PEI may lead to a better local tumor control with the complete ablation of the targeted tumor with the effective inhibition of VEGF expression.
In view of the distant recurrence, no significant difference was observed between the groups. In the early stage after RFA, the activating effect of RFA on the immune system might inhibit distant metastasis. Moreover, the sample size of our study is small. Thus, in terms of distant recurrence, no significant difference in distant recurrence was observed between these groups.
There were several limitations in our study. First, tumor progression or overall survival after treatment was not monitored. Second, semi-quantitative IHC was employed to reveal the expression of all the indicators. This single method was not enough to solve all the problems, and the acquired data were lack of precision. Third, limited by a lack of equipment, the change of temperature in the tumor sites during the ablation was not monitored.
Conclusion
In the present study, we confirmed that microthrombi formation and resultant occlusion of blood vessels by PEI might be a mechanism for PEI enhancing the effect of RFA to ablate the tumors. More importantly, cell proliferation, anti-apoptosis, and angiogenesis increased in the residual tumor for a brief period after incomplete RFA, which manifested as an increase in Ki-67 expression levels and a decrease in the caspase-3 expression level. However, the PEI-RFA inhibited the changes of the above indicators to some extent in comparison with the incomplete RFA and it might therefore improve the patients’ prognosis.
Disclosure statement
No potential conflict of interest was reported by the author(s).
Additional information
Funding
References
- Goldberg SN, Kruskal JB, Oliver BS, et al. Percutaneous tumor ablation: increased coagulation by combining radio-frequency ablation and ethanol instillation in a rat breast tumor model. Radiology. 2000;217(3):827–831.
- Chen S, Peng Z, Lin M, et al. Combined percutaneous radiofrequency ablation and ethanol injection versus hepatic resection for 2.1–5.0 cm solitary hepatocellular carcinoma: a retrospective comparative multicentre study. Eur Radiol. 2018;28(9):3651–3660.
- Chen S, Peng Z, Xiao H, et al. Combined radiofrequency ablation and ethanol injection versus repeat hepatectomy for elderly patients with recurrent hepatocellular carcinoma after initial hepatic surgery. Int J Hyperthermia. 2018;34(7):1029–1037.
- Huang G, Lin M, Xie X, et al. Combined radiofrequency ablation and ethanol injection with a multipronged needle for the treatment of medium and large hepatocellular carcinoma. Eur Radiol. 2014;24(7):1565–1571.
- Yagi R, Midorikawa Y, Moriguchi M, et al. Liver resection for recurrent hepatocellular carcinoma to improve survivability: a proposal of indication criteria. Surgery. 2018;163(6):1250–1256.
- Zeng J, Cai X, Hao X, et al. LncRNA FUNDC2P4 down-regulation promotes epithelial-mesenchymal transition by reducing E-cadherin expression in residual hepatocellular carcinoma after insufficient radiofrequency ablation. Int J Hyperthermia. 2018;34(6):802–811.
- Su T, Liao J, Dai Z, et al. Stress-induced phosphoprotein 1 mediates hepatocellular carcinoma metastasis after insufficient radiofrequency ablation. Oncogene. 2018;37(26):3514–3527.
- Tan L, Chen S, Wei G, et al. Sublethal heat treatment of hepatocellular carcinoma promotes intrahepatic metastasis and stemness in a VEGFR1-dependent manner. Cancer Lett. 2019;460:29–40.
- Mahnken AH, Bruners P, Günther RW. Local ablative therapies in HCC: percutaneous ethanol injection and radiofrequency ablation. Dig Dis. 2009;27(2):148–156.
- Festi D, Monti F, Casanova S, et al. Morphological and biochemical effects of intrahepatic alcohol injection in the rabbit. J Gastroenterol Hepatol. 1990;5(4):402–406.
- Sarc L, Wraber B, Lipnik-Stangelj M. Ethanol and acetaldehyde disturb TNF-alpha and IL-6 production in cultured astrocytes. Hum Exp Toxicol. 2011;30(9):1256–1265.
- Kurokohchi K, Watanabe S, Masaki T, et al. Combined use of percutaneous ethanol injection and radiofrequency ablation for the effective treatment of hepatocelluar carcinoma. Int J Oncol. 2002;21(4):841–846.
- Lee MJ, Mueller PR, Dawson SL, et al. Percutaneous ethanol injection for the treatment of hepatic tumors: indications, mechanism of action, technique, and efficacy. AJR Am J Roentgenol. 1995;164(1):215–220.
- Shady W, Petre EN, Gonen M, et al. Percutaneous radiofrequency ablation of colorectal cancer liver metastases: factors affecting outcomes–a 10-year experience at a single center. Radiology. 2016;278(2):601–611.
- Chen H, Campbell RA, Chang Y, et al. Pleiotrophin produced by multiple myeloma induces transdifferentiation of monocytes into vascular endothelial cells: a novel mechanism of tumor-induced vasculogenesis. Blood. 2009;113(9):1992–2002.
- Goel HL, Mercurio AM. VEGF targets the tumour cell. Nat Rev Cancer. 2013;13(12):871–882.
- Ferrara N, Gerber HP, LeCouter J. The biology of VEGF and its receptors. Nat Med. 2003;9(6):669–676.
- Cheng J, Li M, Lv Y. Sublethal heat treatment promotes epithelial-mesenchymal transition and enhances the malignant potential of hepatocellular carcinoma. Hepatology. 2014;59(4):1650.
- Le Daré B, Lagente V, Gicquel T. Ethanol and its metabolites: update on toxicity, benefits, and focus on immunomodulatory effects. Drug Metab Rev. 2019;51(4):545–561.
- Goral J, Choudhry MA, Kovacs EJ. Acute ethanol exposure inhibits macrophage IL-6 production: role of p38 and ERK1/2 MAPK. J Leukoc Biol. 2004;75(3):553–559.
- Mirkeshavarz M, Ganjibakhsh M, Aminishakib P, et al. Interleukin-6 secreted by oral cancer- associated fibroblast accelerated VEGF expression in tumor and stroma cells. Cell Mol Biol. 2017;63(10):131–136.
- Xin W, Zhang M, Yu Y, et al. BCAT1 binds the RNA-binding protein ZNF423 to activate autophagy via the IRE1-XBP-1-RIDD axis in hypoxic PASMCs. Cell Death Dis. 2020;11(9):764.
- Nicolas S, Abdellatef S, Haddad MA, et al. Hypoxia and EGF stimulation regulate VEGF expression in human glioblastoma multiforme (GBM) cells by differential regulation of the PI3K/Rho-GTPase and MAPK pathways. Cells. 2019;8(11):1397.
- Hato T, Zhu AX, Duda DG. Rationally combining anti-VEGF therapy with checkpoint inhibitors in hepatocellular carcinoma. Immunotherapy. 2016;8(3):299–313.
- Gabrilovich D, Ishida T, Oyama T, et al. Vascular endothelial growth factor inhibits the development of dendritic cells and dramatically affects the differentiation of multiple hematopoietic lineages in vivo. Blood. 1998;92(11):4150–4166.