
Abstract
Purpose
To study the correlation between the overall coagulation zone (A) attained in percutaneous microwave ablation (MWA) of hepatocellular carcinomas (HCC) and: (1) the hyperdense zone (C) visible in the central part of zone A on post-treatment unenhanced CT scans; (2) the deposited energy; (3) the coagulation zones observed on ex-vivo bovine liver.
Materials and methods
The post-procedural computed tomography (CT) scans of HCCs treated with a single energy deployment through the same 2450 MHz MWA system were retrospectively analyzed, retrieving the dimensions of A and C zones and the deposited energy (E). Ex-vivo bovine liver MWA with the same system were performed and analyzed to determine the same quantities by gross-pathologic examination and CT imaging.
Results
A total of 101 HCC treatments were analyzed. The average coagulation volumes increased linearly with deposited energy (1.11 cc/kJ, R2 = 0.90, 4.2 kJ ≤ E ≤ 48 kJ), similarly to ex-vivo findings (1.38 cc/kJ, R2 =0.97, 7.2 kJ ≤ E ≤ 144 kJ). The long axis (L) and short axis (D) of zones A and C held a fairly constant ratio both in-vivo (LC/LA=0.43 ± 0.13; DC/DA=0.42 ± 0.10) and ex-vivo (LC/LA = 0.49 ± 0.07; DC/DA = 0.28 ± 0.06).
Conclusions
The average dimensions of the ablation zone induced by the considered system on HCC increase linearly with the deposited energy and are fairly well predicted by the corresponding ex-vivo dimensions. The ratio between each linear dimension of A and C zones was found to be roughly constant over a large deposited energy span, both ex-vivo and in-vivo.
Introduction
Percutaneous microwave ablation (MWA) is a well-established therapeutic modality in the treatment of patients affected by primary and secondary liver neoplasms but not eligible for surgery due to tumor characteristics (lesion site and/or dimensions, multifocality/multicentricity), poor liver function and/or severe associated comorbidities [Citation1–8].
To ensure local tumor control and reduce local progression, an ablated area entirely encompassing the target volume is required, since cytotoxic temperatures must be reached in the whole lesion to ensure adequate tumor destruction [Citation9,Citation10]. In addition, a recommended minimum circumferential safety margin of nearby healthy liver ideally of 10 mm, but at least of 5 mm, should be obtained [Citation11,Citation12]. To this aim and for the safety of the treatment, the extension of the ablated zone should be controlled as tightly as possible [Citation13]. A first step is to make use of validated predictive models, usually in the form of tables provided by the MW system manufacturer. Such tables indicate the average ablation size obtained on ex-vivo healthy tissues at given treatment power, duration and energy delivery algorithm. Their accuracy in predicting clinical outcomes is discussed in multiple research studies for hepatic [Citation14], pulmonary [Citation15] and renal [Citation16] malignancies, yet the amount of systematically collected clinical data allowing for precise comparisons is still scarce [Citation14]. A non-negligible inherent variability (15–25%) was observed in the ablation zone volume for given MW settings: therefore, real-time treatment monitoring is required to detect deviations from the predicted behavior and to adjust treatment settings accordingly.
In principle, peri-ablational thermometry through interstitial temperature sensors is a very straightforward means of real-time treatment control. However, this technique is scarcely used in the clinical practice due to its invasiveness and to the demanding placement precision required to obtain reliable measurements. Noninvasive thermal mapping techniques based on intra-operative radiological imaging data (magnetic resonance, ultrasound or computed tomography –(CT)) are not yet fully mature, nor readily accessible technologies. Other quantities correlated with the temperature increase induced at the ablation site must, then, be considered for real-time appraisal of treatment progression. Among these, the amount of microwave energy deposited into tissues was found to be moderately correlated with the ablation extension [Citation14,Citation17–20]; however, when compared to the manufacturers ex-vivo tables, this quantity did not prove to be a better single predictor of the ablation volume [Citation18].
In the tissues in close contact with the MW antenna, exposed to the highest temperatures (exceeding 100 °C), charring and desiccation occur, as shown by direct gross-pathologic analysis of ex-vivo specimens [Citation21,Citation22]. Multiple clinical studies reported the presence of a central area of hyper-attenuation within the hypo-attenuating region associated with the ablation zone in unenhanced CT scans after MWA treatments [Citation23–25]. We hypothesized that such hyper-attenuating region corresponds to the charring region observed ex-vivo and that its extension might be a predictor of the overall ablation extension. The main endpoint of this study was to provide a systematic analysis of the extension of the ablation and central hyper-attenuation zones identified in hepatic tissues upon MW treatments at various settings, both ex-vivo and in a clinical series; furthermore, the ability of hyper-attenuation zone measurements at anticipating the corresponding in-vivo ablation zone extension was assessed and compared to the ex-vivo model predictions.
Materials and methods
Study design
Our study comprised both a pre-clinical and a clinical arm (see ).
Figure 1. Graphical representation of the study architecture. The hashes precede the number of ablations in each group.
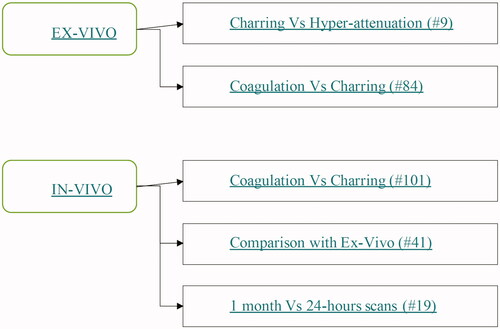
The pre-clinical arm featured two different experiments, both conducted on ex-vivo bovine liver. In the first experiment, we measured the ablation and charred tissue zones attained at several MW settings with a single 2450 MHz ablation system. In the second ex-vivo experiment, we compared the hyperdense region detected upon immediate post-ablation CT scan with the charred zone observed upon gross-pathologic examination of liver specimens undergoing MWA.
The clinical arm of our study consisted of a retrospective analysis of all consecutive ablations performed at a single institution on hepatocellular carcinomas (HCCs) with the same MW ablation system used in the ex-vivo arm. Through visual evaluation of the unenhanced CT images obtained 1 month after treatment, three assessments of the overall ablated zone and of its inner hyperdense core (i.e., the central hyper-attenuating region) were obtained. After checking for the internal coherence among different assessments, the correlation between the ablated and hyperdense zone dimensions was investigated. In treatments, sub-groups at given MW power and time with enough elements to allow for statistical analysis, the average ablation dimensions were compared to their ex-vivo counterparts at equal MW settings. Finally, we investigated the temporal evolution of the ablation and hyperdense zones in clinical cases where CT scans were collected both 1 month and 24 h after the treatment.
MW ablation setup
All ablations in both the clinical series and in the ex-vivo experiments were performed through the same MWA system (HS AMICA, H.S. Hospital Service, Rome, Italy), featuring:
2450 MHz operating frequency;
140 W maximum power at the generator;
straight, internally cooled applicators with built-in reflected waves suppressor (‘mini-choke’) [Citation26,Citation27], either 14 G or 16 G in size.
For each ablation in this study, the following quantities were recorded:
Net power (P) at the antenna, i.e., the power emitted by the generator net of power dissipated in the extension cable connecting the antenna to the generator;
Ablation duration (T);
Deposited energy (E), calculated by multiplying the net power P by the ablation duration T.
Ex-vivo experiments
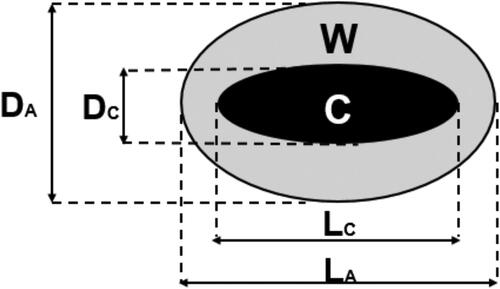
All ex-vivo ablations were performed on bovine liver specimens initially at 20 °C using 14 G applicators. The antenna was at least 2 cm apart from the liver capsule and large vessels. After energy delivery, a gross-pathologic examination of the specimens was performed upon sectioning along the applicator axis. The extension of the central charred region (zone C) and of the overall ablated region (zone A) was measured along the antenna axis (L) and perpendicularly to it (D) (). Ablation and charring sizes (named DA, LA and DC, LC, respectively) were obtained directly, while the sizes of the white elliptical-shaped coagulation annulus (i.e., zone W) were obtained by subtraction (DW = DA-DC and LW = LA-LC). All such measurements were obtained by visual inspection using a caliper.
Figure 2. Schematic representation of the convention used throughout this paper to describe the findings of the gross pathologic (ex-vivo) and imaging (in-vivo) analyses. The longest axes of the ablated and charred zones were called respectively LA and LC while the shortest axes were called, respectively, DA and DC. The corresponding quantities Lw and Dw for the white zone are obtained by subtraction.
Fifty-seven ex-vivo ablations were performed at power p = 40, 60 and 80 W during a time T = 3, 5, 10, 15, 20 and 30 min. For each power and time setting, at least three repetitions were performed.
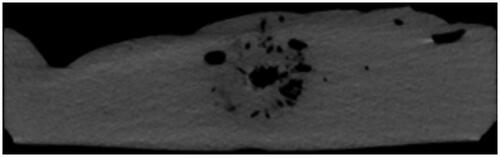
Nine ex-vivo ablations were performed at power p = 20 and 40 W during a time T = 5 and 10 min. Right after energy delivery, before the gross-pathologic examination, the specimens were scanned through commercially available CT equipment (128-multidetector, Philips Ingenuity) (). The CT scans of the specimens were blindly reviewed by an independent researcher who assessed the extensions of the inner hyper-attenuation zone within the hypo-attenuating region characteristic of ablated tissue. The hypo-attenuating region and hyper-attenuation zone extensions were then compared, respectively, to the ablated and charred zone measured at the gross-pathologic examination to investigate the correlation between them.
Figure 3. Unenhanced CT scan of an ex-vivo liver specimen after microwave irradiation at 40 W for 5 min, acquired before cutting it for the gross-pathologic examination.
Clinical workflow
We retrospectively reviewed the radiological charts of all patients who underwent MW ablation between November 2015 and April 2017 for primary liver lesions. In order to rule out the most relevant confounding factors in the assessment of treatment outcome repeatability, treatments featuring:
lack of essential procedural data, or
multiple energy applications, or
prior or concurring local treatments
The approval of institutional review board was waived. Patients gave written consent for every diagnostic and therapeutic procedure, as well as for use of data for scientific purposes before receiving the treatment. According to Italian law, no further patient approval was needed for this retrospective study. Patient demographics and lesion characteristics were recorded in parallel with operative technical data.
Before treatment, all patients underwent abdominal contrast-enhanced CT and/or dynamic magnetic resonance imaging (MRI).
In all cases, patients’ eligibility to percutaneous treatment was assessed by a multidisciplinary team, composed at least by an interventional radiologist, a hepatologist, an oncologist and a hepato-biliary surgeon.
All the ablations were conducted under deep sedation by two interventional radiologists with 15 and 10 years of experience (L.C., E.B). All patients had an international normalized ratio (INR) < 1.5 and a platelet count >50 × 109/L.
Each lesion was treated with a single probe insertion in one uninterrupted energy application. The tip of the antenna was kept in the same position during the entire energy delivery.
Based on the ex-vivo performance table provided by the MWA system manufacturer, treatment power and time were selected so that the corresponding expected ablation volume would fully encompass the target tumor, with a minimum safety margin of 5–10 mm. When needed, based on the location and characteristics of the target lesion and on its real-time response to the treatment, power and time settings were refined ad hoc. Track ablation was performed in all cases.
As routinely performed at our Institution, all patients received the first follow-up evaluation through CT scan 4–6 weeks after the ablation to evaluate the response to treatment. For a limited number of patients, additional CT scans were obtained within the first 24 h after the procedure, either when CT guidance was used during the treatment or when it was used to assess suspected complications. CT imaging was performed using a 64-row CT scanner (Light Speed VCT, General Electric®, Milwaukee, WI) or a 128-row CT scanner (Discovery CT750 HD, General Electric®, Milwaukee, WI) after contrast medium administration (100-120 ml; range of iodine concentration: 320–400 mg/ml; injection rate of 2.5–4 ml/s). In all cases, a CT quadriphasic protocol was used including a non-enhanced scan followed by a triphasic (arterial, venous and delayed phases) acquisition of abdomen after intravenous injection of iodinated contrast medium. All clinical data presented hereafter were obtained from CT scans.
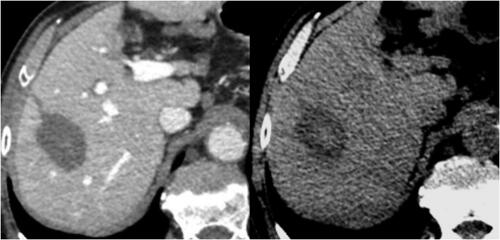
In the treated parenchyma, postoperative findings included a hypo-attenuating area lacking of enhancement in all acquisition phases at baseline and after intravenous contrast medium administration, corresponding to the overall ablated zone. Unenhanced scans also showed a central zone of hyper-attenuation within this broader hypodense area (). Through a visual analysis of the 1-month post-ablation CT scan, two independent observers – R1 and R2 – retrieved the long and short axes of each zone of interest:
Figure 4. CT images one month after the treatment. Left: the overall ablated zone is identified as the hypo-attenuating area in contrast-enhanced scans. Right: the charred zone is identified as the central zone of hyper-attenuation within the broader hypodense area in unenhanced scans.
LA and DA for the ablation zone (referred to as ‘zone A’ in the following);
LC and DC for the central hyper-dense inner halo within the ablation zone (referred to as ‘zone C’ in the following);
LW = LA - LC and DW = DA - DC for the ablation zone surrounding zone C (referred to as ‘zone W’ in the following).
In particular, maximum post-procedural extensions of both areas were evaluated as follows:
the long axis ‘L’ (i.e., maximum length ‘L’) was determined as the maximum extension along the antenna trajectory;
short axis ‘D’ (i.e., maximum diameter ‘D’) was calculated as the geometrical mean of the two maximum extensions determined perpendicularly to the antenna trajectory in two mutually perpendicular directions;
The same quantities were obtained from the 24-h CT scan, when it was available (LA24 and DA24 for zone A; LC24 and DC24 for zone C).
In addition, R1 also performed a second blind review of the same CT scans 3 months after the first evaluation. Therefore, for each in-vivo ablation, three assessments of LA, DA, LC and DC were available. Each measurement of the first assessment of R1 was compared to the corresponding measurement from the other two assessments: a score of 0 (1) was assigned when the measurements relative mismatch was greater (lower) than a given threshold, set to 10% for LA and DA and to 20% for LC and DC,. For each ablation, the overall agreement score was defined as the sum of the scores of all measurements. Since the four measured quantities (LA, DA LC, DC) were compared twice (intra- and inter-observer), the agreement score ranges from a minimum of 0 to a maximum of 8. Only treatment data with an agreement score of at least 5 were retained, averaging the three assessments of the same quantity for subsequent analysis.
Statistical analysis
Each set of measurements obtained in homogeneous experimental conditions was characterized through its average and standard deviation. The ablation long and short axes obtained in clinical treatments performed with given time and power settings were statistically analyzed for comparison with the corresponding ex-vivo quantities. p Values for significance testing between two data series, e.g., ex-vivo versus in-vivo series, were obtained through two-tailed heteroscedastic t-tests, rejecting the null hypothesis when p<.05. Multivariate ANOVA was used in analyzing the effects of the applied power and treatment duration of the ablation. Linear best fits were obtained through the least squares method and the coefficient of determination was obtained to assess the correlation between data sets. All the statistical analysis was performed through Microsoft Excel 2013 version 15.0.
Results
Ex-vivo experiments
The extension of the charring zone measured at the visual inspection and of the central hyper-attenuating zone detected on the same specimens under CT is reported in and illustrated in . The proportionality coefficient between the two sets of data is 1.0 for Lc (R2 = 1.0) and 1.1 for Dc (R2 = 0.84).
Figure 5. Comparison between the carbonization zone (LC_vis, DC_vis) and the central hyper-attenuating zone (LC_CT, DC_CT) on ex-vivo bovine-liver.
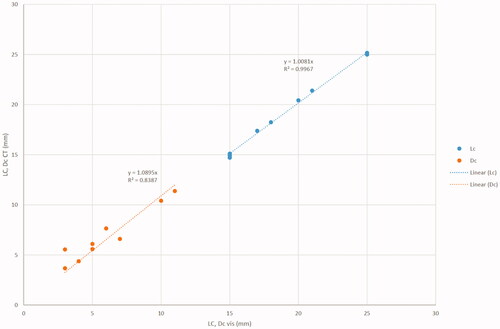
Table 1. Comparison between the carbonization zone observed at visual analysis (LC_vis, DC_vis) and the central hyper-attenuating zone observed at CT scan (LC_CT, DC_CT) on ex-vivo bovine-liver treated at various microwave ablation settings.
The average dimensions of the necrosis obtained in the ex-vivo series are shown in . The relationship between the deposited energy (Ed = P*T) and the ablation volume (VA) was linear (VA = Ed*k, with k = 1.4 cc/kJ, R2 = 0.93). Therefore, each kJ of deposited energy resulted approximately in 1.4 cc of ablated ex-vivo tissue. The long and short axes were both proportional to Ed1/3, with R2 = 0.94 for LA and R2 = 0.97 for DA ().
Figure 6. Average long (left) and short (right) axes of ablation (squares) and charring (circles) obtained ex-vivo (open markers) and in-vivo (full markers) at various deposited energies. The dashed and continuous lines are cubic regressions of ex-vivo and in-vivo series, respectively. On both sides of the picture, the largest full markers depict clinical data from [Citation28].
![Figure 6. Average long (left) and short (right) axes of ablation (squares) and charring (circles) obtained ex-vivo (open markers) and in-vivo (full markers) at various deposited energies. The dashed and continuous lines are cubic regressions of ex-vivo and in-vivo series, respectively. On both sides of the picture, the largest full markers depict clinical data from [Citation28].](/cms/asset/fdaa0db9-6d1d-42cf-b82b-8a5a29b560a7/ihyt_a_1986642_f0006_b.jpg)
Table 2. Ex-vivo average and standard deviations for the ablated and carbonized zone at various power-time settings with 14 G applicators.
The ratio between the charred (C) and the ablated (A) long and short axes was substantially constant, regardless of power and time settings (LC/LA = 0.49 ± 0.07 and DC/DA = 0.28 ± 0.06). Moreover, the W zone showed approximately the same thickness perpendicularly (DW) and parallel (LW) to the MW antenna (DW/LW = 1.06 ± 0.18).
The ex-vivo sphericity index (SI), defined as the ratio between the short over the long axis, was 0.74 ± 0.07 for the ablation zone and 0.42 ± 0.10 for the charred zone.
Clinical series
From November 2015 to April 2017, 87 patients (72 M, 15 F, mean age 67.8 years) received MW ablation for HCC. A total of 101 nodules were treated (mean size: 20.4 ± 8.4 mm; range 9–35 mm). Underlying liver cirrhosis was observed in 99.1% of cases. Demographic characteristics are summarized in .
Table 3. Patient’s demographics.
All the ablations were performed using 14-gauge (n = 42) or 16-gauge (n = 57Footnote1) antennas under imaging guidance. The insertion of the antenna and the monitoring of the ablation were performed under ultrasound (US) guidance with the exception of 14 cases performed under CT guidance. The average treatment time was 4.5 ± 1.6 min (range 2–10 min) and the average treatment power was 48.6 ± 9.1 W (range 35–80 W). The average deposited energy was 13.7 ± 7.2 kJ (range 4.2–48 kJ).
At 1-month CT scan after MW ablation, a complete therapeutic response was observed in 88 cases (87.1%), while persistence of residual neoplastic tissue occurred in 13 cases (12.9%).
The average agreement score of the three assessments of each measurement was 7.2 (median 8), with 95% of the data sets achieving a score of at least 6. The ratio between the range of the three assessments and their average was 4.1% ± 0.4% for the ablation zone and 9.6% ± 0.9% for the charred zone. Such values were not statistically different between the short and long axes (p > .29). These findings prove the reliability of the imaging assessments performed and of the subsequent statistical analyses based on them.
Overall coagulation and charring analysis
The C to A long and short axes ratios were substantially constant with respect to the power and duration settings of the clinical treatments, similarly to what observed ex-vivo. The average LC/LA value (0.43 ± 0.13) observed in-vivo showed an excellent agreement with its ex-vivo counterpart (0.49 ± 0.07). Instead, the average DC/DA value (0.42 ± 0.10) resulted to be approximately 50% higher than its ex-vivo counterpart (0.28 ± 0.06), mainly due to a larger charred zone short axis.
The average in vivo SI, defined as the ratio between the short and long axis (D/L), was 0.68 ± 0.11 both for the ablation zone and for the charred zone, regardless of the deposited energy. The average radial sphericity, defined as the ratio between the two maximum extensions determined perpendicularly to the antenna trajectory in two mutually perpendicular directions, was 0.98 ± 0.20.
Subgroups analysis
The comparison between in-vivo and ex-vivo series at same treatment power and time was possible for three settings: 40 W/3 min (12 clinical treatments) 40 W/5 min (18 clinical treatments) and 60 W/5 min (10 clinical treatments). For other settings, the number of cases was less than three and, therefore, not suitable for statistical analysis. For each clinical subgroup, the average in-vivo La, Da, Lc and Dc were calculated. This analysis was run separately for ablations obtained with 14 and 16 G antennas. The correlation between the corresponding quantities referred to the two antenna gauges was then calculated, finding a linear trend with 0.99 slope and R2 = 0.99 (). Moreover, all data series (La, Da, Lc and Dc) in each subgroup were compared, without finding statistically significant differences (0.14 ≤ p ≤ .99). The data obtained at equal system settings with the two antenna gauges were hence pooled together, obtaining a cumulative statistical analysis valid for both 14 and 16 G antennas. The values obtained are shown in .
Figure 7. Comparison between the average LA, DA, LC and DC obtained with 14 Gauge and 16 Gauge antennas at 40 W/3 min, 40 W/5 min and 60 W/5 min.
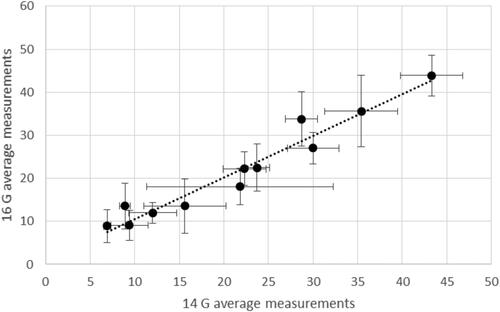
Table 4. In-vivo average and standard deviations for the ablated and carbonized zone at various power-time settings as obtained from 1-month CT scans.
Coherently with the ex-vivo findings, the long and short axes of the ablated zone were proportional to Ed1/3, with a slope of 16.4 mm·kJ−⅓ (R2 = 0.82) for LA and 11.4 mm·kJ−⅓ (R2 = 0.89) for DA (). The difference between the clinical series obtained at 40 W/3 min and at 40 W/5 min was not significant (p>.17), while there was a significant difference between these and the series at 60 W/5 min (p<.002). These findings include comparisons on both ablated and charred zones. The overlapping with their ex-vivo counterparts is good, as summarized in . The relationship between the average ablation volume <V> at fixed time and power settings and the correspondingly delivered energy E was found to be linear both ex-vivo and in-vivo: <V>=k⋅E, with k = 1.38 cc/kJ, R2 = 0.97 ex-vivo and k = 1.11 cc/kJ, R2 = 0.90 in-vivo. By integrating the in-vivo data obtained in this work with those at 60 W during 5 and 10 min from [Citation28], which were obtained through the same technique, under analogous clinical conditions and by applying an identical data analysis, the above in-vivo coefficients undergo a minimal variation, i.e., k = 1.1 cc/kJ, R2 =0.80 (). This demonstrates the repeatability of our findings and suggests that all trends observed in the treatment energy range explored in this study are also maintained at appreciably higher energies (even twice as much). The difference between the ex-vivo and in-vivo linearity coefficient k was not significant (p>.1).
Figure 8. In-vivo (full) and ex-vivo (empty) short axes (left) and sphericities (right) at various treatment time and power settings.
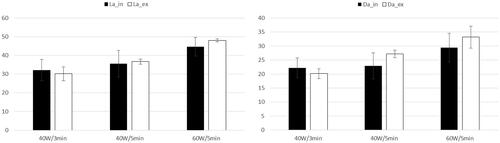
Figure 9. Average ablation volume at various deposited energies ex-vivo (open circles) and in-vivo (full circles) with respective linear regressions (dotted for ex-vivo and straight for in-vivo) and coefficients of determination. The largest full markers depict clinical data from [Citation28].
![Figure 9. Average ablation volume at various deposited energies ex-vivo (open circles) and in-vivo (full circles) with respective linear regressions (dotted for ex-vivo and straight for in-vivo) and coefficients of determination. The largest full markers depict clinical data from [Citation28].](/cms/asset/c783e84d-748c-4c32-bc58-567f08c394ee/ihyt_a_1986642_f0009_b.jpg)
24-Hours versus 1-month CT findings comparison
In a subgroup of 19 treated lesions in 15 patients, a 24 h-CT scan was available for further analysis of the necrosis evolution over time.
Regarding the long axis, the ratio retrieved from 24 h-CT scan (LC24/LA24 =0.48 ± 0.09) was substantially equal to the one obtained at 1-month CT (0.43 ± 0.13). Indeed, the long axes measured at 24-h and at 1-month were very similar for the carbonized and the ablated zones (LC1m/LC24 = 0.89 ± 0.27 and LA1m/LA24 = 0.92 ± 0.12).
Conversely, the same sub-analysis provided a short axis ratio DC24/DA24 = 0.35 ± 0.07, intermediate between the 1-month in-vivo finding (0.42 ± 0.10) and the ex-vivo one (0.28 ± 0.06). This result was entirely due to a smaller charred zone diameter measured at 24 h with respect to the 1 month measurement (DC1m/DC24 = 1.19 ± 0.50 while DA1m/DA24 = 0.97 ± 0.23).
Discussion
The good matching observed in the ex-vivo comparison between the extension of the carbonization zone measured at visual inspection and the extension of the central hyper-attenuating zone detected on the same specimens under CT strongly supports the identification between the two.
In our study, we found that the ex-vivo experiments, from which the manufacturer performance tables are obtained, provide a reliable prediction of the average clinical extension of the ablation zone for the observed power-time settings. However, the variability of the single ablation outcome is larger in clinical applications. A linear dependence of the ablation volume over the deposited energy was found both ex-vivo and in-vivo, with similar linear coefficients. Data retrievable from a previous work with the same ablation system, inclusion and analysis criteria [Citation28] are in substantial agreement with the linear trend here observed, even when the delivered energy was twice the maximum used in this series. These results are related to some of the inclusion and analysis criteria used in this work, namely: (1) only ablations confirmed to be obtained through a single energy delivery with fixed applicator position were included; (2) several ablation volume determinations obtained at same power-time settings were averaged to mitigate the effects of the data variability. The linearity of the average ablation volume growth against the deposited energy suggests that the impact of the heat-sink provided by blood perfusion in the explored power-time settings is limited. Otherwise, a plateau of the ablation volume should have been observed [Citation29].
Even though the variability of inter- and intra-observer assessments of the extension of the charred zone was larger than the variability of the ablation zone, it was still below 10%, showing that a consistent assessment of this quantity is possible. The constant value of the ratio between the dimensions of the charred zone and those of the ablation zone suggest that the extension of the ablation zone can be inferred by the knowledge of the charred zone and vice-versa.
The LC/LA ratio matching between ex-vivo, in-vivo at 1 month and in-vivo at 24 h shows how this information is robust with respect to changing environments. The variability of DC/DA under the same circumstances shows instead that the absolute value of this quantity is affected by some additional factor. Such variability was substantially due to the variability of DC, which was smaller ex-vivo and larger in-vivo at 1 month, with intermediate values at 24 h.
We showed that tissue charring is visible on CT imaging, making it potentially attractive as a treatment control parameter. However, factors influencing the radiological differentiation of this region from the surrounding ablation zone are still to be thoroughly identified and quantitatively evaluated.
Further investigations are needed to clarify the role of the inner charred core of MW-induced ablation zones as an indirect marker of the overall coagulation shape and size. Should the relationship between charring and overall ablation extensions found in this study be confirmed, the real-time monitoring of the hyperdense zone expansion during MWA treatments would provide a novel tool for enhanced intra-operative control of the overall ablation expansion. Such control could be accomplished either through direct visualization, similarly to ‘ice-balls’ in cryoablation, or indirectly, exploiting the steep gradient of physical properties at the charred/white coagulation boundary [Citation30–32]. Furthermore, charring was previously identified as the major cause of tissue contraction during MWA and a predictive model to relate the amount of contraction to the charring extension was also proposed and tested [Citation22].
In view of all the above, a standardized way to consistently measure the extension of the charred tissue is warranted. In this context, a considerable support could be represented by the employment of Dual-Energy CT (DECT. In fact, DECT is able to improve tissue characterization and provide more precise information about material composition due to the higher contrast-to-noise ratio (CNR) [Citation33,Citation34]. Paul et al. investigated temperature changes in ex-vivo porcine liver during MW ablation using DECT image data, concluding that DECT image datasets provided better thermal sensitivity, visibility and lesion detection than Single-Energy CT [Citation35]: hence, DECT may provide enhanced detection and improved accuracy in the measurement of the hyper-dense area within tissue regions subject to thermal ablation treatments. In adjunction, further benefit may derive from the development of dedicated Computer-Aided Detection (CAD) software for the automatic detection and volume assessment of charred areas out of CT scans.
This study is limited by its retrospective nature and by the use of a specific ablation system. Additionally, the maximum deposited energy considered in this study is approximately half the system-rated energy. Finally, the ex-vivo experiments were performed on healthy tissues while clinical treatments were performed in liver tumors often lying on a cirrhotic tissue background.
Conclusions
The dimensions of the ablation zone induced by the considered system on HCC increase on average linearly with the deposited energy and are fairly well predicted by the system ex-vivo performance chart on bovine liver. The ratio between each linear dimension of the ablation zone and its counterpart in the charred zone was found to be roughly constant over a large span of deposited energy, both ex-vivo and in-vivo.
Disclosure statement
L.C. served on an advisory board for Boston Scientific Corporation, and was a Speaker for Terumo Medical Corporation.
N.T, C.A. and S.C. are employees of H.S. Hospital Service SpA, the company manufacturing the MWA apparatus used in the study.
P.S., E.B., P.R., R.C. and R.C. report no conflicts of interest.
Notes
1 In two cases the information about the antenna gauge was not available at the time of the study.
References
- Vogel A, Cervantes A, Chau I, et al. Hepatocellular carcinoma: ESMO clinical practice guidelines for diagnosis, treatment and follow-up. Ann Oncol. 2018;29(4):iv238–iv255.
- European Association for the Study of the Liver. Electronic address: [email protected] and European association for the study of the liver, “EASL clinical practice guidelines: Management of hepatocellular carcinoma. J. Hepatol. 2018;69(1):182–236.
- Crocetti L, Bargellini I, Cioni R. Loco-regional treatment of HCC: current status. Clin Radiol. 2017;72(8):626–635.
- Gillams A, Goldberg N, Ahmed M, et al. Thermal ablation of colorectal liver metastases: a position paper by an international panel of ablation experts, the interventional oncology sans frontières meeting 2013. Eur Radiol. 2015;25(12):3438–3454.
- Martin RCG, Scoggins CR, McMasters KM. Safety and efficacy of microwave ablation of hepatic tumors: a prospective review of a 5-year experience. Ann Surg Oncol. 2010;17(1):171–178.
- Rocha FG, D'Angelica M. Treatment of liver colorectal metastases: Role of laparoscopy, radiofrequency ablation, and microwave coagulation: Laparoscopy, RFA, and microwave ablation. J Surg Oncol. 2010;102(8):968–974.
- Liang P, Wang Y. Microwave ablation of hepatocellular carcinoma. Oncology. 2007;72(1):124–131.
- Shibata T, Niinobu T, Ogata N, et al. Microwave coagulation therapy for multiple hepatic metastases from colorectal carcinoma. Cancer. 2000;89(2):276–284.
- Meloni MF, Chiang J, Laeseke PF, et al. Microwave ablation in primary and secondary liver tumours: technical and clinical approaches. Int J Hyperthermia. 2017;33(1):15–24.
- Ahmed M, Brace CL, Lee FT, et al. Principles of and advances in percutaneous ablation. Radiology. 2011;258(2):351–369.
- Ahmed M, Solbiati L, Brace CL, et al. Image-guided tumor ablation: standardization of terminology and reporting criteria-a 10-year update. Radiology. 2014;273(1):241–260.
- Crocetti L, de Baere T, Lencioni R. Quality improvement guidelines for radiofrequency ablation of liver tumours. Cardiovasc Intervent Radiol. 2010;33(1):11–17.
- Puijk RS, Ruarus AH, Scheffer HJ, et al. Percutaneous liver tumour ablation: Image guidance, endpoint assessment, and quality control. Can Assoc Radiol J. 2018;69(1):51–62.
- Ruiter SJS, Heerink WJ, de Jong KP. Liver microwave ablation: a systematic review of various FDA-approved systems. Eur Radiol. 2018;29:4026–4035.
- Iezzi R, Margaritora S, Valentini V, et al. Standardizing percutaneous microwave ablation in the treatment of lung tumors: a prospective multicenter trial (MALT study). Eur. Radiol. 2020;31: 2173–2182.
- Novanta A, Herpe G, Vesselle G, et al. Chart for renal tumor microwave ablation from human study. Diagn Interv Imaging. 2018;99(10):609–614. 218,
- Heerink WJ, Solouki AM, Vliegenthart R, et al. The relationship between applied energy and ablation zone volume in patients with hepatocellular carcinoma and colorectal liver metastasis. Eur Radiol. 2018;28(8):3228–3236.
- Shyn PB, Bird JR, Koch RM, et al. Hepatic microwave ablation zone size: Correlation with total energy, net energy, and Manufacturer-Provided chart predictions. J Vasc Interv Radiol. 2016;27(9):1389–1396.
- Schramm W, Yang D, Haemmerich D. Contribution of direct heating, thermal conduction and perfusion during radio frequency and microwave ablation. Conf Proc IEEE Eng Med Biol Soc. 2006;2006:5013–5016.
- Lubner MG, Brace CL, Hinshaw JL, et al. Microwave tumor ablation: mechanism of action, clinical results, and devices. J Vasc Interv Radiol. 2010;21(8):S192–S203.
- Crocetti L, Lencioni R. Thermal ablation of hepatocellular carcinoma. Cancer Imaging. 2008;8:19–26.
- Amabile C, Farina L, Lopresto V, et al. Tissue shrinkage in microwave ablation of liver: an ex vivo predictive model. Int J Hyperthermia. 2017;33(1):101–109.
- Kelekis A, Filippiadis D. Computed tomography and ultrasounds for the follow-up of hepatocellular carcinoma ablation: what you need to know. Diagn Basel Switz. 2016;6(1):9.
- Poggi G, Tosoratti N, Montagna B, et al. Microwave ablation of hepatocellular carcinoma. World J Hepatol. 2015;7(25):2578–2589.
- Goldberg SN, Gazelle GS, Mueller PR. Thermal ablation therapy for focal malignancy: a unified approach to underlying principles, techniques, and diagnostic imaging guidance. AJR Am J Roentgenol. 2000;174(2):323–331.
- Longo I, Gentili GB, Cerretelli M, et al. A coaxial antenna with miniaturized choke for minimally invasive interstitial heating. IEEE Trans Biomed Eng. 2003;50(1):82–88.
- Cavagnaro M, Amabile C, Bernardi P, et al. A minimally invasive antenna for microwave ablation therapies: design, performances, and experimental assessment. IEEE Trans Biomed Eng. 2011;58(4):949–959.
- Amabile C, et al. Microwave ablation of primary and secondary liver tumours: ex vivo, in vivo, and clinical characterisation. Int. J. Hyperthermia. 2017;33(1):34–42.
- Hines-Peralta AU, Pirani N, Clegg P, et al. Microwave ablation: Results with a 2.45-GHz applicator in ex vivo bovine and in vivo porcine liver. Radiology. 2006;239(1):94–102.
- Rossmann C, Haemmerich D. Review of temperature dependence of thermal properties, dielectric properties, and perfusion of biological tissues at hyperthermic and ablation temperatures. Crit Rev Biomed Eng. 2014;42(6):467–492.
- Lopresto V, Pinto R, Lovisolo GA, et al. Changes in the dielectric properties of ex vivo bovine liver during microwave thermal ablation at 2.45 GHz. Phys Med Biol. 2012;57(8):2309–2327.
- Deshazer G, Prakash P, Merck D, et al. Experimental measurement of microwave ablation heating pattern and comparison to computer simulations. Int J Hyperthermia. 2017;33(1):74–82.
- Vandenbroucke F, Van Hedent S, Van Gompel G, et al. Dual-energy CT after radiofrequency ablation of liver, kidney, and lung lesions: a review of features. Insights Imaging. 2015;6(3):363–379.
- McCollough CH, Leng S, Yu L, et al. Dual- and multi-energy CT: principles, technical approaches, and clinical applications. Radiology. 2015;276(3):637–653.
- Paul J, Vogl TJ, Chacko A. Dual energy computed tomography thermometry during hepatic microwave ablation in an ex-vivo porcine model. Phys Med. 2015;31(7):683–691.