
 ?Mathematical formulae have been encoded as MathML and are displayed in this HTML version using MathJax in order to improve their display. Uncheck the box to turn MathJax off. This feature requires Javascript. Click on a formula to zoom.
Abstract
Objective: In High Dose Rate Brachytherapy for prostate cancer there is a need for a new way of increasing cancer cell kill in combination with a stable dose to the organs at risk. In this study, we propose a novel ThermoBrachy applicator that offers the unique ability to apply interstitial hyperthermia while simultaneously serving as an afterloading catheter for high dose rate brachytherapy for prostate cancer. This approach achieves a higher thermal enhancement ratio than in sequential application of radiation and hyperthermia and has the potential to decrease the overall treatment time.
Methods: The new applicator uses the principle of capacitively coupled electrodes. We performed a proof of concept experiment to demostrate the feasibility of the proposed applicator. Moreover, we used electromagnetic and thermal simulations to evaluate the power needs and temperature homogeneity in different tissues. Furthermore we investigated whether dynamic phase and amplitude adaptation can be used to improve longitudinal temperature control.
Results: Simulations demonstrate that the electrodes achieve good temperature homogeneity in a homogenous phantom when following current applicator spacing guidelines. Furthermore, we demonstrate that dynamic phase and amplitude adaptation provides a great advancement for further adaptability of the heating pattern.
Conclusions: This newly designed ThermoBrachy applicator has the potential to revise the interest in interstitial thermobrachytherapy, since the simultaneous application of radiation and hyperthermia enables maximum thermal enhancement and provides maximum efficiency for patient and organization.
Introduction
High Dose Rate Brachytherapy (HDR-BT) is a valuable treatment option for prostate cancer mainly due to its ability to deliver high radiation dose preferential to the target. Prostate cancer has a low alpha/beta ratio, which implies that the cancer cells are more responsive to hypofractionated treatments [Citation1]. Based on that rationale, highly hypofractionated HDR-BT as monotherapy for low-risk to intermediate-risk prostate cancer is becoming more popular [Citation2–5]; and HDR-BT boosted external beam radiotherapy (EBRT) is commonly applied to intermediate to high-risk prostate cancer [Citation5]. Ultra-hypofractionated HDR-BT has several potential advantages, such as a lower patient burden due to shorter hospitalization and a shorter overall treatment time. These advantages also apply to locally recurrent prostate cancer after primary radiation therapy, in which salvage HDR-BT is a good treatment option [Citation6–8]. In HDR-BT monotherapy and HDR-BT for locally recurrent prostate cancer, recent attempts to move to a single fraction treatment have not been successful. Studies indicated that the maximum tolerance level for normal tissue toxicity with HDR-BT is reached with a single fraction is 19 or 20 Gy. Such single fractions, however, resulted in suboptimal biochemical control of the disease and higher local recurrence rates compared to two or three fraction treatments [Citation9–11], even though the dose at the place of local recurrence was as high as 27 Gy. These developments indicate that there is a need for a new way of increasing cancer cell kill without increasing the dose delivered to the organs at risk, or even better, while lowering the dose to the organs at risk.
In addition to physical dose-escalation, enhanced tumor cell kill efficiency can be achieved by increasing the biological effective dose (BED). Hyperthermia (HT) is a known sensitizer for radiotherapy [Citation12–14] and its radiosensitizing effect, specifically for prostate cancer cells, has been demonstrated in vitro [Citation15,Citation16]. Moreover, promising results have been reported in several Phase I and Phase II studies investigating the combination of radiotherapy and hyperthermia in prostate cancer [Citation17–23]. A clear correlation between higher temperatures and long-term PSA control was observed in [Citation17], and good overall and disease-free survival combined with very low toxicity was observed in [Citation19]. In four of the studies [Citation20–23], the HT treatment was delivered through interstitial HT (IHT), and in three of these, IHT was combined with HDR-BT [Citation20,Citation21,Citation23]. IHT combines well with HDR-BT because the same catheters can be utilized by both HDR-BT and IHT. At the same time, the IHT energy deposition is locally confined to the target region [Citation24], potentially leading to better target coverage and limited temperature rise in surrounding normal tissues.
Over the years, several IHT techniques have been investigated and developed [Citation24,Citation25]. From all IHT techniques, the capacitive coupled (CC) multi-electrode current source (MECS) [Citation26–28] system, that operates at 27 MHz radiofrequency (RF) electromagnetic fields (EMF), was recognized for its homogenous longitudinal heating pattern [Citation25], for possessing good temperature steering abilities [Citation25,Citation29,Citation30] and for allowing extensive temperature monitoring [Citation29,Citation31]. Despite the advantages of the MECS system compared to other IHT techniques, the clinical study by van Vulpen et al. [Citation22] revealed undesired high temperature heterogeneity in the treatment of prostate cancer patients. Similar results were observed in glioblastoma multiforme treatments [Citation32]. Besides an underestimated perfusion rate in the prostate during treatment [Citation33], several technical aspects of the IHT were considered responsible for the observed heterogeneities, i.e., the wide catheter spacing, the sub-optimal catheter placement, and the high levels of energy deposition within the catheter wall [Citation22] transferring the MECS system more to a ‘hot source’ than a RF-EMF device. According to current guidelines for HDR-BT, catheter implantation is currently much denser and confined within the prostate perimeter. A catheter spacing of ≤10 mm [Citation34], compared to the ≤15 mm spacing used in the study by van Vulpen et al. [Citation22], greatly improves the setting for successful IHT in combination with HDR-BT.
Another reason to reinvestigate a CC electrodes IHT system, such as the intracatheter MECS, is that current technology facilitates simultaneous application of hyperthermia and radiation. Simultaneous application of hyperthermia and radiation is known to produce the highest thermal enhancement ratio (TER) for radiation-induced cell killing [Citation12,Citation35–37]. However, no known application can seamlessly integrate these two treatment modalities [Citation37]. Therefore, in this study, we propose the novel ThermoBrachy (TB) applicator, a unique approach to combine HDR-BT and IHT, based on the CC electrodes IHT system. The TB applicator has a dual function: it serves as an IHT applicator, using novel technology to obtain highly efficient capacitive coupling of RF-EMF energy, as well as an afterloading catheter for the application of HDR-BT. This feature is realized by placing the electrodes on the outer layer of the BT afterloading catheters. An additional advantage of this approach is that the dielectric material between the electrode and the tissue is thinner, which greatly improves the delivery of RF-EMF energy in the target volume. At the same time, the inner cavity of the catheter remains fully available for the BT source. Besides the increased TER, the simultaneous application of IHT enables the integration of IHT within the existing time frame of the standard BT procedure. For both the patient and hospital, this might translate into a well-appreciated reduction of overall treatment time.
In this study, we describe the novel TB dual-electrode applicators and demonstrate, in silico, that it has the potential to provide the desired heating distributions simultaneously with the HDR-BT treatment. Furthermore, we report how catheter spacing and different tissue scenarios affect the performance of the TB applicators. Finally, we demonstrate that different phase combinations of the input signal can be dynamically adapted, to get increased adaptability of the heating pattern.
Materials and methods
Applicator model
The classic MECS dual electrode applicator () consisted of a Polyethylene (PE) 4 Fr (outer diameter 1.333 mm) applicator catheter and two 20 mm electrodes with a spacing of 10 mm between the electrodes, each connected by a feeder wire to the 27 MHz current source HT system. The applicator was inserted into the 6 Fr (outer diameter 2 mm) HDR-BT flexible Polyoxymethylene (POM) afterloading catheters. In addition, a multipoint thermometer was inserted into the dual electrode MECS applicator [Citation38]. Having two electrodes per applicator allowed for longitudinal temperature control along the applicator length, adapting to tissue and perfusion changes [Citation39].
Figure 1. (I) The classic MECS applicator. A flexible PE catheter (blue) is inserted into the flexible POM HDR-BT prostate afterloading catheter (gray). Two electrodes (black) are deposited onto the PE tube and are connected by a thin wire (red) to the current source. (II) The novel TB applicator. Two electrodes (dark gray) are deposited on a flexible POM HDR-BT prostate afterloading catheter (light gray). A Paylene C layer (white) covers the electrodes and POM catheter, while thin conductive wires connect the electrodes to the current source.
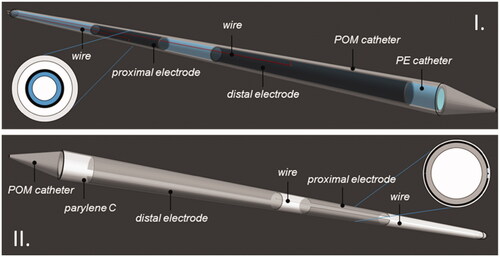
In the novel TB applicator model (), two 30 μm thick and 20 mm long copper layers are deposited onto the outer layer of a 6 Fr HDR-BT flexible POM afterloading catheter (Elekta ProGuide 6 F sharp needle), with a spacing of 5 mm between the electrodes. The copper layers leave a 0.5 mm circumferential opening along the catheter axis, which serves as a wiring path. The copper electrodes are connected by a 50 μm copper wire to the distal side of the catheter, from where they can be connected to the source. A thin, 30 μm dielectric conformal coating layer (Parylene C) covers the outer applicator to ensure capacitive coupling rather than galvanic contact with the tissue and to ensure biocompatibility [Citation40]. The inside of the catheter is not obstructed, leaving the original space for insertion of the HDR-BT source from the afterloader. Since the TB applicator is in direct contact with patient tissue, it is a single use sterilized device.
The applicator must be able to simultaneously apply IHT, while not interfering with the application of HDR-BT. The effect of different afterloading catheter materials (stainless steel and plastic) in HDR-BT has already been studied, and a limited perturbation in the dose distribution related to the material choice was demonstrated [Citation41]. In the proposed new design, taking into account the very limited thickness of the additional copper layer (30 μm), an insignificant attenuation of <0.3% on the BT dose distribution is to be expected [Citation42].
Power application
Voltage sources operating in-phase at a frequency of 27 MHz are used to drive power to the electrodes of the applicators. One end of each voltage source is connected to each electrode, while the other end of the voltage source is connected to a common ground. By setting the phase of half the electrodes to a 180 degree shift, a balanced configuration as described by Deurloo et al. [Citation28] is achieved. For each electrode, the power and phase can be adjusted during treatment, offering the ability to steer the heating pattern both spatially and temporally.
Single applicator proof of concept
A handcrafted applicator closely resembling the described TB applicator was fabricated to demonstrate the feasibility of the concept. The applicator was fabricated by depositing a thin (60 μm) copper foil layer on top of a 6 Fr HDR-BT flexible POM afterloading catheter. The whole applicator was coated with a dielectric layer of approximately 0.1 mm using a plastic spray (PRF-202), leaving only the distal edges of the two copper wires free for connection to the RF power generator.
The applicator was positioned in the center of a cylindrical agar-filled split-phantom. Through an LC matching circuit, the two electrodes were matched to the 50 Ω impedance of the 27 MHz RF power generator. Power was applied for 10 min, after which the split-phantom was opened and the temperature was measured using an infrared camera (T1020 – FLIR Infrared Camera Systems, Boston, USA).
Multiple applicator study model
Since the heating method is based on the interaction between electrodes from different applicators, we studied the volumetric temperature distribution of a set of multiple TB applicators. Therefore, a mathematical model scenario is used, in which four applicators are arranged in a square pattern. The edges of the square spacing are set equal to the nowadays commonly accepted maximum spacing of 10 mm, or 15 mm for comparison with the historical applications.
The model consists of a cylindrical tissue volume () with a diameter of 60 mm and a length of 100 mm. The configuration of the TB applicators is inserted in the tissue cylinder to a depth of 90 mm. Four different homogeneous tissue types were considered: i.e., agar, muscle, fat, and prostate tissue (). In the static phase configuration, each electrode shares the same phase with the other electrode on the same applicator, as well as with the electrode of the opposite diagonal applicator. The other electrodes have a 180° phase shift, as illustrated in .
Figure 2. The simulation model used to study the three-dimensional temperature distribution of the TB applicators. Four TB applicators are inserted in parallel in a square spacing in a cylindrical tissue volume. The static phase configuration used is visible. Electrodes in red have a 180° phase shift compared to the blue electrodes.
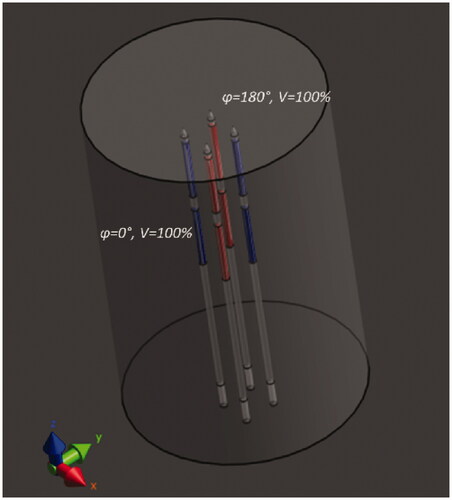
Table 1. Electric and thermal properties of the applicator materials and the tissues used in the simulations.
Temperature distribution characterization
For a three dimensional quantitative characterization of the temperature heterogeneity, the heterogeneity coefficient (HC) was used, which is defined as [Citation25,Citation39]:
where T90 and T10 are the lowest temperatures achieved in 90% and 10% of the target volume, respectively. Tb is the blood temperature, which is set at 37 °C. The T90 and T10 values can be extracted from cumulative temperature volume histograms (CTVH). The HC has been used for interstitial and intraluminal applicator comparisons in terms of temperature heterogeneity. A lower HC value is more desirable since it indicates a lower temperature heterogeneity (higher homogeneity) in the target region.
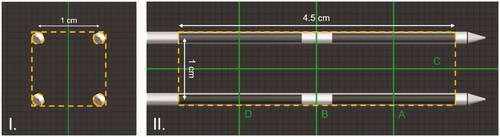
For the study of the temperature heterogeneity, the box enclosing the active lengths of the applicators, excluding the volume occupied by the applicators () was chosen as the Volume of Interest (VOI). In this way, the complete volume between the applicators is considered.
Figure 3. Graphical representation of the planes perpendicular (I) and parallel (II) to the applicators. The volume of interest (VOI) is illustrated as a yellow dashed line. The green lines illustrate the cross-sectional planes A, B, C, and D, which are used for temperature maps in and .
Temperature steering ability
The temperature distribution depends on the electrode geometry, the amplitudes, and the phases of the signals applied to the electrodes [Citation29]. In the scenario with four applicators, several phase configurations are possible. We can utilize the different phase and amplitude settings in two ways: a) to longitudinally steer the heating pattern along the active length of the applicator, thereby heating different sub-volumes or b) to adapt the heating pattern, i.e., when heterogeneous tissue leads to increased temperature heterogeneity.
By applying power only on the distal or proximal electrodes of the applicators, the temperature rise can be constrained to the distal or proximal of the active length of the applicators, respectively. Temperature rise can also be constrained to the region between the electrodes if a 180° phase shift is applied between the distal and proximal electrodes of the applicators [Citation29], thus creating a virtual electrode in the middle of the active length. In this study, we also investigated dynamic switching between the different phase settings to maximize the longitudinal adaptability of the heating pattern.
Simulation method
All simulations were performed using the Sim4Life simulation platform, version 4.4.1, ZMT, Zurich, Switzerland. We used an electromagnetic (EM) full-wave finite-difference time-domain (FDTD) solver, for the calculation of the specific absorption rate (SAR) distributions [Citation47]. A non-uniform grid was used in the simulations. To accurately discretize all layers of the applicators, a maximum grid step of 0.02 mm was chosen to discretize the cylindrical volume in the x- and y-direction, perpendicular to the applicator axis, while the regions outside the applicator volume were gradually increased to a maximum of 2 mm. In the z-direction parallel to the applicator axis, a grid step of 1 mm was used. An edge source with a frequency of 27 MHz, a voltage of 10 V, and a load of 50 Ω was used between the edges of each of the feeder wires and ground. All copper wires and electrodes were simulated as perfect electric conductor (PEC) materials, since the wires and electrodes are meant to be fabricated from pure copper, which is a very good electric conductor, and are thicker than double the skin depth at a frequency of 27 MHz. The properties used for all materials and tissues can be found in . An absorbing boundary condition was selected at the boundaries of the simulation domain. The total number of voxels per simulation was between 10.25 million and 10.97 million.
Thermal simulations were performed by solving the Pennes’ bioheat equation (PBE), using a finite-difference discretization [Citation48]. A double precision solver and five minutes of heating time were used. In the volume of the applicator, a grid step of 0.2 mm in the x- and y-direction and a grid step of 1 mm in the z-direction were used. In the rest of the model, a uniform 1 mm grid step was used. Metal structures were not considered in the temperature simulations. The properties used for the materials and tissues can be found in . A Dirichlet condition was used for the boundaries of the model, with an initial temperature of 37 °C for all boundaries, tissues, and materials. The total number of voxels per simulation was between 913 thousand and 987 thousand. The SAR levels were normalized on input power (ignoring reflections) and scaled such that the maximum observed temperature after 5 min of heating is 45 °C (8 °C temperature rise).
Validation of simulation model
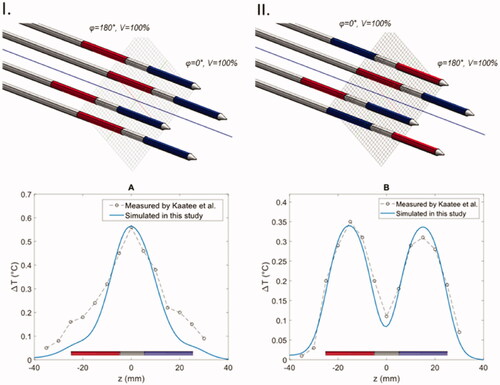
The simulation method was validated by comparing the calculated temperature distribution of the geometrically accurate MECS applicator models to experimentally measured temperature distributions in an agar phantom by Kaatee et al. [Citation29]. The measurements were performed on the central axis parallel to the applicators in two different phase configuration scenarios placed in a 15 × 15 mm square spacing. The temperature distribution was measured after 1 min of heating. The simulated temperature distributions and their relation to the temperature measurements are presented in . The mean absolute difference between the earlier measured temperature distributions and the newly simulated temperatures using the model of the classic MECS electrodes in two phase configuration scenarios A and B (as shown in ) was 0.06 and 0.02 °C, respectively. This shows decent agreement with the historical data, demonstrating the ability of our simulation model to approximately predict temperature distributions for the capacitively coupled electrodes. The same simulation settings are used in all results presented in the next section.
Figure 4. Comparison between simulated temperatures (blue line) and temperature measurements (points and dashed line) in two experiments with the MECS dual electrode applicators with different phase configurations. (I) In all applicators the distal and proximal electrodes have a 180° phase difference. (II) The power phase is inverted for two diagonal electrodes.
Results
Heating pattern of proof of concept applicator
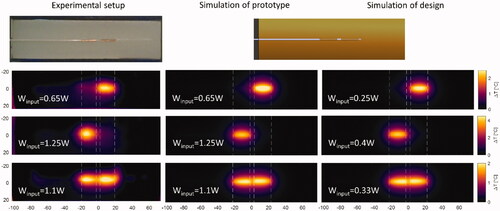
The handcrafted proof of concept prototype applicator in was heated for different power amplitudes and phases and the temperature was measured after 10 min of heating (left column). A theoretical model of the prototype applicator with similar dimensions as proof of concept prototype applicator was simulated at the same amplitude and phase settings as applied in the experimental setup (middle column, simulation of prototype). The designed applicator was simulated with a lower input power but same phase settings, to achieve similar heating levels as the prototype (right column, simulation of design). It can be observed that simulation and experiment lead to similar heating patterns, though with small variations caused by the irregularities in the shape of the handcrafted applicator. The same heating patterns can be reached with the designed applicator but at a significantly lower input power.
Figure 5. Experimental results of the ‘proof of principle prototype’ applicator and simulation results of the prototype, i.e., same dimensions as prototype applicator, and the applicator with the designed dimensions. Results shown are measured for the prototype (left column); simulated results for the prototype (middle column); simulated results for the designed applicator (right column). All temperature distributions are after 10 min of heating with colormaps of the heating patterns at the plane passing through the center of the applicator.
Stabilization time
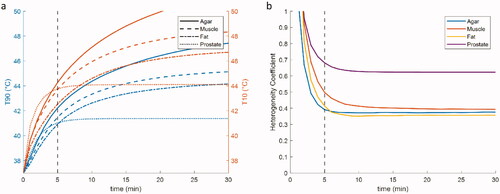
To be able to spatially characterize the heating pattern, it is important to know at which timepoint the heating pattern reaches a stable state. The temporal temperature rise from the baseline (37 °C) in an agar phantom (10 mm sided square spacing) at different timepoints during heating is shown in . The T10 and T90 values keep rising for the first 30 min of constant power application with a static phase configuration for the non-perfused agar. For the low perfusion muscle and fat, the T10 and T90 values approach a plateau at around 30 min, while the highly perfused prostate quickly reaches steady state at around 5 min of heating (). The HC stabilizes after 5 min of heating for all types of tissues (). makes it evident that an evaluation at a steady state temperature would not be ideal for the applicators, since this is not reached in a reasonable timeframe for all tissues. This is however not the case in the HC inside the VOI. In the following results, we evaluate all temperature distributions after 5 min of heating, where the HC is stabilized.
Figure 6. Temperature distribution maps on plane A (see for geometry) for five consecutive timepoints in the first five minutes of heating in the static phase configuration: (I). The static phase configuration was applied. Blue: 0 phase shift, Red: 180° phase shift; (II) t = 33.3s; (III) t = 100 s; (IV) t = 166.7s; (V) t = 233.3s; (VI) t = 300s. The VOI is visible as a dashed purple line, as are the isotemperature contours (green lines) of 41 and 44 °C.
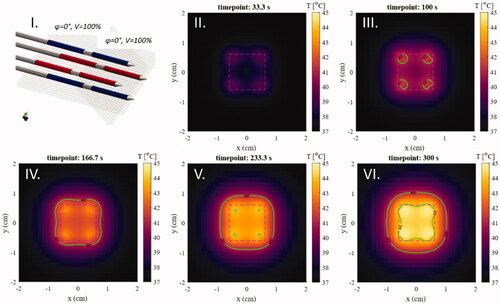
Figure 7. Temporal temperature distribution change for four TB applicators placed at a 10 mm configuration under constant power in different tissues. (a) The evolution of the T10 (orange line) and T90 (blue line) values over time in the box enclosing the active lengths of the applicators. (b) The evolution of the HC over time.
Temperature heterogeneity in different tissue types
The T10, T90, HC values for both 10 mm and 15 mm setups after 5 min of heating in homogenous phantoms of different tissues – agar, muscle, fat, and prostate – can be found in . Cumulative Temperature Volume Histograms (CTVH) of all tissue types for both setups can be found in . The temperature distribution in all tissue types was similar, with higher temperatures around the electrodes and lower temperatures in the center of the VOI. As an example, the temperature map in an agar phantom after 5 min of heating can be seen in . The temperature heterogeneity was higher in the highly perfused prostate tissue type and in all cases the 15 mm spacing provided a more inhomogeneous heating pattern.
Figure 8. CTVH of the box enclosing the active lengths of the four applicators for different tissues of the (I) 10 mm and (II) 15 mm setup. The T10 and T90 values are visible as horizontal lines.
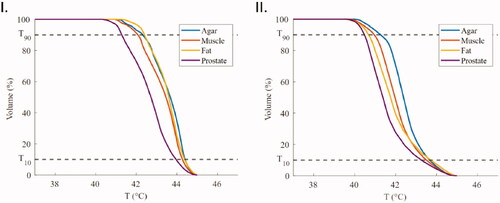
Figure 9. Temperature maps along the major cross-sections A, B, and C ( for geometry) after 5 min of heating in an agar phantom for (I) the 10 mm square spacing and (II) the 15 mm square spacing. Isotemperature contours of 41 and 44 °C are visible on all images in green.
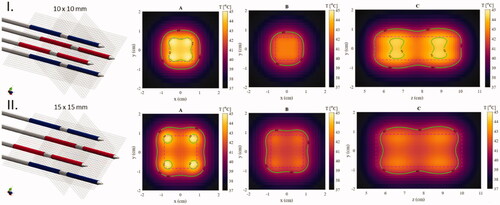
Table 2. T10, T90, and HC values for the TB dual electrode applicators for homogeneous phantoms of different tissue types and two different applicator spacings after 5 min of heating.
Longitudinal temperature steering
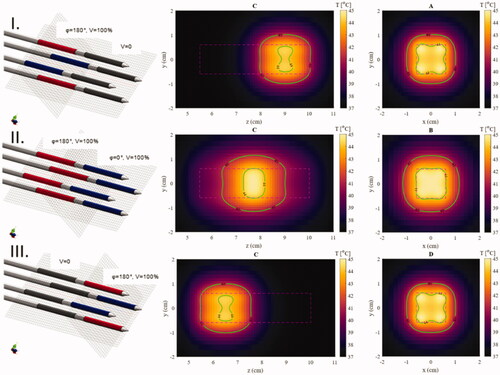
In , three different amplitude and phase configurations were applied in the setup with 10 mm spacing in the agar phantom to demonstrate the ability for longitudinal temperature steering. By selecting the proper amplitude and phase settings, a cubic-like heating region with an edge length of 20 mm and temperatures of 41-45 °C can be created after 5 min of heating.
Figure 10. Temperature maps after 5 min of heating in an agar phantom for different phase configurations showing the ability to define a specific region along the catheter that is heated. Isotemperature contours (green lines) of 41 and 44 °C are visible on all images. Left: The phase and power configuration of the electrodes (dark gray: no power, blue: phase is 0, red: phase is 180°). Center: The central longitudinal plane parallel to the applicators showing the control of the longitudinal position of the focused area (cross-section C in ). Right: The central plane of the focused area perpendicular to the applicators (cross-sections A, B, or D in ).
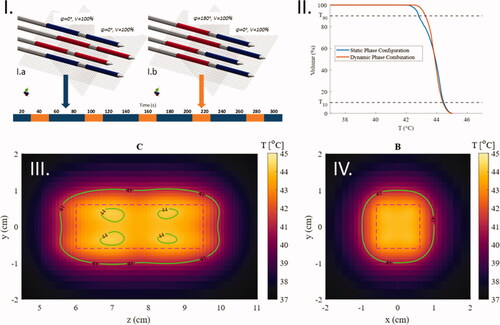
In two phase configurations were combined by alternating between phase configuration I.a (used previously as the static configuration) and I.b (used previously for heating the central part of the active length). The first phase configuration was applied for 40 s per minute and the latter was applied for 20 s per minute using the same amplitude. This homogenized the temperature distribution in the middle of the active length of the applicator. For the VOI shown in the HC of the dynamic phase configuration was 0.19, while the static phase configuration I.a for the same volume had a HC of 0.28. The T90 and T10 values can be derived from .
Figure 11. Temperature maps after 5 min of heating in an agar phantom with a dynamic combination of two phase configurations. (I) The phase schedule applied during the heating time. (II) CTVH comparison between the static phase configuration and the dynamic phase configuration in the VOI presented in the temperature maps (III and IV). (III) The central plane parallel to the applicators (cross-section C in ). (IV) The plane in the center of the active length of the applicators (cross-section B in ).
Discussion
With the introduction of the novel TB applicators, we aim to open the field of applications that can perform simultaneous thermal enhancement of radiotherapy [Citation37]. To achieve a therapeutic benefit in simultaneous heating, either the radiation distribution, or temperature distribution, or both of them, need to be highly focused in the target area. Therefore, we believe that IHT and HDR-BT, having both the advantage of locally depositing their thermal and radiation dose respectively, are the best contenders for successful simultaneous RT and HT application.
Interstitial application of HT has had trouble establishing itself as a widely-used HT option, with only one commercial device currently available (BSD-500, Pyrexar Medical) and with the most potent MECS system having been inactive for almost two decades. One can argue that the therapeutic advantages were not sufficient to contrast the invasive nature of the systems. However, with the novel TB applicators, we would like to deal with these issues in two ways. Firstly, the increased TER, when combined simultaneously with BT radiation, gives a higher therapeutic value to the HT treatment, while not causing any additional invasiveness to the patient; i.e., the catheter insertion would be the same as in a typical HDR-BT procedure. Secondly, we provide advanced steering control of the HT treatment with the introduction of dynamic switching between different phase combinations and the technological benefits resulting from the novel applicator and system design.
We demonstrated in this study that, using the static phase configuration, the temperature heterogeneity of the TB applicators is low [Citation25,Citation39] (HC = 0.39–0.62) for the maximum allowed applicator distance (10 mm) in prostate HDR-BT. The TB system maintains the advantages of the MECS system [Citation24] without some of its disadvantages: One of the major issues of the classic MECS applicator was the occurrence of high temperatures inside the applicator during operation [Citation43]. Less impact of high temperatures in the catheter can be expected in the TB applicator due to the much thinner dielectric layer between the electrodes and the tissue. The thinner dielectric layer is also expected to improve the efficiency of the applicators, with a higher proportion of the power delivered to the target tissue. This is also evident in , where less power is needed for the designed (30 μm parylene layer) applicator to reach the same temperature elevations as the prototype applicator (0.1 mm dielectric layer).
Looking at the differences in temperature heterogeneity for different tissue types ( and ), we see that perfusion plays a significant role in the heterogeneity of the temperature distribution. Although it is unclear whether such high perfusion values for prostate tissue are accurate during HDR-BT with its large number of catheters inserted. The only study on prostate perfusion during IHT found values in the range of the value used in this study (470 ± 50 ml/kg/min) [Citation33] using temperature decay data. In , we see that homogeneous heating of the well-perfused prostate tissue is more challenging, resulting in a higher HC than in the case of the agar phantom material in both the 10 mm and 15 mm spacing setups. However, we see that the decreased applicator spacing can provide more homogenous heating. This can potentially provide better target coverage than the study by van Vulpen et al. [Citation22] where an average of only 12 catheters was placed in each treatment.
The ability to control the temperature along the applicator length is an important attribute for a successful treatment [Citation33,Citation39]. In this study, we demonstrated that phase steering (), provided additional steering control compared to electrode selection ()). Furthermore, we proposed the use of dynamic switching between different phase configurations (), which will enhance the longitudinal temperature control of the system during treatment. This concept is demonstrated in one simple example; however, the use of multiple variables to control temperature will provide more degrees of freedom to achieve a homogeneous (or desired) temperature distribution in complex scenarios. For the utilization of the phase-based temperature steering, a power supply system needs to be developed, which will be able to rapidly switch between different phase and amplitude settings.
Given the positive theoretical results and proof of concept, our effort will be steered toward the fabrication of the TB applicator in a precise and reproducible manner. The MECS applicator was handcrafted and fabricated using silver paint, thus dealing with the issue of limited reproducibility. The less than ideal conductivity of silver might also have had an impact on the heating ability of the applicator, since lower conductivity might have caused resistive heating. The deposition of three-dimensional conductive layers on flexible thermoplastic is technically challenging. However, there are currently methods available for the precise deposition of a high-quality and high purity conductive layer on 6 F thermoplastic catheters [Citation49,Citation50]. The possibility of inconsistencies in the copper layer thickness has already been considered, with the aimed copper thickness (30 μm) being more than double the skin depth for copper at 27 MHz (12.5 μm) [Citation51]. The proposed applicator will increase from 2 mm to 2.12 mm (i.e., 6%) in diameter compared to the standard 6 F afterloading catheter, used for HDR-BT only. The diameter increase can be justified in relation to the potential clinical benefit. In the end, the increased diameter may lead to a small, if any, adjustment in the brachytherapy template. Alternatively, the deposition could be applied to 5 F afterloading catheters, since the principle would remain the same. Further experimental results might lead to small alterations in the proposed model. Once the industrially fabricated TB is available we will have realistic data available on the electrical resistance of the feeding wires and electrodes. With these values as a starting point, we will perform more in-depth investigations on the impact of resistance on wire/electrode heating and allowable currents. At this moment it is important to note that neither current calculations nor experiments show significant heating of the electrode wires due to resistive heating or the need for excess currents ().
In this study, we only investigated the heating pattern in homogenous tissues. A real prostate is enclosed by other tissue types (mainly fat and muscle). Especially in the case of tumorous tissue, the prostate might be inhomogeneous in terms of electric properties, thermal properties, and perfusion. The ability to model the inhomogeneities of the tissue will be crucial in the successful application in a real patient. Furthermore, in this study we investigated a simple scenario of four applicators in which we demonstrated the longitudinal steering ability of our applicators. In a real patient scenario with more implants, the degrees of freedom are too many for manual treatment planning, especially in the case of dynamic steering (multiple phase and amplitude settings per electrode). Therefore, there will be a need for automated treatment plan optimization, as is already done for regional hyperthermia [Citation52,Citation53] and brachytherapy [Citation54].
For the temporal sequence, various options exist. The most straightforward is that the HDR-BT treatment will start just after the pre-heating time, when the desired stable temperature has been reached. This ensures true simultaneous application of the two modalities. For safety reasons, the RF power to the applicator will be switched off when the radiation source is in that single specific applicator, but stays on in the surrounding applicators. Since the dwelling time of the radiation source inside a single catheter is quite short and only the RF-power to one applicator is turned off, we expect no significant drops in overall thermal doses.
Temperature can be measured as is defined by the ESHO guidelines on Interstitial Hyperthermia, with the insertion of additional catheters for thermometry. A very good example of how this could be performed for the prostate is described in the study of Kukielka et al. [Citation1]. A scheme like this would mean that for volumetric temperature estimation, we would be relying much more on our temperature modeling. From the results reported in this study this seems a feasible approach.
The current practice in HT is to apply heat for 60 min. This is considerably longer than the delivery time of radiation in HDR-BT. In the current setting, the delivery time could become shorter considering the very high thermal enhancement of simultaneous heating and radiation delivery. Nevertheless, overall treatment time can be considerably reduced, since the addition of IHT to the HDR-BT fraction can be favorable for further hypofractionation, and this can additionally lead to a reduced number of individual implantations. Those options should be considered in future research.
With the introduction of the simultaneous HT and HDR-BT application, a novel treatment planning and treatment delivery strategy need to be investigated, focusing on BED distribution rather than separate radiation dose and thermal dose distribution. An option is to perform BED optimization by combined adaptation of the radiation and thermal dose. For this, rapid calculation of both thermal and radiation doses is necessary. The FDTD electromagnetic simulation method, which has been used in this study, is reliable but computationally expensive and inefficient in the low frequencies, especially when dealing with large models (high voxel count). The 27 MHz frequency allows the use of quasi-static simulation algorithms [Citation55], which offer shorter calculation times and could offer near-real-time treatment planning, as will be needed in our application. These, however, need to be evaluated for their accuracy and adapted for the specific application.
Conclusion
We introduced the novel TB applicator, which allows for simultaneous application of IHT and HDR-BT. The applicator serves as an afterloading catheter for HDR-BT and is, therefore, based on the geometry of the currently used afterloading catheters. The current practice of HDR-BT catheter placement with ≤10 mm spacing between applicators, improves radial temperature distribution. The introduction of dynamic switching between different phase configurations will improve longitudinal temperature control. Biological studies indicate that simultaneous application of HT and radiation provide the highest TER. In general, the proposed TB applicators have the potential to successfully integrate into the current clinical BT routine and may enhance treatment performance. Additional research is needed for the fabrication of the applicators, on the design of the power supply system, and a novel treatment planning and delivery process.
Disclosure statement
No potential conflict of interest was reported by the author(s).
Correction Statement
This article has been republished with minor changes. These changes do not impact the academic content of the article.
Additional information
Funding
References
- Thiruthaneeswaran N, Hoskin PJ. High dose rate brachytherapy for prostate cancer: standard of care and future direction. Cancer Radiother. 2016;20(1):66–72.
- Chin J, Rumble RB, Kollmeier M, et al. Brachytherapy for patients with prostate cancer: American Society of Clinical Oncology/Cancer Care Ontario joint guideline update. J Clin Oncol. 2017;35(15):1737–1743.
- Demanes DJ, Ghilezan MI. High-dose-rate brachytherapy as monotherapy for prostate cancer. Brachytherapy. 2014;13(6):529–541.
- Aluwini S, Pos F, Schimmel E, et al. Hypofractionated versus conventionally fractionated radiotherapy for patients with prostate cancer (HYPRO): acute toxicity results from a randomised non-inferiority phase 3 trial. The Lancet Oncology. 2015;16(3):274–283.
- Morton GC, Hoskin PJ. Brachytherapy: current status and future strategies – can high dose rate replace low dose rate and external beam radiotherapy? Clin Oncol. 2013;25(8):474–482.
- Kollmeier MA, McBride S, Taggar A, et al. Salvage brachytherapy for recurrent prostate cancer after definitive radiation therapy: a comparison of low-dose-rate and high-dose-rate brachytherapy and the importance of prostate-specific antigen doubling time. Brachytherapy. 2017;16(6):1091–1098.
- Murgic J, Morton G, Loblaw A, et al. Focal salvage high dose-rate brachytherapy for locally recurrent prostate cancer after primary radiation therapy failure: results from a prospective clinical trial. Int J Radiat Oncol Biol Phys. 2018;102(3):561–567.
- Chatzikonstantinou G, Zamboglou N, Rödel C, et al. High-dose-rate brachytherapy as salvage modality for locally recurrent prostate cancer after definitive radiotherapy : a systematic review. Strahlenther Onkol. 2017;193(9):683–691.
- Tselis N, Hoskin P, Baltas D, et al. High dose rate brachytherapy as monotherapy for localised prostate cancer: review of the current status. Clin Oncol. 2017;29(7):401–411.
- Mendez LC, Ravi A, Chung H, et al. Pattern of relapse and dose received by the recurrent intraprostatic nodule in low- to intermediate-risk prostate cancer treated with single fraction 19 Gy high-dose-rate brachytherapy. Brachytherapy. 2018;17(2):291–297.
- Armstrong S, Tsang Y, Lowe G, et al. Dosimetry of local failure with single dose 19 Gy high-dose-rate brachytherapy for prostate cancer. Radiother Oncol. 2021;157:93–98.
- Horsman MR, Overgaard J. Hyperthermia: a potent enhancer of radiotherapy. Clin Oncol. 2007;19(6):418–426.
- Datta NR, Ordóñez SG, Gaipl US, et al. Local hyperthermia combined with radiotherapy and-/or chemotherapy: recent advances and promises for the future. Cancer Treat Rev. 2015;41(9):742–753.
- Datta NR, Bodis S. Hyperthermia with radiotherapy reduces tumour alpha/beta: Insights from trials of thermoradiotherapy vs radiotherapy alone. Radiother Oncol. 2019;138:1–8.
- Ryu S, Brown SL, Kim S-H, et al. Preferential radiosensitization of human prostatic carcinoma cells by mild hyperthermia. Int J Radiat Oncol Biol Phys. 1996;34(1):133–138.
- Pajonk F, van Ophoven A, McBride WH. Hyperthermia-induced proteasome inhibition and loss of androgen receptor expression in human prostate cancer cells. Cancer Res. 2005;65(11):4836–4843.
- Tilly W, Gellermann J, Graf R, et al. Regional hyperthermia in conjunction with definitive radiotherapy against recurrent or locally advanced prostate cancer T3 pN0 M0. Strahlenther Onkol. 2005;181(1):35–41.
- Hurwitz MD, Hansen JL, Prokopios‐Davos S, et al. Hyperthermia combined with radiation for the treatment of locally advanced prostate cancer: long-term results from Dana-Farber Cancer Institute Study 94-153. Cancer. 2011;117(3):510–516.
- Maluta S, Dall'Oglio S, Romano M, et al. Conformal radiotherapy plus local hyperthermia in patients affected by locally advanced high risk prostate cancer: preliminary results of a prospective phase II study. Int J Hyperthermia. 2007;23(5):451–456.
- Prionas SD, Kapp DS, Goffinet DR, et al. Thermometry of interstitial hyperthermia given as an adjuvant to brachytherapy for the treatment of carcinoma of the prostate. Int J Radiat Oncol Biol Phys. 1994;28(1):151–162.
- Kukiełka AM, Hetnał M, Brandys P, et al. Interstitial hyperthermia of the prostate in combination with brachytherapy: an evaluation of feasibility and early tolerance. Strahlenther Onkol. 2013;189(6):467–475.
- van Vulpen M, Raaymakers BW, Lagendijk JJW, et al. Three-dimensional controlled interstitial hyperthermia combined with radiotherapy for locally advanced prostate carcinoma—a feasibility study. Int J Radiat Oncol Biol Phys. 2002;53(1):116–126.
- Williams VL, Puthawala A, Phan TP, et al. Interstitial hyperthermia during HDR brachytherapy monotherapy for treatment of early stage prostate cancer with benign prostate hyperplasia (BPH). Brachytherapy. 2007;6(2):86.
- Dobšíček Trefná H, Schmidt M, van Rhoon GC, et al. Quality assurance guidelines for interstitial hyperthermia. Int J Hyperthermia. 2019;36(1):277–294.
- Kok HP, van Haaren PM, van de Kamer JB, et al. Theoretical comparison of intraluminal heating techniques. Int J Hyperthermia. 2007;23(4):395–411.
- Marchal C, Nadi M, Hoffstetter S, et al. Practical interstitial method of heating operating at 27.12 MHz. Int J Hyperthermia. 1989;5(4):451–466.
- Visser AG, Deurloo IKK, Levendag PC, et al. An interstitial hyperthermia system at 27 MHz. Int J Hyperthermia. 1989;5(2):265–276.
- Deurloo IKK, Visser AG, Morawska M, et al. Application of a capacitive-coupling interstitial hyperthermia system at 27 MHz: study of different applicator configurations. Phys Med Biol. 1991;36(1):119–132.
- Kaatee RSJP, Crezee H, Kanis BP, et al. Spatial temperature control with a 27 MHz current source interstitial hyperthermia system. Int J Radiat Oncol Biol Phys. 1997;37(1):189–197.
- Van der Koijk JF, Crezee J, Van Leeuwen GMJ, et al. Dose uniformity in MECS interstitial hyperthermia: the impact of longitudinal control in model anatomies. Phys Med Biol. 1996;41(3):429–444.
- Raaymakers BW, Van Vulpen M, Lagendijk JJW, et al. Determination and validation of the actual 3D temperature distribution during interstitial hyperthermia of prostate carcinoma. Phys Med Biol. 2001;46(12):3115–3131.
- Hulshof M, Raaymakers BW, Lagendijk JJW, et al. A feasibility study of interstitial hyperthermia plus external beam radiotherapy in glioblastoma multiforme using the multi electrode current source (MECS) system. Int J Hyperthermia. 2004;20(5):451–463.
- van Vulpen M, Raaymakers BW, de Leeuw AAC, et al. Prostate perfusion in patients with locally advanced prostate carcinoma treated with different hyperthermia techniques. J Urol. 2002;168(4 Part 1):1597–1602.
- Hoskin PJ, Colombo A, Henry A, et al. GEC/ESTRO recommendations on high dose rate afterloading brachytherapy for localised prostate cancer: an update. Radiother Oncol. 2013;107(3):325–332.
- Dewey WC, Hopwood LE, Sapareto SA, et al. Cellular responses to combinations of hyperthermia and radiation. Radiology. 1977;123(2):463–474.
- Xu M, Wright WD, Higashikubo R, et al. Thermal radiosensitization of human tumour cell lines with different sensitivities to 41.1 degrees C. Int J Hypertherm. 1999;15(4):279–290.
- Overgaard J. The heat is (still) on-the past and future of hyperthermic radiation oncology. Radiother Oncol. 2013;109(2):185–187.
- Van der Koijk JF, Crezee J, Lagendijk JJW. Thermal properties of capacitively coupled electrodes in interstitial hyperthermia. Phys Med Biol. 1998;43(1):139–153.
- Van der Koijk JF, Lagendijk JJW, Crezee J, et al. The influence of vasculature on temperature distributions in MECS interstitial hyperthermia: importance of longitudinal control. Int J Hyperthermia. 1997;13(4):365–385.
- Chang TY, Yadav VG, De Leo S, et al. Cell and protein compatibility of parylene-C surfaces. Langmuir. 2007;23(23):11718–11725.
- Gaudreault M, Reniers B, Landry G, et al. Dose perturbation due to catheter materials in high-dose-rate interstitial (192)Ir brachytherapy. Brachytherapy. 2014;13(6):627–631.
- Hubbell JH, Seltzer SM. Tables of X-ray mass attenuation coefficients and mass energy-absorption coefficients 1 keV to 20 MeV for elements Z = 1–92 and 48 additional substances of dosimetric interest. Gaithersburg, MD (USA): National Institute of Standards and Technology-PL; 1995.
- Kaatee RSJP, Crezee H, Visser AG. Temperature measurement errors with thermocouples inside 27 MHz current source interstitial hyperthermia applicators. Phys Med Biol. 1999;44(6):1499–1511.
- Khawaji IH, Chindam C, Awadelkarim OO, et al. Dielectric properties of and charge transport in columnar microfibrous thin films of parylene C. IEEE Trans Electron Devices. 2017;64(8):3360–3367.
- Kahouli A, Sylvestre A, Jomni F, et al. Experimental and theoretical study of AC electrical conduction mechanisms of semicrystalline parylene C thin films. J Phys Chem A. 2012;116(3):1051–1058.
- Hasgall PA, Di Gennaro F, Baumgartner C, et al. IT’IS database for thermal and electromagnetic parameters of biological tissues. Version 4.0. 2018 May 15, 2018.
- Yee K. Numerical solution of initial boundary value problems involving maxwell's equations in isotropic media. IEEE Trans Antennas Propag. 1966;14(3):302–307.
- Pennes H. Analysis of tissue and arterial blood temperatures in the resting human forearm. J Appl Physiol. 1948;1(2):93–122.
- Kaiser M, Detert M, Rube MA, et al. Resonant marker design and fabrication techniques for device visualization during interventional magnetic resonance imaging. Biomedizinische Technik. [Biomed Eng]. 2015;60(2):89–103.
- Baysoy E, Yildirim DK, Ozsoy C, et al. Thin film based semi-active resonant marker design for low profile interventional cardiovascular MRI devices. Magnetic resonance materials in physics. MAGMA. 2017;30(1):93–101.
- Wheeler HA. Formulas for the skin effect. Proc Ire. 1942;30(9):412–424.
- Rijnen Z, Bakker JF, Canters RAM, et al. Clinical integration of software tool VEDO for adaptive and quantitative application of phased array hyperthermia in the head and neck. Int J Hyperthermia. 2013;29(3):181–193.
- Kok HP, Kotte A, Crezee J. Planning, optimisation and evaluation of hyperthermia treatments. Int J Hyperthermia. 2017;33(6):593–607.
- Breedveld S, Bennan ABA, Aluwini S, et al. Fast automated multi-criteria planning for HDR brachytherapy explored for prostate cancer. Phys Med Biol. 2019;64(20):205002.
- de Bree J, Van der Koijk JF, Lagendijk JJW. A 3-D SAR model for current source interstitial hyperthermia. IEEE Trans Biomed Eng. 1996;43(10):1038–1045.