
 ?Mathematical formulae have been encoded as MathML and are displayed in this HTML version using MathJax in order to improve their display. Uncheck the box to turn MathJax off. This feature requires Javascript. Click on a formula to zoom.
Abstract
Objectives
Fiducial markers improve accuracy in external beam radiation therapy (EBRT) for treatment of prostate cancer (PCa). However, many patients recur after EBRT necessitating additional treatment, such as MR-guided transurethral ultrasound ablation (TULSA). Residual markers may compromise TULSA through ultrasound field distortions and generation of local susceptibility artifacts. The objective was to investigate how markers affect the ablation outcome during clinical TULSA treatments.
Subjects and methods
A retrospective analysis was performed on nine patients with radiorecurrent PCa and residual markers who received TULSA. The MR susceptibility artifact was quantified as a function of marker type, size and orientation, in particular for thermometry. The spatial distribution of markers inside the prostate was recorded, and the resulting impact on the thermal dose was measured. The thermal dose measurements were directly compared to the residual enhancing prostatic tissue observed on the immediate and control post-TULSA contrast enhanced (CE) image.
Results
Successful thermal dose accumulation to the target boundary occurred for 14/20 (70%) of markers, confirmed with CE imaging. Gold markers situated simultaneously close to the urethra (≤12 mm) and far from the target boundary (≥13 mm) reduced the ultrasound depth of heating. Nitinol markers produced large, hypointense artifacts that disrupted thermometry and compromised treatment. Artifacts from gold markers were less pronounced, but when located near the target boundary, also affected treatment.
Conclusion
Marker composition, orientation and location inside the prostate can all potentially impact treatment outcome. Proper patient selection through detailed MRI screening is critical to ensure successful radiorecurrent PCa treatment outcomes with TULSA.
Introduction
A large percentage of patients diagnosed with localized prostate cancer (PCa) will be treated with external beam radiation therapy (EBRT) [Citation1]. To improve the accuracy of EBRT, multiple fiducial markers are implanted into the prostate [Citation2]. Markers are typically composed of gold but other materials are also available, and the markers can persist in the irradiated prostate indefinitely [Citation2]. Unfortunately, many patients experience local PCa recurrence after radiation therapy and may require additional treatment [Citation3]. Current salvage treatments are limited by toxicity and technical challenges, and there is a strong need for safe and effective alternatives [Citation4].
MR-guided transurethral ultrasound ablation (TULSA) is an emerging technology [Citation5,Citation6] which has been used to successfully treat radiorecurrent PCa [Citation7]. TULSA ablates tissue by delivering high-intensity, spatially directed ultrasound through a urethral catheter. Real-time MR thermometry plays a central role in the TULSA procedure by providing input to the closed-loop controller [Citation8]. MR thermometry is simultaneously used as a monitoring tool to ensure critical structures surrounding the prostate are spared, such as the urinary sphincter, rectal wall, and the neurovascular bundles.
Because TULSA uses thermal ultrasound to coagulate tissue, the presence of metal fiducial markers in the prostate can distort the ultrasound field [Citation9], causing a ‘shadowing effect’ of untreated tissue behind the marker. It is expected that the size and location of the marker relative to the TULSA catheter disturbs the ultrasound field in a manner similar to calcifications [Citation10]. Markers can also generate magnetic susceptibility artifacts [Citation11]. Thermometry is particularly sensitive to magnetic susceptibility changes [Citation12], and a large artifact on thermometry could corrupt the temperature measurements. Moreover, it is known that marker orientation also plays a role, with markers orthogonal to Bo, the static magnetic field, producing larger artifacts than those occurring when markers are parallel to Bo [Citation13]. The dependency of artifact size on marker type, size and orientation has been studied in gel phantoms [Citation14]. The influence of markers on ultrasound heating has also been investigated in both simulation [Citation9] and gel phantom studies [Citation14,Citation15]. However, these effects have not been well studied in a real-world clinical setting.
Several patients with various fiducial marker materials, sizes and orientations in the prostate have now been treated with TULSA. The purpose of this study was to determine what effect different markers had on the overall ablation outcome, using treatment-day thermal images and contrast-enhanced (CE) scans.
Methods
Study information
All clinical data, which were originally acquired as part of an investigator-initiated, prospective Phase-1 study (NCT03350529), were retrospectively analyzed. The study was conducted in accordance with the principles of the Declaration of Helsinki. The local ethics committee approved this study. Written informed consent was obtained from all participants.
Subjects
Nine study participants with fiducial markers underwent TULSA between November 2018 and October 2020 for the treatment of radiorecurrent PCa. Marker types included: Beammarks (Beampoint AB, Kista, Sweden) 1.2 × 5 mm nitinol markers; Goldlock (Beampoint AB, Kista, Sweden) 1 × 3 mm and 1 × 5 mm gold markers; and QLRAD (QLRAD Inc, Miami, Florida) 1.2 × 3 mm gold markers. One patient had 1 × 3 mm gold markers from an unknown manufacturer.
Description of intervention
TULSA is a minimally invasive procedure, which coagulates tissue by emitting high-intensity, spatially focused ultrasound through a urethral catheter. The ultrasound catheter is comprised of ten independent ultrasound elements (element dimensions: 5 mm length, 4.5 mm width) which are independently controlled. The entire procedure is performed under MR-guidance, to facilitate disease localization and assist with delineation of the treatment volume. Conformal ablation is achieved through a closed-loop controller, which measures temperature dynamics based on real-time thermometry images. After each new thermometry image is received (∼every 6s), the controller sends updated ultrasound power and frequency commands to each active ultrasound element. The ultrasound catheter continues rotating indefinitely until the entire treatment volume has been treated. The TULSA transducer elements are driven at both their first and third harmonic frequencies (4.3 MHz and 13.7 MHz). The frequency is modified by the controller during treatment depending on the target radius (≤14 mm yields high frequency; >14 mm low frequency). To achieve complete cell kill, the TULSA system seeks to deliver at least 240 cumulative equivalent minutes (CEM) to the entire target volume, as derived from thermal dose [Citation16].
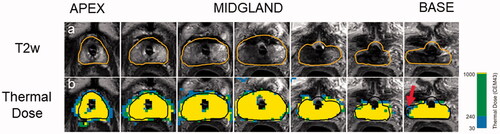
An example how the post-treatment images are used to make an initial quantitative assessment on treatment outcome is described in .
Figure 1. Quantitative assessment of treatment outcome post-TULSA. The desired ablation volume (orange line) is contoured from a high-resolution, transverse T2w treatment planning sequence, which was acquired through the prostate (a). Once contoured, the treatment objective is to deliver at least 240 cumulative equivalent minutes (CEM) to the prescribed boundary volume. A quantitative assessment of treatment outcome can be performed immediately post-treatment through inspection of cumulative thermal dose map (b). A small amount of undershoot can be seen on the patient’s right, near the base (red arrow), where the dose fails to reach the boundary. Undershoot can potentially change the follow-up care strategy due to residual cancer.
Imaging protocol
All patients underwent routine screening multiparametric MRI (mpMRI) prior to receiving TULSA, including diffusion (b-value 1500 mm/s2), dynamic contrast enhanced and T1-/T2-weighted scans (T1w/T2w). In addition, patients also received a screening thermometry scan. While thermometry is not a conventional mpMRI sequence, it is fundamental to TULSA and was added to our screening protocol.
On treatment-day, all patients were scanned with the default TULSA treatment planning sequence: a 12-slice, transverse T2w sequence used to visualize and contour the prostate, performed on a 3 Tesla scanner (Ingenia, Philips, Best, Netherlands). Each T2w MR slice was always centered on one of the ten ultrasound elements, with two additional monitoring slices on either end. Once the treatment plan was finalized, a real-time thermometry sequence, which was co-aligned with the T2w sequence, was acquired during the sonication with a dynamic update rate of ∼6s.
Immediately after the TULSA therapy, all patients received a CE T1w scan to look for signs of immediate cell kill. This was repeated at 3 months post-TULSA to account for any delayed cell kill effects. One patient had known metastatic PCa which mandated a different follow-up schedule, and therefore received their follow-up CE scan eight days post-TULSA. Detailed sequence information is available in Supplemental Digital Content S1.
Susceptibility artifact quantification
Screening transverse T2w, T1w, diffusion and thermometry images of the prostate were loaded separately into image processing software (Mango/UTHSCSA, San Antonio, TX). For each sequence, a trained radiologist (P.M.) contoured the artifact generated by the marker on each visible slice. Contouring was done in a random order to avoid any bias. The radiologist was also blinded to the patient number, sequence and implant type. Markers located outside the prostate were not considered. The volume, length and width of the susceptibility artifact was calculated for each marker. All marker types produced a characteristic hypointense void surrounded by a thin bright rim. The transition between the hypo- and hyper-intense region was designated as the edge of the artifact. Additionally, the size and orientation of markers was characterized relative to the main magnetic field, and the resulting influence on artifact size was measured. Supplemental Digital Content S2 demonstrates an example of fiducial marker segmentation on screening mpMRI.
Impact on ultrasound heating
Location of markers inside prostate
It was expected that certain marker locations within the prostate may influence the ultrasound heating pattern more than others. Marker location was characterized via two measurements: the distance from marker center to (a) the center of prostatic urethra and (b) the contoured target boundary. This measurement was performed on treatment-day planning T2w images (MicroDicom, Sofia, Bulgaria) and is illustrated in Supplemental Digital Content S3.
Impact of heating assessed from thermal dose
Any impact on ablation caused by fiducial markers was first assessed by examining signs of poor thermal dose coverage in the line-of-sight behind the markers. This was feasible to assess in prostate regions with good thermometry signal sufficiently far away from the marker center. However, thermal dose coverage in the direct vicinity of the markers could not be assessed due to the local disturbance of the magnetic field.
Thermal dose coverage was quantified by measuring the linear targeting accuracy in prostate regions with and without markers. To compute the linear targeting accuracy, first the isodose boundary was computed from the final cumulative thermal dose map. The isodose boundary was found by determining the distance at which the thermal dose transitions above 240 cumulative equivalent minutes (CEM) to below 240 CEM. This calculation was performed in interpolated one-degree angular increments with a step size of 0.2 mm, for all active ultrasound elements used during the therapy. The isodose boundary was then compared directly to the target boundary at each angular degree. The resulting difference in length ΔT between the two boundaries defined the linear targeting accuracy:
The global mean linear targeting accuracy across each active slice and all angles was calculated as [EquationEquation 1(1)
(1) ]:
(1)
(1)
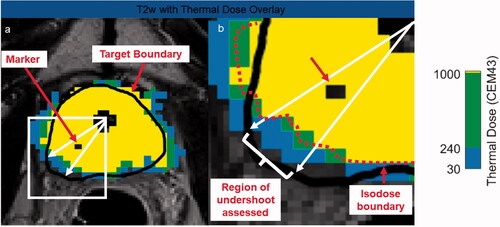
For any arbitrary angular region and slice, the linear targeting accuracy could also be calculated. describes how this measurement was performed when assessing the targeting accuracy in a specific sub-region where the markers were present.
Figure 2. Measurement of thermal undershoot attributable to marker. On each post-treatment thermal dose map, the angular region affected by each fiducial marker was calculated (a). For this specific angular region (b), the target boundary (black) was compared to the isodose boundary (red). If the black target boundary is larger than the red isodose boundary, this is considered thermal undershoot.
Impact of heating assessed from contrast-enhanced imaging
The maximum length of residual enhancing tissue behind each marker to the target boundary was measured on the immediate and control CE scans (MicroDicom, Sofia, Bulgaria). Values were recorded for each marker and compared directly to the thermal dose linear targeting accuracy measurements.
Results
Susceptibility artifact quantification
Twenty-two markers were located inside the prostate across nine different patients. The susceptibility artifact was most pronounced on the thermometry and diffusion scans, followed by the T1w and then finally the T2w sequence. The nitinol markers produced a large susceptibility artifact with approximate volumes of: 300, 600 and 1400 (mm3) for T2w, T1w and thermometry and diffusion imaging. The volumes for the susceptibility artifacts produced by nitinol markers were an order of magnitude larger than the gold markers. Nitinol markers created a thermometry/diffusion artifact that extended approximately 6 mm radially outwards from the marker center. Conversely, the three gold marker types had similar susceptibility artifact volumes: Range: 20–40 mm3 for T2w, 50–90 mm3 for T1w, 100–200 mm3 for diffusion and 200–300 mm3 for thermometry.
Thermometry was also used to characterize the length and width of the susceptibility artifact. For the two nitinol markers, the artifact dimensions represent an increase by an average factor of 2.6 in length and 10 in width relative to the actual, physical size of the markers. A similar effect was observed across all gold marker types, to a lesser degree, with the length and width increasing by factors of 1.5 ± 0.5 and 3.9 ± 0.9, respectively. Susceptibility artifact measurements for each marker type are summarized in Supplemental Digital Content S4. The appearance of nitinol and gold markers on MR is presented in Supplemental Digital Content S5.
The impact of artifact size on marker orientation relative to Bo was also investigated. Most markers (21/22) were generally situated vertically in the anterior-posterior direction, with maximum ± 25° offset from vertical. Only one patient had markers aligned both orthogonal and parallel to Bo (1 × 5 mm gold markers). For this patient, it was observed that the marker situated orthogonal to Bo produced an artifact length 20% larger than the same type of marker situated parallel to Bo. Similarly, the marker situated orthogonal to Bo produced an artifact width 86% larger than the same type of marker situated parallel to Bo.
Impact on ultrasound heating
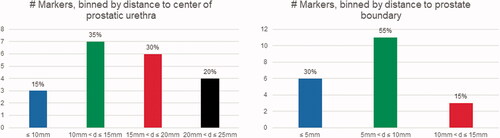
Two of the nine patients received focal instead of whole-gland ablation, and as a result, 2 of 22 markers fell outside the ultrasound treatment zone. For this reason, twenty markers overall were located directly in the treatment field. summarizes the spatial distribution of these twenty markers relative to (a) prostatic urethra and (b) prostate capsule. Markers tended to be at least 10 mm away from the urethra center (17/20, 85%). The majority also tended to be within 10 mm of the prostate capsule (17/20, 85%). Only one marker was located anteriorly, while the remainder were posterior to the prostatic urethra.
Figure 3. Distribution of markers inside the prostate relative to prostatic urethra center and prostate capsule.
The linear targeting accuracy across all nine patients in treated areas of the prostate without markers was 2.1 ± 1.6 mm (mean ± std), indicating that the isodose boundary extended beyond the target boundary in the absence of markers. All tissue inside the target volume received at least two sonication sweeps, which increased the total delivered thermal dose.
With confirmation from the control CE imaging findings, 14/20 markers (70%) did not impact treatment. is a case example demonstrating thermal dose accumulating to the target boundary, despite the presence of a gold marker in the ablation field.
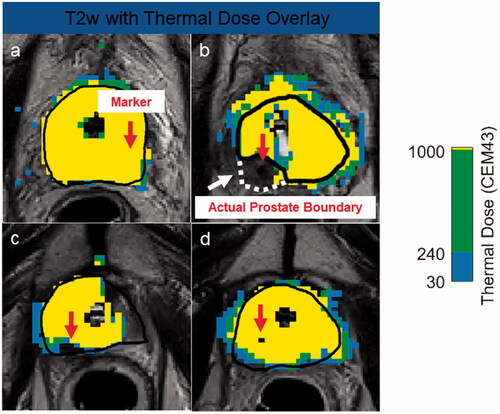
Figure 4. Case examples demonstrating different effects markers can have on thermal dose. Marker centers are shown with red arrows. Despite the presence of a gold marker, the thermal dose extends to the prescribed boundary (a). The large susceptibility artifact caused by the nitinol marker forced the user to move the target boundary (black) inside the actual prostate boundary (white), due to high temperature uncertainty (b). After focal treatment of patient’s right lobe, which was drawn outside the prostate capsule to include the neurovascular bundle, undershoot is caused by the gold marker located 9.1 mm from the urethra center and 14 mm from the target boundary. A gold marker situated close to the urethra center (12.4 mm) but far from the target boundary (13.5 mm) impeded the ultrasound wave resulting in poor thermal dose delivery inside the prostate (d).
However, two nitinol and four gold markers did impact treatment. The artifact from both nitinol markers corrupted the temperature measurements at the target boundary. Prior to the ablation, the clinical user adjusted the target boundary inwards to avoid the artifact, and therefore did not target the region of the prostate occupied with the markers. It was estimated that the 240 CEM isodose fell 8.3 and 9.7 mm inside the prostate capsule boundary (). The CE scans confirmed these findings: relative to the prostate capsule boundary, there was 3.2 and 8.3 mm of residual enhancing tissue immediately after TULSA and 2.6 and 6.8 mm of enhancing tissue on the control CE scan.
A distinct lack of thermal dose accumulation behind two gold markers was observed. The first gold marker (9.1 mm from the urethra center and 14mm from the target boundary) caused 6 mm of thermal dose undershoot (). Importantly, although the prostate was fully ablated to the capsule, the target boundary was contoured 6.5 mm beyond the prostate capsule, to include diseased neurovascular bundle. Therefore the undershoot occurred exclusively outside the prostate. The second gold marker (12.4 mm from the urethra center and 13.5 mm from the target boundary) caused 3.5 mm of thermal dose undershoot (). Multiple sweeps of the ultrasound beam through marker regions yielded undershoot reduction. However, these reductions were insufficient for heating the target boundary. The observed lack of thermal dose accumulation behind these two gold markers was corroborated by CE MRI. For the first marker, there was 5.5 and 4.9 mm of residual enhancing tissue immediately and 3 months after TULSA, respectively. For the second marker, there was 5.0 and 3.6 mm of residual tissue immediately after and 3 months post-TULSA at the same timepoints. presents the thermal dose maps and associated CE scans for both a successful and unsuccessful ablation outcome.
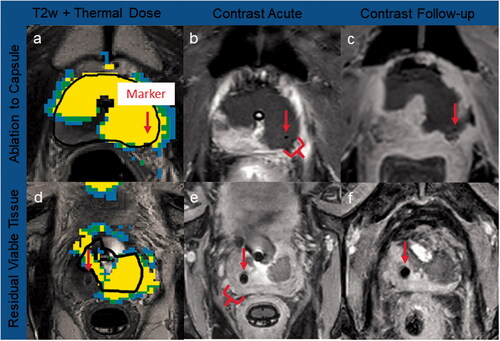
Figure 5. Case examples of thermal dose and contrast-enhanced imaging. Marker centers are shown with red arrows. Ablation to capsule: a gold marker located did not impact ultrasound heating, with thermal dose (a) accumulating to the prostate capsule, and no residual tissue post-TULSA confirmed on acute (b) and 3-month CE imaging (c). Residual viable tissue: significant amounts of prostate tissue were left outside treatment field due to thermometry contamination from the nitinol artifact, leading to extensive undershoot behind the marker (d), confirmed on acute (e) and 8-day CE imaging (f).
Two additional gold makers showed a discrepancy between the thermal dose and CE findings. Although the thermal dose reached the target boundary, there was still 2.4 and 1.6 mm of residual tissue left at 3 months based on CE imaging. Both markers were situated close to the target boundary (3.7 and 4.1 mm, respectively). Otherwise, the thermal dose linear targeting accuracy measurements showed good agreement with the 3-month CE measurements, with a difference between thermal dose undershoot and CE undershoot of −0.2 ± 0.8 mm for all gold markers, regardless of their size, orientation, or location inside the prostate. The difference between thermal dose and the immediate CE scan was −2.3 ± 2.0 mm. The results for all markers are summarized in Supplemental Digital Content S6.
Discussion
In this study we performed a retrospective technical analysis on patients treated for radiorecurrent PCa with TULSA, to assess the impact of fiducial markers on the final ablation outcome.
The nitinol markers produced a significant ‘blooming’, hypointense void that was an order of magnitude larger than gold markers. This blooming caused extensive thermometry contamination at the target boundary, which is problematic because the TULSA controller relies heavily on target boundary temperatures to fine-tune the ultrasound output [Citation8]. False temperature readings on the target boundary are more likely to produce either over- or undertreatment. Anticipating this risk prior to the ablation, the operator adjusted the target boundary inwards in front of both nitinol markers, avoiding the signal dropout from the artifact. However, substantial prostate tissue was left outside the treatment field. This expected but undesired sparing was confirmed on all post-TULSA CE imaging. A more robust controller that considers not only temperatures at the target boundary, but also multiple temperature control points along a particular line-of-sight would overcome this problem. Although nitinol markers situated parallel to Bo may produce smaller artifacts [Citation13], it is our recommendation that patients with nitinol markers undergo extensive screening MRI, to ensure the thermometry artifact does not extend into the desired treatment zone.
Gold markers also produced detectable thermometry artifacts. Our clinical observations agree with the gel phantom findings from Mougenot et al. [Citation14]. The authors observed that a 1.1x10mm gold marker increased by a factor in length (1.2–1.4×) and width (3.2–5.9×) from its actual size, which is similar to our findings of 1.5 and 3.9× for length and width, respectively. Similar to Mougenot et al. [Citation14], we also identified effects of the orientation of the marker relative to Bo. Our results showed that markers situated orthogonal to Bo produced artifacts almost twice as large in width as those markers situated parallel to Bo.
Gold markers located near the target boundary (<4 mm away) lead to inaccurate interpretations of accumulated thermal dose. Thermal dose linear targeting accuracy measurements behind two gold markers showed accumulation extending beyond the target boundary, but the immediate and control CE scans revealed persistent, enhancing prostatic tissue. We also observed that the treatment controller mistakenly shut off power for a short period of time on this case. Physicians enrolling patients with gold markers near the prostate capsule should be prepared to adapt by making small, millimeter adjustments to extend their target boundary just beyond the influence of the gold susceptibility artifact. Such optimizations will improve the reliability of the thermal dose measurements behind the markers and mitigate the risk of treatment controller perturbations.
Two other gold markers caused substantial thermal dose undershoot, due to an apparent ultrasound ‘shadowing’ effect. Both markers were uniquely positioned relative to all other markers, situated simultaneously close to the prostatic urethra (≤12 mm) and far from the target boundary (≥13 mm). A distinct lack of heating behind the markers was observed, even though no accidental power shut off was recorded. The observation of this ‘shadowing’ effect is consistent with gel phantom findings from Bakaric et al. [Citation15]. The authors observed that when markers are located as far as 15 mm in front of the natural transducer focus, a 100% decrease in lesion size at the intended targeting depth can be expected, as well as increased heat deposition in front of the marker due to reflections. The increased accumulation of heat in front the marker and contribution from unaffected neighboring elements were insufficient to overcome the lack of active heating. In the case of both of these gold markers, the thermal dose findings were confirmed on CE imaging with clear enhancing tissue remaining in the prostate. This undesirable location inside the prostate may have arisen through initial marker misplacement, migration of the marker within the prostate or random chance [Citation2]. One of these patients had extra-prostatic extension of the disease into the neurovascular bundle, which is common in a post-EBRT setting [Citation17]. For this case, all undershoot occurred outside the prostate. Additional mechanisms besides a disruption to the ultrasound propagation may have also contributed, including additional tissue interfaces outside the prostate which impacted ultrasound transmission, or increased perfusion outside the prostate from the neurovascular bundle which removed the active heating.
It is noteworthy that fourteen gold markers (14/18, 78%) did not impact the thermal dose accumulation, as confirmed through post-TULSA CE imaging, even though ten markers were situated close to the urethra (3 markers <10 mm, 7 markers <15 mm). However, all ten markers were situated at most 7.5 mm away from the target boundary. Overall, thirteen of these fourteen markers were <8 mm away from the prostate capsule, which is consistent with the transperineal or transrectal implantation technique [Citation18]. This type of positioning far from the urethra is intended to avoid marker voiding [Citation2]. Adequate thermal coverage likely reflects a combination of sufficient heat dissipation behind the markers as needed to overcome the absence of active ultrasound heating, and heat diffusion from neighboring prostate tissue unaffected by the markers. Similar effects have been observed for calcifications in simulation studies [Citation10]. Importantly, all patients received at least two sweeps of heating through the entire target volume to ensure complete cell kill. Due to the real-time monitoring of MR thermometry, a subset of patients required an additional third or fourth sweep through the prostate regions with markers, due to feedback that insufficient thermal dose had reached the target boundary. The ablation was repeated until the necessary 240 CEM of thermal dose accumulated to the prescribed boundary.
Except for susceptibility-weighted artifacts near the target boundary that contaminated the thermal maps, the 240 CEM thermal dose linear targeting measurements were in strong agreement with the control CE scan, but less so with the immediate CE scan. This is not unexpected, as it has been well-documented that the full extent of cell kill after ultrasound ablation can take up to 3 weeks [Citation19]. Phantom studies [Citation14,Citation15] reported that that large ablation volumes were less likely to be influenced by markers, which is consistent with the large ablation volumes of TULSA.
There were several limitations in this study, the most significant being that only nine patients were retrospectively analyzed. Further studies are needed with greater number of patients and markers to strengthen the conclusions of the study. A prospective study to evaluate the treatment planning considerations informed by the present findings is necessary. The influence of inter-operator variability on artifact size was not assessed in the present study. However, based on the findings from Maspero et al. [Citation20], who investigated inter-operator variability in the context of MRI-guided prostate radiotherapy planning, we do not expect significant variability between radiologist readers.
The results discussed here can be generalized to other applications. In-bore MR-guided biopsies rely on MR image-guidance for needle localization, but nitinol seeds could disrupt the procedure [Citation21]. A number of ablative technologies used to treat PCa rely on MR thermometry for image-guidance [Citation22], and the associated susceptibility artifacts of nitinol and gold markers would equally disrupt these interventions. The impact on ablation outcome from fiducial markers due to distortions of the ultrasound field would translate to other ultrasound-based ablation techniques for PCa [Citation23]. Similarly, certain patients diagnosed with benign prostatic hyperplasia are treated via urological implants, which are made of a composite stainless steel and nitinol alloy and remain in the prostate indefinitely after treatment [Citation24]. It has been shown that these types of markers produce large artifacts on the T2 and diffusion MRI sequences [Citation25], which could obscure diseased tissue and create similar challenges for any MR-guided intervention.
To summarize, patients with nitinol markers should only be recommended for the TULSA procedure if screening MRI can confirm the artifact does not extend near the planned targeted tissue. Patients with gold markers near the target boundary should also be carefully screened for artifacts, and if enrolled small outward adjustments may be required. Gold markers located simultaneously close to the transurethral source but far from target boundary may lead to undertreatment due to an ultrasound shadowing effect.
Supplemental Material
Download PDF (416.1 KB)Disclosure statement
Cameron Wright is employed by Profound Medical Corp. Peter J. Boström has received speaker fees from Profound Medical.
References
- Wallis CJD, Saskin R, Choo R, et al. Surgery versus radiotherapy for clinically-localized prostate cancer : a systematic review and meta-analysis. Eur Urol. 2016;70(1):21–30.
- O’neill AGM, Jain S, Hounsell AR, et al. Fiducial marker guided prostate radiotherapy: a review. Br J Radiol. 2016;89(1068):1–18.
- Cornford P, Bellmunt J, Bolla M, et al. EAU-ESTRO-SIOG guidelines on prostate cancer. Part II: treatment of relapsing, metastatic, and Castration-Resistant prostate cancer. Eur Urol. 2017;71(4):630–642.
- Ingrosso G, Becherini C, Lancia A, et al. Nonsurgical salvage local therapies for radiorecurrent prostate cancer: a systematic review and meta-analysis. Eur Urol Oncol. 2020;3(2):183–197.
- Klotz L, Pavlovich CP, Chin J, et al. Magnetic resonance imaging-guided transurethral ultrasound ablation of prostate cancer. J Urol. 2021;205(3):769–779.
- Lumiani A, Samun D, Sroka R, et al. Single center retrospective analysis of fifty-two prostate cancer patients with customized MR-guided transurethral ultrasound ablation (TULSA). Urol Oncol Semin Orig Invest. 2021;000:0–7.
- Anttinen M, Mäkelä P, Viitala A, et al. Salvage magnetic resonance imaging-guided transurethral ultrasound ablation for localized radiorecurrent prostate cancer: 12-month functional and oncological results. Eur Urol Open Sci. 2020;22:79–87.
- Burtnyk M, N’Djin WA, Kobelevskiy I, et al. 3D conformal MRI-controlled transurethral ultrasound prostate therapy: validation of numerical simulations and demonstration in tissue-mimicking gel phantoms. Phys Med Biol. 2010;55(22):6817–6839.
- Georgiou PS, Jaros J, Payne H, et al. Beam distortion due to gold fiducial markers during salvage high-intensity focused ultrasound in the prostate. Med Phys. 2017;44(2):679–693.
- Suomi V, Treeby B, Jaros J, et al. Transurethral ultrasound therapy of the prostate in the presence of calcifications: a simulation study. Med Phys. 2018;45(11):4793–4805.
- Jonsson JH, Garpebring A, Karlsson MG, et al. Internal fiducial markers and susceptibility effects in MRI - simulation and measurement of spatial accuracy. Int J Radiat Oncol Biol Phys. 2012;82(5):1612–1618.
- Tatebe K, Ramsay E, Mougenot C, et al. Influence of geometric and material properties on artifacts generated by interventional MRI devices: relevance to PRF-shift thermometry. Med Phys. 2016;43(1):241–253.
- Schenck JF. The role of magnetic susceptibility in magnetic resonance imaging: MRI magnetic compatibility of the first and second kinds. Med Phys. 1996;23(6):815–850.
- Mougenot C, Moonen C. Magnetic resonance-guided high intensity focused ultrasound in the presence of biopsy markers. J Ther Ultrasound. 2017;5(1):1–11.
- Bakaric M, Martin E, Georgiou PS, et al. Experimental study of beam distortion due to fiducial markers during salvage HIFU in the prostate. J Ther Ultrasound. 2018;6(1):1–11.
- Sapareto SA, Dewey WC. Thermal dose determination in cancer therapy. Int J Radiat Oncol Biol Phys. 1984;10(6):787–800.
- Jansen BHE, van Leeuwen PJ, Wondergem M, et al. Detection of recurrent prostate cancer using prostate-specific membrane antigen positron emission tomography in patients not meeting the phoenix criteria for biochemical recurrence after curative radiotherapy. Eur Urol Oncol. 2021;4(5):821–825.
- Hellinger JC, Blacksberg S, Haas J, et al. Interventional uroradiology in the management of prostate cancer. Appl Radiol. 2015;44(9):40–41.
- Anttinen M, Mäkelä P, Suomi V, et al. Feasibility of MRI-guided transurethral ultrasound for lesion-targeted ablation of prostate cancer. Scand J Urol. 2019;53(5):295–302.
- Maspero M, Seevinck PR, Willems NJW, et al. Evaluation of gold fiducial marker manual localisation for magnetic resonance-only prostate radiotherapy. Radiat Oncol. 2018;13(1):105.
- Fütterer JJ, Moche M, Busse H, et al. In-bore MR-guided biopsy systems and utility of PI-RADS. Top Magn Reson Imaging. 2016;25(3):119–123.
- Zhu M, Sun Z, Ng CK. Image-guided thermal ablation with MR-based thermometry. Quant Imaging Med Surg. 2017;7(3):356–368.
- Chaussy CG, Thüroff S. High-Intensity focused ultrasound for the treatment of prostate cancer: a review. J Endourol. 2017;31(S1):S30–S37.
- Roehrborn CG, Barkin J, Gange SN, et al. Five year results of the prospective randomized controlled prostatic urethral L.I.F.T. study. Can J Urol. 2017;24(3):8802–8813.
- Persaud S, Sofat S, Lacey N, et al. Signal voids created by prostatic urethral lift implants – a reminder in the era of multiparametric MRIs of the prostate. Int J Med Rev Case Rep. 2019;3:426.