
 ?Mathematical formulae have been encoded as MathML and are displayed in this HTML version using MathJax in order to improve their display. Uncheck the box to turn MathJax off. This feature requires Javascript. Click on a formula to zoom.
Abstract
Purpose: Test objects for High Intensity Focused Ultrasound (HIFU) are required for the standardization and definition of treatment, Quality Assurance (QA), comparison of results between centers and calibration of devices. This study describes a HIFU test object which provides temperature measurement as a function of time, in a reference material compatible with Magnetic Resonance (MR) and ultrasound.
Materials and methods: T-Type fine wire thermocouples were used as sensors and 5 correction methods for viscous heating artifacts were assessed. The phantom was tested in a MR-HIFU Philips Sonalleve device over a period of 12 months, demonstrating stability and validity to evaluate the performance of the device.
Results: The study furnished useful information regarding the MR-HIFU sessions and highlighted potential limitations of the existing QA and monitoring methods. The importance of temperature monitoring along the whole acoustic path was demonstrated as MR Thermometry readings differed in the three MR plane views (coronal, sagittal, transverse), in particular when the focus was near a soft-tissue/bone interface, where there can be an MR signal loss with significant temperature and thermal dose underestimation (138% variation between the three plane views).
Conclusions: The test object was easy to use and has potential as a valid tool for training, QA, research and development for MR guided HIFU and potentially ultrasound guided devices.
Introduction
High Intensity Focused Ultrasound (HIFU) thermal ablation has been explored as a therapeutic treatment modality for many years and has gained rapid clinical acceptance due to its noninvasive nature [Citation1,Citation2]. High acoustic intensity (Ispta >1000 Wcm−2) is delivered using a focused transducer to a targeted area of a few mm3 volume, with the aim of destroying unwanted tissue (e.g., cancer) whilst avoiding damage to surrounding areas. A large fraction of the acoustic energy is absorbed by the tissue resulting in a temperature increase. The tissue temperature within the focal region rises above 56 °C within seconds, causing coagulative necrosis of targeted tissue [Citation3].
The procedure is generally performed under diagnostic ultrasound (USgHIFU) or Magnetic Resonance (MRgHIFU) real-time guidance and monitoring. Currently, the Focused Ultrasound Foundation [Citation4] estimates that there are more than 55 manufacturers of HIFU devices used for 136 different clinical indications, performed in 665 research and 585 treatment sites around the world. A number of clinical MRgHIFU and USgHIFU devices have received FDA approval and/or CE marking (ExAblate Neuro, Exablate Body System and Exablate Prostate, InSightec, Haifa, Israel; Sonalleve MR-HIFU and Tulsa Pro, Profound Medical, Mississauga, Canada; Sonablate, Sonacare Medical, North Carolina, USA; Echopulse, Theraclion, Malakoff, France; Focal One, Edap TMS, Dauphine, France; JC, JC200 and JC200D, Haifumedical, Chongqing, China) for several noninvasive thermal therapy treatments including uterine fibroids [Citation5], bone metastases [Citation6,Citation7], essential tremor [Citation8], Parkinson’s disease [Citation9], breast fibroadenoma [Citation10] and prostate cancer [Citation11].
As the use of HIFU becomes more widespread and clinically accepted, there is an increasing need to standardize how delivery of the therapy is described and reported [Citation12]. Standardization and definition of protocols are essential to promote the use of the technology, develop Quality Control and calibration guidelines, compare the results between centers, assess device performance, optimize exposure parameters, and ensure a successful treatment outcome. Research, development, and commercial availability of appropriate test objects play a key role to support all these activities.
Standards for the measurement and reporting of ultrasound fields in water (i.e., local pressures, local intensities, beam-shape) are available [Citation13–20] and methods for acoustic field characterization of clinical MRgHIFU systems have been described in the literature [Citation21]. However, there is a need to describe the ultrasound field in a medium other than water in order to quantify dose quantities (such as amount of energy deposited over the length of the treatment) and to define quantities related to treatment efficacy (clinical outcomes). No single accepted dosimetric parameter exists for HIFU treatments [Citation22]. However, where the primary mechanism of the induced biological effect is thermal, it is acceptable to describe the treatment in terms of “thermal dose” [Citation23]. Consequently, two of the most important parameters are the estimation of temperature rise related to acoustic exposure and exposure time. A HIFU test object for thermal therapy represents a device that allows accurate quantification of temperature as a function of time, in a reference material. Tissue mimicking materials based on agar, gelatin, PVA hydrogel, condensed milk, carrageenan and polyacrylamide recipes are commonly used in ultrasound and MRI imaging [Citation24,Citation25]. These materials have been combined with thermally sensitive materials such as bovine serum albumin (BSA) [Citation26], egg-white [Citation27], thermochromic inks [Citation28–31], for temperature assessment in HIFU applications. Although these may provide useful information on temperature spatial distribution and system targeting accuracy, these materials do not typically provide quantification of absolute temperatures or temperature variation as a function of time as only threshold temperatures are indicated. Fiber-optic thermometry probes have been recommended for measurements in Magnetic Resonance environments [Citation32], however these are very expensive and fragile.
Test objects offer advantages over biological tissues (human or animal) as they are stable, reproducible and well characterized. Test objects enable repeat experiments and comparative studies to be carried out without ethical issues. For these reasons, test objects and phantoms have historically played a fundamental role with wide applications for Quality Assurance, training, R&D, testing and validation of innovative medical techniques. Development of appropriate test objects is expected to play a crucial role in validating the performance of existing HIFU devices, highlighting benefits and potential issues, and offering a tool supporting corrective actions. This can have a positive impact on improving and promoting the technology, accelerating its clinical acceptance worldwide. The ideal phantom or test object should be cost-effective, portable, user-friendly, non-hazardous, MR-compatible, have well-characterized tissue-like acoustic (absorption, attenuation, speed of sound and non-linearity parameter) and thermal (thermal diffusivity, specific heat capacity and thermal conductivity) properties that remain stable over time.
In this study, a test object has been manufactured with cost-effective components and used for a period of 12 months to assess the performance of a Sonalleve MR-HIFU device (Philips/Profound Medical, Mississauga, Canada). The MRgHIFU system is CE marked for palliative treatment of bone metastases and thermal ablation of uterine fibroids. The test object embeds bone-mimic inserts within soft tissue-mimic material to test both therapeutic modalities. To the authors’ best knowledge there are no previous phantom studies comparing MRI thermometry of a clinical MRgHIFU system with thermocouple measurements. The aim of the study was to validate the phantom, assess the MRgHIFU device performance in a clinical environment, and provide training for the clinical staff, in order to underpin confidence in the performance of the technology.
Materials and methods
Phantom construction
The test object consists of a cuboid block with a base of 130 mm square and a height of 200 mm. Base dimensions are chosen to be compatible with the diameter of the HIFU transducer of the Sonalleve, while height is chosen to minimize reflection from the air interface. The structure is manufactured in PMMA (PerspexTM) and spirit levels and 8 nylon screws are placed on the phantom sides to aid positioning and alignment. Four T-type (copper-constantan) thermocouples (TC1, TC2, TC3 and TC4) are embedded at clinically relevant positions to monitor temperature rise during HIFU exposure. The thermocouples have a junction of 75 µm to minimize artifacts [Citation33–35] arising from the interaction with the 1.2 MHz HIFU beam. T-Type (copper-constantan) thermocouples were preferred to other models because they do not generate artifacts in MR imaging [Citation36]. TC1 is fixed to a 12 µm Mylar film (Goodfellow Cambridge Ltd, UK), placed at a height of 55 mm from the entry face and a distance of 10 mm from the bone. The Mylar film, widely used as an acoustic window for acoustic measurements [Citation37], minimizes reflection and absorption while providing a support for the positioning of the sensor. The bone mimic is 3 D printed in VeroWhitePlusTM with an Object500 Connex1TM 3 D printer (Stratasys Ltd, Minnesota, USA). VeroWhitePlusTM has been used in previous studies as a bone mimic material [Citation29,Citation30]. The bone mimic has a disk shape with a thickness of 2 mm, to reproduce typical flat bones affected by metastases, such as ilium, spine, and scapula. TC2 and TC3 are fixed with a tape on the two sides of the bone mimic disk, front and rear respectively with respect to the orientation of the HIFU transducer. TC4 is fixed to a plastic support at a height of 150 mm and is used as reference. The agar-based soft Tissue Mimicking Material (TMM), prepared according to Annex DD of IEC 60601-2-37, is gently poured through a removable window cut from one of the lateral PMMA surfaces of the phantom structure. 3 D printed tools and slots engraved into the phantom internal surfaces help to identify thermocouple positioning in 3 D space during MR imaging. Scaffolding (before pouring the TMM) and a CAD model of the test object are shown in , respectively. Relevant acoustic and thermal properties of tissues and materials of interest for the development of the test object are listed in .
Figure 1. (a) Scaffolding of the test object prior to filling with IEC agar-based TMM (left) and the (b) CAD model (right). Thermocouples (TC1, TC2, TC3 and TC4), positioning tools and the 3 D printed bone mimic disk are visible in the left image (a).
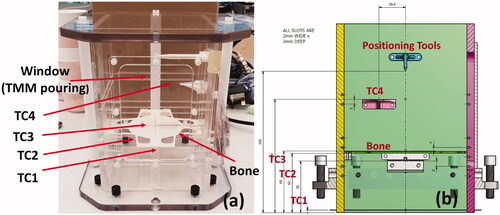
Table 1. Relevant physical properties of materials and tissues for the development of the phantom.
Experimental set-up for MR-HIFU sonication
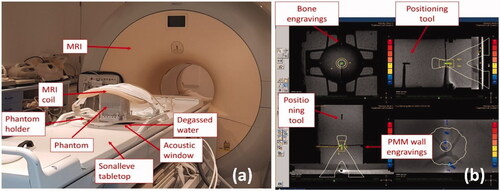
The phantom was tested using a clinical MR-HIFU Sonalleve system (Philips/Profound Medical, Mississauga, Canada). Multiple sonication were completed through four different experimental sessions over a period of 12 months. The phantom was positioned on the MR-HIFU tabletop in contact with the plastic membrane of the acoustic window, as shown in . A compatible phantom holder was manufactured to support positioning and alignment, minimizing the weight imposed on the membrane (thereby avoiding risk of damage). Degassed water was added to avoid potential air between the membrane and the acoustic window of the phantom. The receiving MRI coil was placed on top of the phantom () and the phantom was positioned at the isocentre of the scanner sliding the Sonalleve HIFU tabletop. Thermocouples were connected to an 8-channel data-logger USB TC-08 (Pico Technology, Eaton Socon, UK) through MRI compatible 5 m extender cables. The data-logger was kept in the MRI controller room. Sampling rate was set at 1 Hz, which is the fastest rate available for the data-logger and much longer than the response time of the 75 µm T-Type thermocouples (<0.1 s). The automatic Sonalleve QA protocol was run before every experimental session to verify correct functioning of the device. T1 and T2-weighted images were acquired with a Philips Achieva 3.0 MR system (Philips, Amsterdam, Netherlands) as used for treatment planning. MRI images of the phantom and treatment planning on the Sonalleve console are shown in . The TMM provides the MR signal and the T-Type thermocouples do not introduce significant artifacts in the image [Citation36]. The positioning markers (engraved slots on the internal wall and plastic positioning marker on top) helped to identify the thermocouple position in both transverse and sagittal MRI planes, while 4 arrow-shaped engravings in the bone mimic indicated the position in the coronal plane. A test sonication was run at the beginning of each experimental session to correct for potential offsets of the device, as indicated in the MR-HIFU Sonalleve instruction manual. The position of the focus was assessed before each exposure (within the resolution of the MR (1.25 × 1.75 × 2.50 mm)) to confirm correct placement.
Figure 2. Experimental set up for the MR-HIFU Sonalleve system – (a) the test object is positioned in contact with the acoustic window and degassed water is added to minimize potential air gaps. A phantom holder was specifically manufactured to be compatible with the phantom and the Sonalleve system. The holder allows phantom positioning and alignment. The MRI coil is positioned on top of the phantom for signal acquisition; – (b) positioning tools and engravings on the bone-mimicking components are visible on the MR image and help identify thermocouple positions in 3 D space. The console provides coronal (top-left), sagittal (top-right), transverse (bottom-left) and near-field views (bottom right) of the phantom. Sonication were performed with treatment cells of 4 mm diameter and powers ranging from 20 W to 60 W.
An acoustic frequency of 1.2 MHz, regular cells of 4 mm diameter and 10 mm lengths, exposure time of 16 s, and nominal power ranging from 20 W to 60 W were chosen for all sonication. The sonication were performed on the soft tissue mimicking material, on the bone mimic material, on the thermocouples and within regions distant from them (but maintaining the same distance from the transducer), in order to verify the presence of interference or loss of MR signal. A test sonication was always performed at the beginning of the experiment to identify if the heating took place at the expected location. Whenever needed, the offset of the device was corrected in Right-Left and Head-Foot directions in the coronal image and Anterior-Posterior direction in the sagittal image (as indicated in the instruction manual). MRI thermometry acquisitions, based on the proton resonance frequency (PRF) shift method [Citation40], are automatically acquired in real-time by the device.
MRI thermometry measurements
The Sonalleve MR-HIFU console provides thermal dose and temperature maps in real-time for each of the MR plane views and for the near field. It typically provides information on the coronal, sagittal and transverse MRI plane views, when it is set-up in “bone metastases” configuration, and on three coronal planes, at different depths, and the sagittal plane view, when it is set-up in “uterine fibroids.”
The temporal resolution indicated by the instruction manual is 3 s whilst the voxel size (spatial resolution) is 2.5 × 2.5 × 7 mm. The device allows numerical data from the treatment to be exported as “.csv” files at the end of the experimental session. For each sonication, exported files include information (file a, ) such as power and duration, temperature as a function of time (file b, ), magnitude and phase maps (file c, ), thermal dose maps (file d, ) and thermal maps (file 2, ) calculated for each MR plane view. A dedicated MATLAB (MathWorks, MA, USA) code has been developed to import the files and analyze the data without interfering with the clinical workflow. The results provided by the MATLAB software have been cross-validated against the Sonalleve MR-HIFU console. The files exported, for each sonication are summarized in .
Table 2. Summary of the files exported from the Sonalleve MR-HIFU console at the end of each experimental session.
Peak temperature was recorded from the temperature curves (file b, ) and from the MR plane view providing the highest temperature (file e, ). Similarly, the thermal dose was recorded from the thermal dose maps (file d, ) and calculated following [Citation23] from both the temperature curves (file b, ) and the MR plane view providing the highest temperature (file e, ).
Thermocouple measurements and treatment of the viscous heating artifact
The smallest T-Type thermocouples available commercially were used and positioned in the phantom perpendicular to the ultrasound beam axis during sonication. To date there is no universally accepted, rigorous method of quantifying the viscous heating artifact.
The following different strategies have been used to correct for the viscous heating artifact:
wait a fixed amount of time [Citation34,Citation41–44] from the onset of the sonication and then analyzing the temperature rise (“wait and measure” method);
measure temperature rise in TMMs with low and tissue-like acoustic attenuation under equivalent experimental condition (“substitution method”; [Citation45]);
identify the point in time at which the temperature rise becomes linear and the viscous heating negligible (“second differential” method; [Citation46]);
extrapolate the temperature curve by best-fitting experimental data from 2 s to 12 s after the ultrasound exposure has ceased [Citation47] and process an iterative curve-fitting on the temperature decay curve to estimate the peak temperature from extrapolating the best-fit curve.
The “wait and measure,” “second differential” and [Citation47] correction methods were applied to the thermocouple measurements described in this work. In addition, a single term (Newton’s law) and a two-term exponential fit were applied to the temperature decay curve. The first points were iteratively removed after the end of the insonation for both methods in order to extrapolate the peak temperature. Two thresholds were chosen: for the single-term fit, the points were iteratively removed until the fit provided a r2 > 0.90, while for the two-term exponential the peak was chosen when the difference in peak temperature between two consecutive iterations fell below 10%. Thermal dose was calculated, in accordance with [Citation23], from temperature curves with and without correction methods. For calculations using the various correction methods, it has been assumed that the viscous heating artifact contribution starts at the beginning of the insonation and ends when the acoustic beam is switched off, providing a constant offset.
Stability of the measurement system
A statistical analysis of the combined system (phantom + MRgHIFU system) was performed to assess whether the system was stable over the testing period (12 months − 4 sessions). The normalized error [Citation48], En, was calculated (EquationEquation (1)(1)
(1) ) to evaluate the equivalence of results,
(1)
(1)
where xi are the quantities to be compared (e.g.,
is the peak temperature in one of the sessions and
is the average of the peak temperature over the four sessions) and Vi the corresponding variations. For any measurement
is expected to agree with
to prove stability of the system over the analyzed period. For normalized errors lower than and equal one, the samples compared one to another are considered statistically equivalent and the combined system can be considered as stable over the 12 months.
Results
MR – thermometry
Multiple sonication were performed over four experimental sessions carried out on different days (within 12 months). Peak temperature reached during the treatment had been recorded from “file b” () for each sonication. The temperature is relative to a pre-set baseline of 37 °C. Average, standard deviation and variation calculated from multiple sonication, are reported in . Relative peak temperature estimated from MR thermometry thermal maps differed by 13%–138% (average 65%) when comparing coronal, sagittal and transverse plane view in the “bone metastases” configuration. Similarly, these differed by 22%–103% (average 52%) when comparing coronal and sagittal views in the “uterine fibroids” configuration. Average peak temperature increase, defined as the maximum reading among the three planes and exported as “file e” (), standard deviation and variation calculated from multiple sonication are shown in .
Table 3. Average (°C), standard deviation (°C) and variation (%) of peak relative temperature increase calculated with MR-Thermometry (proton resonance frequency shift method).
Thermocouples
Average (°C), standard deviation (°C) and variation (%) for peak temperatures recorded by the thermocouples (TC1, TC2 and TC3, ) during the 4 experimental sessions are reported in . Different correction methods were applied to compensate for viscous heating artifact. Thermocouple variability is always within 25% in soft tissue mimicking material and increases up to 46% for bone-mimic exposures.
Thermocouples vs MR thermometry – variability
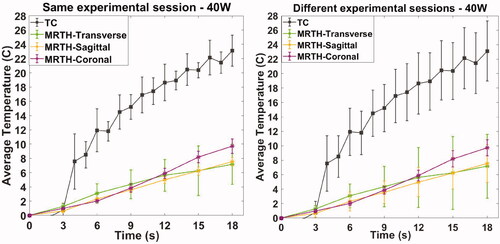
Multiple sonication were repeated, within a single experimental session. Here, we show the results for an acoustic power of 40 W, although the results are representative of other acoustic output exposures. For the thermocouple measurements, the cells were positioned repeatedly targeting the thermocouple within the soft tissue (TC1); for MR thermometry acquisitions, the cells were placed within a radius of approximately 2 cm at the same phantom depth. Average temperature curves (°C) and standard deviation (error bar calculated on at least 3 acquisitions) as a function of time recorded by thermocouples and MR thermometry on coronal, sagittal and transverse plane are shown in . Temporal resolutions are 1 s and 3 s for thermocouples and MR thermometry, respectively.
Figure 3. Temperature measurements as a function of time recorded by thermocouples and MR thermometry on the three plane views (coronal, sagittal and transverse) within the same experimental session and on different experimental sessions. Acquisitions were performed sonicating on soft-tissue mimicking material with an acoustic power of 40 W.
Thermocouples vs MR thermometry – temperature monitoring at the focal spot
The temperature curves exported at the end of the experimental session (file b, ) indicate the temperature rise as a function of the time within the treatment cell boundaries of the MR coronal plane view. However, monitoring of the temperature increase at the focal spot is not enough to guarantee confidence on the procedure. Peak temperatures of 46 °C, 60 °C and 45 °C have been recorded by the thermocouples placed on the bone surfaces (TC2 and TC3, ) when the focus was targeted at TC1 () for 20 W, 30 W and 40 W exposures, respectively. Peak temperature values recorded by thermocouples, MR temperature curves (file b, ), MR thermal maps (file 2, ) on soft tissue and bone mimic, are shown in .
Table 4. Average (°C), standard deviation (°C) and variation (%) of peak temperatures recorded by the thermocouples: TC1, thermocouple on soft tissue mimicking material; TC2, front-facing bone surface with regards to the ultrasound beam source; TC3, rear-facing bone surface with regards to the positioning of the ultrasound beam source.
Thermocouples vs MR thermometry – temperature as a function of input power
Relative peak temperature increase for exposure of the soft tissue and bone mimic materials is plotted as a function of input power (W) in ,Citation5. The plots provide a comparison between thermocouple readings, with different methods to compensate for viscous heating artifacts, and MR thermometry extracted from temperature curves (file b, ) and calculated from thermal maps (peak between coronal, sagittal and transverse MR view, file e, ). Values refer to average (°C) and standard deviation (error bars °C) of thermocouple with the different correction methods applied () and MR thermometry measurements ().
Figure 4. Exposure of soft tissue mimic material – thermocouple measurements in TMM (TC1) with and without correction for viscous heating artifacts, MR thermometry extracted from MR temperature curves (file b, ) and calculated from thermal maps (peak between coronal, sagittal and transverse MR view, file e, ). Plot refers to average (°C) and standard deviation (error bars °C) as a function of input power (W) for multiple sonication (as indicated in ).
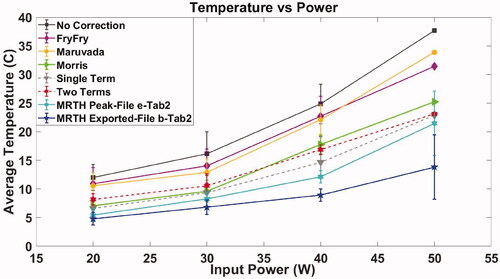
Table 5. Peak relative temperature increase (°C) on the thermocouples and MR thermometry recording when beam focus is positioned on TC1 (soft tissue mimic).
Thermocouples vs MR thermometry – thermal dose as a function of input power
Thermal dose has been calculated from thermocouples and MR thermometry temperature curves as indicated in EquationEquation (2)(2)
(2) [Citation23]:
(2)
(2)
where CEM43 °C is the cumulative number of equivalent minutes at 43 °C, ti is the i-th time interval, R is related to the temperature dependence of the rate of cell death (R = 0.25 if T ≤ 43 °C and R = 0.5 if T > 43 °C) and T is the temperature during the time interval ti.
Thermal dose, expressed as CEM43 °C on the y-axis in log scale, has been plotted as a function of input power for both soft tissue and bone mimic exposures in . As a standard reference, reported threshold [Citation3,Citation22,Citation49] for cell thermal damage of 240 CEM43 °C is indicated on the plots.
Stability of the measurement system
Assessment of any change in the acoustic properties of the phantom are difficult as measurements would require destruction of the phantom. Previous studies [Citation50] demonstrated the agar-based soft TMM (Annex DD of IEC 60601-2-37) exhibits great stability in terms of acoustic properties over 1 year.
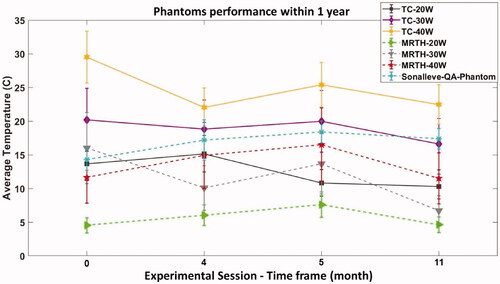
Relative peak temperature recorded at different time points, over 12 months, with thermocouples and MR thermometry is plotted in . Measurements refer to input powers of 20, 30 and 40 W, and exposures on soft tissue mimicking material. Typical variability (%), reported for each input power in , has been added to the data points. It is important to highlight that although the MR-HIFU Sonalleve system has a standard phantom that is used for QA, the acoustic power used for QA is 70 W and therefore a direct comparison is not possible. However, it gives an indication of variability. For the 4 sessions shown in , and show the normalized errors calculated for thermocouples (TC) and MR-thermometry (MR-TH) in soft tissues, respectively.
Table 6. Normalized error for temperature peak measurements in soft tissues using thermocouples.
Table 7. Normalized error for temperature peak measurements in soft tissues using MR-Thermometry.
The analysis of normalized error shown in and confirms statistical equivalence of the results with 95% confidence, for all except one value, indicating stability of the combined system throughout the 12 months period. Only one of the analysis in (Session 4) was not statically equivalent as the En is above one, possibly due to an underestimation of the uncertainty.
Discussion
A cost-effective (total manufacturing cost less than £500) test object has been developed and tested over a period of a year using a clinical MR-HIFU Sonalleve system (Philips/Profound Medical, Mississauga, Canada) and a Philips Achieva 3.0 MR system (Philips, Amsterdam, Netherlands). The system was under maintenance contract with Philips and Profound Medical for the whole duration of the study, it was regularly serviced and made available for clinical applications. This study confirmed the stability of the phantom over a prolonged period of time and demonstrated its validity to evaluate MRgHIFU performance. Clinicians and medical students are fundamental in encouraging the use of HIFU as a medical treatment. Phantoms offer them the possibility to try the machine, practice with the software and gain confidence with the technology. The phantom provides a tool for the HIFU community, to allow definition of optimal exposure parameters for effective and safe treatments.
A total of four experimental sessions, spanning 12 months, were carried out using the developed test object. No time-dependent drift in performance was observed during the assessment. Automatic Quality Control and set-up of the system was carried out in accordance with manufacturer guidance before each experimental session. Relative peak temperature increase estimated with MR thermometry differed by up to 138% (average 65%) between coronal, sagittal and transverse views in “bone metastases” configuration and up to 103% (average 52%) in “uterine fibroids” configuration [Citation51] provided technical guidance for acceptance of clinical MRgHIFU systems and indicated the coronal scan plane as the most reliable for measuring temperature evaluation. However, the coronal scan plane might not be indicated for “bone metastases” treatments because of potential loss of MR signal at the bone or bone-mimic material surface. This is demonstrated in where the temperature curves exported at the end of the experimental session (file b, ), which refers to the temperature rise within the treatment cell of the MR coronal view, indicate lower temperatures when compared to MR exported thermal maps (file e, , peak temperature between coronal, sagittal and transverse view) and the thermocouples. Moreover, in the specific case of 138% temperature difference, the sonication was performed at 40 W, 1.2 MHz for 16 s, on the bone mimic in “bone metastases” configuration. The sagittal and transverse scan planes indicated peak temperature increases of 48.7 °C and 37.8 °C, respectively, while the coronal view recorded a temperature increase of 8.8 °C. These results suggest that a better standardization of the temperature monitoring is required, to ensure the safety of the patient, the efficacy of the treatment and a more consistent comparison between patients and centers.
MR variability across multiple experiments ranged from 14% to about 45%. This might be an indication of repeatability of measurements for different sessions. However, the variability is expected to increase further when applied to patients, as MR thermometry in clinics might be severely affected by movement [Citation40] and inhomogeneous tissues. To date, a study of the uncertainty of MR thermometry under HIFU in a clinical scenario has not been performed. Thermocouple variability in soft tissue mimicking material (TC1) was always below 25% across four different experimental sessions. This demonstrates the stability of the phantom over a prolonged period and potential suitability for comparative and multicentre studies. Variability increases up to 46% when the beam is focused directly on the bone mimic and large differences may exist between TC2 and TC3. Different approaches have been explored in the literature for bone metastases, to determine whether higher temperatures are achieved focusing the beam in the pre-focal region, directly or over the bone surface [Citation6,Citation52]. A small offset of the focal position may result in large temperature difference on the bone pre- or post-focal region.
Thermal dose as CEM43 °C has been calculated [Citation23] from thermocouples and MR temperature curves, and extracted from the thermal dose maps (file d, ). Thermal dose maps provided by the Sonalleve MR-HIFU console are highly sensitive to noise and demonstrated high variability/variance ( and Citation6). As a consequence of the lower temperatures recorded, thermal dose calculated from exported temperature curves (file b, ) suggest that 45 W input power is needed to obtain thermal ablation in soft tissue, while all the other methods lie in a range between 32 W and 38 W. Similarly, temperature curves (file b, ) indicate that power inputs between 20 W and 40 W provide a CEM43 °C of 240 on bone exposure, while all the other methods suggest the thermal dose is much higher.
Figure 5. Exposure of bone mimic material – thermocouple measurements on soft tissue (TC1) with and without correction for viscous heating artifacts, MR thermometry extracted from MR temperature curves (file b, ) and calculated from thermal maps (peak between coronal, sagittal and transverse MR view, file e, ). Plot refers to average (°C) and standard deviation (error bars °C) as a function of input power (W) for multiple sonication (as indicated in ).
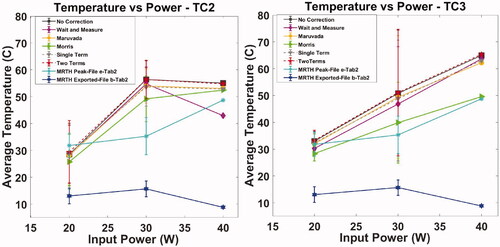
Figure 6. Exposures of soft tissue mimic material – thermal dose expressed as CEM43 °C calculated from thermocouple temperature curves with and without correction for viscous heating artifacts, MR temperature curves (file b, ), MR thermal dose maps (peak between coronal, sagittal and transverse MR view, file d, ) and MR thermal maps (peak between coronal, sagittal and transverse MR view, file e, ). The log scale on the y-axis and the marker size cover most of the uncertainty estimates (standard deviation) and for clarity these have not been plotted. Observed variabilities range from 100% to 200% (typical value ∼130%) for thermocouples and from 100% to 300% for MR (typical value ∼180%). CEM43°C = 240 has been indicated in the plot as standard reference for thermal damage.
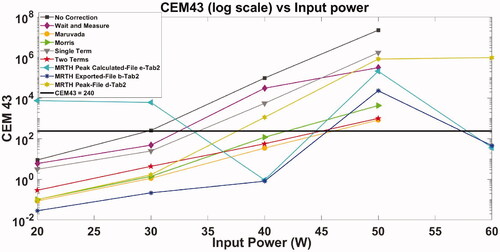
Figure 7. Exposures of bone mimic material – thermal dose expressed as CEM43 °C calculated from thermocouples temperature curves with and without correction for viscous heating artifacts, MR temperature curves (file b, ), MR thermal dose maps (peak between coronal, sagittal and transverse MR view, file d, ) and MR thermal maps (peak between coronal, sagittal and transverse MR view, file e, ). The log scale on y-axis and the marker size cover most of the uncertainty estimates (standard deviation) and for clarity these have not been plotted. Observed variabilities range from 120% to 170% (typical value ∼170%) for thermocouples and from 150% to 250% for MR (typical value ∼200%). CEM43°C = 240 has been indicated in the plot as standard reference for thermal damage.
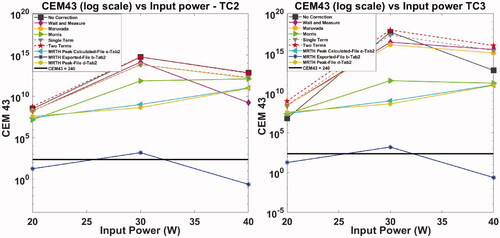
Figure 8. Relative peak temperature measured in the timeframe period with thermocouples and MR thermometry. Measurements refer to exposure on TMM with input powers ranging from 20 to 40 W. Peak temperature recorded on the dedicated Sonalleve QA phantom is also reported in the plot.
Phantom limitations include the choice of fine-wire thermocouples as sensitive elements and their positioning. Fine-wire thermocouples are widely used to measure temperature in tissue-mimicking materials exposed to ultrasound because of their fast response, good temperature resolution, low-cost and simplicity [Citation53]. However, from very early stages of their use [Citation33,Citation34] and later [Citation54] described an artifact affecting the measurements which results in an overestimation of the heat generated by absorption of acoustic energy. This phenomenon, known as the viscous heating artifact, is due to the relative motion between the thermocouple and the TMM (or tissue). Friction at the thermocouple/tissue interface induces extra heating which is detected by the thermocouple. The magnitude of the extra heating depends on acoustic frequency and thermocouple size, material, structure, and orientation [Citation33,Citation34,Citation54], as well as the properties of the material under test. Additional artifacts, such as heat conduction [Citation34] and beam reflection [Citation35] have been shown to be negligible if the size of the thermocouple junction approaches 1/20 of the beam wavelength. Thin film sensors, free from viscous heating artifact, have also been proposed but these devices have not been commercialized, probably due to the complexity of the manufacturing and calibration process [Citation38,Citation55–58]. The use of K-Type thermocouples has been explored in the early design stage of the phantom. However, this model created large artifacts in the MR image (results not shown) and have been discontinued. The smallest size (75 μm) of T-type (copper-constantan) available on the market has been chosen to minimize interactions with the ultrasound field.
Overall, the phantom proved to be easy to use and provided useful information regarding the MR guided HIFU session. It clarified that monitoring of the temperature should be performed not only in the focal region but along the whole acoustic path. A modest input power such as 20 W focused on soft tissue may provide a temperature increase of ∼8 °C within the focal spot but ∼46 °C for organs such as lung, bowel or bone, placed at 10 mm distance beyond the focus. A new version of the phantom under development will include a thermocouple positioned a significant distance away from the bone-mimic to allow sonication with higher power levels while reducing the risk of melting the tissue mimicking material and permanently damaging the phantom.
The study also suggests that MR thermometry tends to underestimate the peak temperature. Temperature curves exported at the end of the experimental sessions (file b, ) provide incomplete information and might mislead the clinician about the outcome of the exposure. Thermal maps (file d, ) provide temperatures that differ significantly among the MR plane views (coronal, sagittal and transverse) and it is difficult to establish which of the three the clinician should rely on. A comparison between MR thermometry and thermocouples is challenging due to the lack of a rigorous assessment of the uncertainty of the two measurement methods. However, the underestimation is unlikely to be completely attributed to viscous heating artifacts, as this was also observed when the beam was not directly focused on the thermocouple (). Further explanations might be linked to the lack of MR signal in proximity to the bone-mimic or spatial and temporal averaging computed by the PRF-thermometry sequence. Reported spatial resolution on the Sonalleve is 2.5 × 2.5 × 7 mm and temporal resolution 3 s. When a 4 mm (diameter) x 10 mm (length) cell is selected, such as in our experiments, the cell might be shared with up to a maximum of 9 voxels. It is understood that spatial averaging is computed, resulting in overall underestimation of the peak temperature. Improvement of both spatial and temporal resolution, and development of volumetric (3D) MRI thermometry sequences are desirable for more effective treatments.
Conclusion
A cost-effective test object compatible with MR imaging and High Intensity Focused Ultrasound has been developed and tested with a MR-HIFU Sonalleve over a prolonged period of 12 months. The system proved to be stable and provided valuable information on the performance of the MRgHIFU device. MR thermometry maps of different MRI plane views (coronal, sagittal and transverse) may differ by more than 100% suggesting that better standardization of temperature monitoring is required, to ensure safety and efficacy of the treatment. Temperature monitoring of the focal spot of the coronal view, which was exported from the device at the end of each treatment, led to significant temperature underestimation when using the bone metastases configuration, where signal loss due to the bone mimic is likely to happen. The clinical outcome is strongly related to the thermal dose delivered to the target region. An underestimation of the temperature will also lead to an underestimation of the thermal dose. Different methods for the evaluation of viscous heating artifacts showed variability in both the absolute values and the shape of the temperature/power curves. Currently, none of these corrections can be considered a reference and further investigations are required to identify the most accurate correction technique.
The phantom also highlighted the need to monitor a larger portion of the acoustic path rather than just the focal spot, to ensure that organs at risk, such as bowel or lung, or simply scar tissue, are not damaged during the treatment. The test object is suitable for training purposes, definition of QA protocols and standards, R&D and multi-centre comparison of thermal exposures.
Acknowledgments
The authors would like to acknowledge that the activities here presented were developed in the framework of the EURAMET, European Association of National Metrology Institutes, 18HLT06 RaCHy Project that received funding from the EMPIR program, European Metrology Programme for Innovation and Research (funder ID: 10.13039/100014132) co-financed by the Participating States and from the European Union’s Horizon 2020 research and innovation program.
Disclosure statement
The authors declare that they have no competing interests.
Additional information
Funding
References
- ter Haar G. Therapeutic applications of ultrasound. Prog Biophys Mol Biol. 2007;93(1–3):111–129.
- ter Haar G, Coussios C. High intensity focused ultrasound: physical principles and devices. Int J Hyperthermia. 2007;23(2):89–104.
- Yarmolenko PS, Moon EJ, Landon C, et al. Thresholds for thermal damage to normal tissues: an update. Int J Hyperthermia. 2011;27(4):320–343.
- State of the Field report. Available from: https://www.fusfoundation.org/the-foundation/foundation-reports#SOTF.
- Fennessy FM, Tempany CM. An update on magnetic resonance guided focused ultrasound surgery (MRgFUS) of uterine fibroids. Curr Radiol Rep. 2013;1(2):136–146.
- Huisman M, Lam MK, Bartels LW, et al. Feasibility of volumetric MRI-guided high intensity focused ultrasound (MR-HIFU) for painful bone metastases. J Ther Ultrasound. 2014;2(1):16.
- Huisman M, ter Haar G, Napoli A, et al. International consensus on use of focused ultrasound for painful bone metastases: current status and future directions. Int J Hyperthermia. 2015;31(3):251–259.
- Dobrakowski PP, Machowska-Majchrzak AK, Łabuz-Roszak B, et al. MR-guided focused ultrasound: a new generation treatment of Parkinson’s disease, essential tremor and neuropathic pain. Interv Neuroradiol. 2014;20(3):275–282.
- Martínez-Fernández R, Máñez-Miró JU, Rodríguez-Rojas R, et al. Randomized trial of focused ultrasound subthalamotomy for Parkinson’s disease. N Engl J Med. 2020;383(26):2501–2513.
- Brenin DR, Patrie J, Nguyen J, et al. Treatment of breast fibroadenoma with ultrasound-guided high-intensity focused ultrasound ablation: a feasibility study. J Breast Imaging. 2019;1(4):316–323.
- He Y, Tan P, He M, et al. The primary treatment of prostate cancer with high-intensity focused ultrasound. Medicine. 2020;99(41):e22610.
- Civale J, Rivens I, ter Haar G. Quality assurance for clinical high intensity focused ultrasound fields. Int J Hyperthermia. 2015;31(2):193–202.
- IEC 60601-2-37: Medical electrical equipment – Part 2-37: Particular requirements for the basic safety and essential performance of ultrasonic medical diagnostic and monitoring equipment, version 2. Geneva: International Electrotechnical Commission; 2007.
- IEC 61157: Standard means for the reporting of the acoustic output of medical diagnostic ultrasonic equipment, version 2.1. Geneva: International Electrotechnical Commission; 2013.
- IEC 61161: Standard means for the reporting of the acoustic output of medical diagnostic ultrasonic equipment, version 2.1. Geneva: International Electrotechnical Commission; 2013.
- IEC 62127-1: Ultrasonics – Hydrophones – Part 1: Measurement and characterization of medical ultrasonic fields up to 40 MHz, version 1.1. Geneva: International Electrotechnical Commission; 2013.
- IEC 62359: Ultrasonics – Field characterization – Test methods for the determination of thermal and mechanical indices related to medical diagnostic ultrasound fields, version 2. Geneva: International Electrotechnical Commission; 2010.
- IEC 62555: Ultrasonics – Power measurement – Output power measurement for high intensity therapeutic ultrasound (HITU) transducers and systems, version 1. Geneva: International Electrotechnical Commission; 2013.
- IEC 62556: Ultrasonics – Field characterization – Specification and measurement of field parameters for high intensity therapeutic ultrasound (HITU) transducers and systems, version 1. Geneva: International Electrotechnical Commission; 2014.
- IEC 60601-2-62: Medical electrical equipment – Part 2–62: Particular requirements for the basic safety and essential performance of high intensity therapeutic ultrasound (HITU) equipment, version 1. Geneva: International Electrotechnical Commission; 2013.
- Kothapalli SVVN, Altman MB, Partanen A, et al. Acoustic field characterization of a clinical magnetic resonance-guided high-intensity focused ultrasound system inside the magnet bore. Med Phys. 2017;44(9):4890–4899.
- ter Haar G. Safety first: progress in calibrating high-intensity focused ultrasound treatments. Imaging Med. 2013;5(6):567–575.
- Sapareto SA, Dewey WC. Thermal dose determination in cancer therapy. Int J Radiat Oncol Biol Phys. 1984;10(6):787–800.
- Culjat MO, Goldenberg D, Tewari P, et al. A review of tissue substitutes for ultrasound imaging. Ultrasound Med Biol. 2010;36(6):861–873.
- McGarry CK, Grattan LJ, Ivory AM, et al. Tissue mimicking materials for imaging and therapy phantoms: a review. Physics in Medicine & Biology. 2020;65:23TR01.
- McDonald M, Lochhead S, Chopra R, et al. Multi-modality tissue-mimicking phantom for thermal therapy. Phys Med Biol. 2004;49(13):2767–2778.
- Takegami K, Kaneko Y, Watanabe T, et al. Polyacrylamide gel containing egg white as new model for irradiation experiments using focused ultrasound. Ultrasound Med Biol. 2004;30(10):1419–1422.
- Ambrogio S, Baêsso R, de M, et al. A polyvinyl alcohol-based thermochromic material for ultrasound therapy phantoms. Ultrasound Med Biol. 2020;46(11):3135–3144.
- Eranki A, Mikhail AS, Negussie AH, et al. Tissue-mimicking thermochromic phantom for characterization of HIFU devices and applications. Int J Hyperth. 2019;36(1):517–528.
- Zhang W, Trivedi H, Adams M, et al. Anatomic thermochromic tissue-mimicking phantom of the lumbar spine for pre-clinical evaluation of MR-guided focused ultrasound (MRgFUS) ablation of the facet joint. Int J Hyperth. 2021;38(1):130–135.
- Zhou Y, Zhao L, Zhong X, et al. A thermochromic tissue-mimicking phantom model for verification of ablation plans in thermal ablation. Ann Transl Med. 2021;9(4):354–354.
- ASTM F2182-11. Standard test method for measurement of radio frequency induced heating near passive implants during magnetic resonance imaging. West Conshohocken (PA): ASTM International; 2011.
- Fry WJ, Fry RB. Determination of absolute sound levels and acoustic absorption coefficients by thermocouple probes—experiment. J Acoust Soc Am. 1954;26(3):311–317.
- Fry WJ, Fry RB. Determination of absolute sound levels and acoustic absorption coefficients by thermocouple probes—theory. J Acoust Soc Am. 1954b;26(3):294–310.
- Clarke RL, ter Haar GR. Temperature rise recorded during lesion formation by high-intensity focused ultrasound. Ultrasound Med Biol. 1997;23(2):299–306.
- Damianou C, Ioannides K, Hadjisavvas V, et al. MRI monitoring of lesions created at temperature below the boiling point and of lesions created above the boiling point using high intensity focused ultrasound. JBiSE. 2010;03(08):763–775.
- Rajagopal S, Sadhoo N, Zeqiri B. Reference characterisation of sound speed and attenuation of the IEC agar-based tissue-mimicking material up to a frequency of 60 MHz. Ultrasound Med Biol. 2015;41(1):317–333.
- Bacon DR, Shaw A. Experimental validation of predicted temperature rises in tissue-mimicking materials. Phys Med Biol. 1993;38(11):1647–1659.
- Hasgall PA, Di Gennaro F, Baumgartner C, et al. 2018. “IT’IS Database for thermal and electromagnetic parameters of biological tissues,” Version 4.0, May 15, 2018,
- Rieke V, Butts Pauly K. MR thermometry. J Magn Reson Imaging. 2008;27(2):376–390.
- Dunn F. Temperature and amplitude dependence of acoustic absorption in tissue. J Acoust Soc Am. 1962;34(5):746–746.
- Goss SA, Frizzell LA, Dunn F. Ultrasonic absorption and attenuation in mammalian tissues. Ultrasound Med Biol. 1979;5(2):181–186.
- Hynynen K, Martin CJ, Watmough DJ, et al. Errors in temperature measurement by thermocouple probes during ultrasound induced hyperthermia. Br J Radiol. 1983;56(672):969–970.
- Parker KJ. The thermal pulse decay technique for measuring ultrasonic absorption coefficients. J Acoust Soc Am. 1983;74(5):1356–1361.
- Huang J, Holt RG, Cleveland RO, et al. Experimental validation of a tractable numerical model for focused ultrasound heating in flow-through tissue phantoms. J Acoust Soc Am. 2004;116(4 Pt 1):2451–2458.
- Morris H. Temperature Measurement in ex-vivo Bovine Liver using Fine-Wire and Thin-Film Thermocouples. AIP Conference Proceedings; 2006.
- Maruvada S, Liu Y, Pritchard WF, et al. Comparative study of temperature measurements in ex vivo swine muscle and a tissue-mimicking material during high intensity focused ultrasound exposures. Phys Med Biol. 2012;57(1):1–19.
- Steele AG, Douglas RJ. Extending En for measurement science. Metrologia. 2006;43(4):S235–S243.
- van Rhoon GC, Samaras T, Yarmolenko PS, et al. CEM43 °C thermal dose thresholds: a potential guide for magnetic resonance radiofrequency exposure levels? Eur Radiol. 2013;23(8):2215–2227.
- Montiel A, Browne JE, Pye SD, et al. Broadband acoustic measurement of an agar-based tissue-mimicking-material: a longitudinal study. Ultrasound Med Biol. 2017;43(7):1494–1505.
- Gorny KR, Hangiandreou NJ, Hesley GK, et al. MR guided focused ultrasound: technical acceptance measures for a clinical system. Phys Med Biol. 2006;51(12):3155–3173.
- Kopelman D, Inbar Y, Hanannel A, et al. Magnetic resonance-guided focused ultrasound surgery (MRgFUS): ablation of liver tissue in a porcine model. Eur J Radiol. 2006;59(2):157–162.
- Issaoui M, Miloro P, Balandraud X, et al. Temperature elevation in an instrumented phantom insonated by B-Mode imaging, pulse doppler and shear wave elastography. Ultrasound Med Biol. 2020;46(12):3317–3326.
- Hynynen K, Edwards DK. Temperature measurements during ultrasound hyperthermia. Med Phys. 1989;16(4):618–626.
- Shaw A, Pay NM, Preston RC, et al. Proposed standard thermal test object for medical ultrasound. Ultrasound Med Biol. 1999;25(1):121–132.
- IEC TS 62306:2006: Ultrasonics – Field characterisation – Test objects for determining temperature elevation in diagnostic ultrasound fields, version 1. Geneva: International Electrotechnical Commission, 2006.
- Sim JK, Hyun J, Doh I, et al. Thin-film resistance temperature detector array for the measurement of temperature distribution inside a phantom. Metrologia. 2018;55(1):L5–L11.
- Xu B, Tang G, He C, et al. Flexible temperature microsensor for application of high-intensity focused ultrasound. Sensors and Materials. 2017;29(12):1713–1722.
- ICRU Reports. Reports of the International Commission on Radiation Units and Measurements, os-29(2); 1998. p. 129–132.