
 ?Mathematical formulae have been encoded as MathML and are displayed in this HTML version using MathJax in order to improve their display. Uncheck the box to turn MathJax off. This feature requires Javascript. Click on a formula to zoom.
Abstract
Purpose
The cardiovascular (CV) system plays a vital role in thermoregulation because of its influence on heat transfer via forced convection and conduction by changes in blood distribution, blood velocity, and proximity of vessels to surrounding tissues. To fully understand the cardiovascular system’s role in thermoregulation, blood distribution (influenced by cardiac output, vessel size, blood flow, and pressure) must be quantified, ideally across sex and age. Additionally, wall shear stress is quantified because it is an important metric in cardiovascular disease localization and progression. By investigating the effect of thermal conditions on wall shear stress at a healthy baseline, researchers can begin to study the confluence of thermal condition with pathology or exercise. The purpose of this study is to determine the influence of sex and age on the CV response to temperature. In this work, the effect of core body temperature on hemodynamics of the murine arterial and venous systems has been studied non-invasively, at multiple locations across age and sex.
Methods
Male and female, adult and aged, mice (n = 20) were anesthetized and underwent MRI at 7 T. Data were acquired from four co-localized vessel pairs (the neck [carotid/jugular], torso [suprarenal and infrarenal aorta/inferior vena cava (IVC)], periphery [femoral artery/vein]) at core temperatures of 35, 36, 37, and 38 °C. Sixteen CINE, ECG-gated, phase contrast frames with one-directional velocity encoding (through plane) were acquired perpendicular to each vessel. Each frame was analyzed to quantify blood velocity and volumetric flow using a semi-automated in-house MATLAB script. Wall shear stress (WSS) was calculated using the Hagen-Poiseulle formula. A multivariable regression for WSS in the femoral artery was fitted with temperature, sex, age, body weight, and heart rate as variables.
Results
Blood velocity and volumetric flow were quantified in eight vessels at four core body temperatures. Flow in the infrarenal IVC linearly increased with temperature for all groups (p = .002; adjusted means of slopes: male vs. female, 0.37 and 0.28 cm/(s × °C); adult vs. aged, 0.22 and 0.43 cm/(s × °C)). Comparing average volumetric flow response to temperature, groups differed for the suprarenal aorta (adult < aged, p < .05), femoral artery (adult < aged, p < .05), and femoral vein (adult male < aged male, p < .001). The two-way interaction terms of temperature and body weight and temperature and sex had the largest effect on wall shear stress.
Conclusions
Age, in particular, had a significant impact on hemodynamic response as measured by volumetric flow (e.g., aged males > adult males) and WSS at peak-systole (e.g., aged males < adult males). The hemodynamic data can provide physiologically-relevant parameters, including sex and age difference, to computational fluid dynamics models and provide baseline data for the healthy murine vasculature to use as a benchmark for investigations of a variety of physiological (thermal stress) and pathophysiological conditions of the cardiovascular system.
Introduction
Core temperature impacts human performance and health. Humans maintain core temperature via the process of thermoregulation [Citation1–5]. Thermoregulation is affected by changes in: convective heat transfer from skin to environment, autonomic nervous system and metabolic processes, and cardiovascular (CV) system. The CV system influences heat transfer via forced convection and conduction by changes in blood distribution (conduction and convection), proximity of vessels/tissues (conduction), and blood velocity (convection) [Citation6]. Cardiac output, vessel size, blood flow velocity, and pressure all influence these parameters. In addition, sex and age influence the body’s ability to perceive and respond to changes in temperature [Citation5,Citation7–10] and affect the function of the CV system [Citation11–13]. Therefore, the effect of body temperature on each parameter must be quantified, ideally across age and sex, to fully understand the CV system’s role in thermoregulation.
Previous work has shown that increasing core temperature resulted in: either increases or decreases in cerebral blood flow depending on the temperature range [Citation14–16], increased cardiac output [Citation17,Citation18], and decreased total peripheral resistance [Citation17,Citation19]. Absent from this work was empirical data regarding blood flow changes in core vessels, which are necessary for improved parameterization and validation of mathematical and computational models [Citation20,Citation21]. Although literature suggests that with a decrease in temperature, the blood flow in the core veins in the torso will increase [Citation22] due to the shunting of blood away from the periphery and subcutaneous vessels to minimize heat exchanged with the environment [Citation22–24], recent work has illustrated an increase in the cross-sectional area of arteries and veins in mice, from head-to-toe, due to increases in core temperature [Citation25,Citation26]. These geometric results imply flow at these locations would decrease with a decrease in temperature if velocity remained constant. However, data regarding velocity, and hence volumetric flow in the core (alternatively, deep) arteries and veins are necessary to confirm these initial geometric findings.
Using healthy C57BL/6 mice [Citation27] and MRI, we noninvasively quantified blood velocity and calculated volumetric flow and wall shear stress (WSS) changes in artery-vein pairs in the neck (carotid/jugular), torso (suprarenal and infrarenal aorta/inferior vena cava (IVC)), and periphery (femoral artery/vein) at four target core temperatures. We hypothesized that: blood flow would increase as core temperature increased from minimally hypothermic at 35 °C to minimally hyperthermic at 38 °C; the magnitude of blood flow increase would vary based on anatomical location; and, aged males would have a diminished response [Citation25]. These data are the first to empirically quantify the spatially and temporally resolved blood velocity and flow response of artery-vein pairs of core vasculature to changes in core temperature in vivo from head-to-toe.
Methods
All experiments were carried out with local Institutional Animal Care and Use Committee approval. Animals were housed in a room with temperature (22 ± 2 °C) and humidity (∼27%) control and an alternate 12 h light/dark cycle. Data acquired at 37 °C were analyzed first and presented in a previous study, the main findings of which focused on methods’ development and comparisons under normothermic conditions [Citation28]. That work was necessary because phase contrast MRI has not been implemented prolifically in murine models; and, blood flow velocity and volume have rarely been quantified and compared across locations within the same animal, for both sexes and two ages, within the same experiment (even under normal conditions). The main findings of the work presented here related to the location-, age-, and sex-dependent physiological response to changes in core temperature, have not been presented elsewhere.
Methods for imaging are briefly repeated here. Healthy adult (12- to 14-weeks-old, ∼20–25 human years) and aged (54- to 58-weeks-old, ∼50 human years [Citation29]), male and female, C57BL/6 mice, purchased from Charles Rivers Laboratory, were used (n = 5 each, total = 20). Average body weights increased with age (adult: 21.9 ± 0.6 vs. aged: 32.4 ± 0.9 g, p < .0001) and were greater in males compared to females (male: 29.8 ± 1.4 vs. female: 24.5 ± 1.1 g, p < .001). Mice were anesthetized with 1.25–2% isoflurane in 1 L/min of oxygen [Citation30]. Animals were imaged in the supine position at 7 T using a Direct Drive console (Agilent Technologies, Santa Clara, CA) and a 40 mm inner diameter transmit-receive volume coil (Morris Instruments, Ontario, Canada).
The four target core temperatures, selected to avoid pathological changes [Citation31,Citation32], ranged from minimally hypothermic (35 °C) to minimally hyperthermic (38 °C) within ± 0.2 °C. The forced convection system included a heater blowing warm air through the bore of the magnet and over the animal, a rectal temperature probe, and a custom-built proportional-integral-derivative (PID) controller (Labview, National Instruments, Austin TX). Heart rate and respiration were monitored (SA Instruments, Stony Brook, NY).
illustrates the locations investigated in this study [Citation25,Citation26]. CINE phase contrast data were acquired in the neck (carotid artery and jugular vein), torso (suprarenal/infrarenal aorta and IVC), and periphery (femoral artery and vein). To acquire all four locations for a given animal, with four target core temperatures tested at each location, two imaging sessions were required (approximately two hours each). One session included the neck and suprarenal vessels, while the other session included the infrarenal and femoral locations. Each imaging session was approximately two hours (∼30 min to reach each target core temperature and acquire arterial and venous data). To minimize time under anesthesia, temperature was increased from 35 to 38 °C (due to the extended time needed to decrease core temperature because the forced convection system does not currently incorporate a cooling mechanism). We previously verified that changes observed in heart rate [Citation26] and volumetric flow [Citation28] were not due to long exposures to anesthesia.
Figure 1. Coronal maximum intensity projection (MIP) [Citation25] illustrating arterial and venous locations where imaging data were acquired and quantified.
![Figure 1. Coronal maximum intensity projection (MIP) [Citation25] illustrating arterial and venous locations where imaging data were acquired and quantified.](/cms/asset/02e5dd9d-9413-49db-9ad8-985c8134a50f/ihyt_a_2018510_f0001_b.jpg)
MRI slice planning and parameters
Sixteen cardiac-gated 2D CINE, phase contrast frames with one-directional velocity encoding (through plane) were acquired perpendicular to each vessel with MR parameters reported in full elsewhere [Citation28]. Briefly, parameters for arteries were [TR/TE ∼180/5 ms depending on heart rate, flip angle (α) 60°, FOV (20 mm)2, matrix 1282 zero-filled to 2562, in-plane resolution (78 µm)2, slice thickness 1 mm, NEX 2]. Parameters for veins were [TR/TE ∼180/5 ms depending on heart rate, α 20°, FOV (25.6 mm)2, matrix 1282 zero-filled to 2562, in-plane resolution (100 µm)2, slice thickness 1 mm, NEX 2]. Methods development and parameter optimization are more thoroughly discussed in the normothermia paper [Citation28].
MRI analysis: Cross-sectional area, velocity, volumetric flow
The CINE images were analyzed for vessel cross-sectional area to calculate volumetric flow, mean systolic or diastolic velocity (velocity averaged within the individual systolic or diastolic CINE frame), average velocity across the cardiac cycle (the mean velocity, averaged across all 16 CINE frames), and average volumetric flow (the mean volumetric flow, averaged across all 16 CINE frames) using an in-house semi-automated MATLAB code [Citation28]. Volumetric flow of the entire vessel was calculated by EquationEquation (1)(1)
(1) :
(1)
(1)
Wall shear stress calculations
Wall shear stress (WSS) was calculated in the arteries using the Hagen-Poiseuille formula (EquationEquation 2(2)
(2) ) with the assumptions that there is laminar flow, blood is a Newtonian fluid, and flow is in a rigid wall cylindrical tube.
(2)
(2)
where μ is the dynamic viscosity (0.04 g·cm−1·s−1), u̅ is the mean velocity, and d is the inner diameter of the vessel.
Statistical analysis
Data are plotted as mean ± standard error (SEM). Velocity and volumetric flow were positive for the inferior to superior direction (i.e., for carotid, IVC, femoral vein) and negative for flow in the superior to inferior direction (i.e., for jugular, aorta, and femoral artery). To simplify presentation and interpretation, all results are reported and statistically evaluated as the absolute value to be able to compare locations. All data were tested for normality using Shapiro-Wilk test with alpha set to 0.05. To test whether temperature had an effect on a given metric within a group of animals, repeated measures one-way ANOVA and Tukey’s post hoc test to account for multiple comparisons was used, with temperature treated as categorical.
Two methods were used to evaluate differences between groups for velocity and volumetric flow. First, to compare relative changes within a given one degree temperature interval (i.e., 35–36, 36–37, or 37–38 °C), the percent change per one degree increase in temperature (%/°C) was calculated for velocity and volumetric flow to account for potential differences due to size between groups [Citation25]. Using the %/°C values, the effects of sex and age were assessed via two-way ANOVA and Tukey’s post hoc test. Secondly, to compare absolute changes over the four degree temperature interval, linear regression was applied to average velocity and average volumetric flow. For example for average velocity, regression resulted in a fitted line with units of cm/(s × °C). Slopes were assessed for linearity (R2) and tested for being non-zero and different between groups. For average WSS in the femoral artery, multivariable linear regression was applied with temperature, sex, age, body weight, and heart rate as variables. Akaike's information criterion (AIC) was used to select which regression fit the data best: comparison of main effect, two-way and/or three-way interactions. Significance was set at p < .05. Data were analyzed using GraphPad Prism version 7.0 (GraphPad Software, La Jolla, CA).
Results
Heart rate linearly increased with temperature for all groups (adult males: 19.2 ± 2.4 bpm/°C, adult females: 26.9 ± 5.0 bpm/°C, aged males: 10.4 ± 0.6 bpm/°C, and aged females: 26.2 ± 2.0 bpm/°C; R2: 0.93–0.99, p: .003–.02).
Volumetric flow response to temperature was larger in aged animals
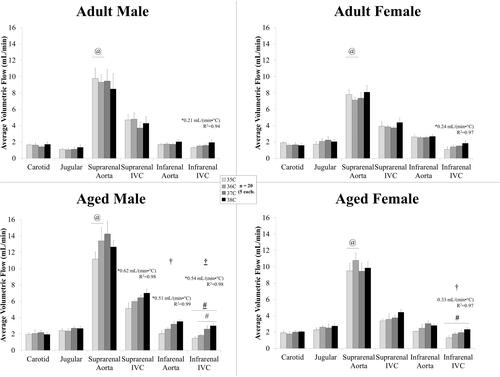
shows the volumetric flow averaged across the cardiac cycle in the neck and torso vessels for male and female, adult and aged mice. Temperature had an influence on average volumetric flow for the infrarenal aorta (aged males) and for the infrarenal IVC (aged males and aged females) with statistically significant differences between means for the infrarenal IVC: aged males, 35/38 °C and 36/38 °C; aged females, 35/38. For aged males, flow in the suprarenal IVC and infrarenal aorta (slopes >0, p < .007, R2 = 0.98–0.99) linearly increased with temperature. Flow in the infrarenal IVC linearly increased with temperature for all groups (slopes >0, p < .02, R2 = 0.94–0.98) with slopes differing between groups (p = .002; adjusted means: male vs. female, 0.37 and 0.28 cm/(s × °C); adult vs. aged, 0.22 and 0.43 cm/(s × °C)). When comparing relative response for volumetric flow, sex and age had an influence on response at the suprarenal aorta (p = .005) with statistically significant differences between adult and aged animals at 35–36 °C interval (adult male: −1.2%/°C vs. aged male: 20.5%/°C, p = .04; adult female: −7.5%/°C vs. aged female: 15.1%/°C, p = .02).
Figure 2. Volumetric flow averaged across the cardiac cycle (mean ± SEM) in the neck and torso vessels of male and female, adult and aged mice (n = 5 each) at core temperatures of 35, 36, 37, and 38 °C. Response varied by location and across sex and age. Significance set at p < .05 for: temperature effect overall (†); pairwise comparisons between temperatures within a group(#); relative changes between same age group but opposite sex ($) and same sex but different age group (@), non-zero slope (*). Bold and underlined denotes p < .01.
shows the volumetric flow averaged across the cardiac cycle in the peripheral vessels for male and female, adult and aged mice. Temperature had an influence on average volumetric flow for the femoral artery for all groups (p < .04). There were statistically significant differences between means within a group for: adult females, 35/36 °C, 35/37 °C, 35/38 °C, and 36/38 °C; aged males, 35/36 °C, 35/37 °C, 35/38 °C, 36/37 °C, and 36/38 °C; and aged females, 35/37 °C, 35/38 °C, and 36/37 °C.
Figure 3. Volumetric flow averaged across the cardiac cycle (mean ± SEM) in the peripheral vessels for male and female, adult and aged mice (n = 5 each) at core temperatures of 35, 36, 37, and 38 °C. Response varied by location and across sex and age. Significance set at p < .05 for: temperature effect overall (†); pairwise comparisons between temperatures within a group (#); relative changes between same age group but opposite sex ($) and same sex but different age group (@), non-zero slope (*). Bold and underlined denotes p < .01.
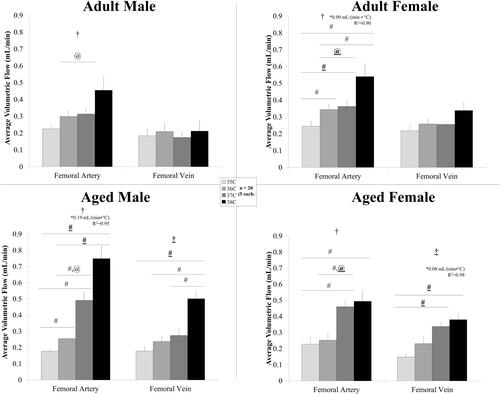
Temperature had an influence on average volumetric flow for the femoral vein only for aged animals with statistically significant differences between means within a group for: aged males, 35/38 °C, 36/38 °C, and 37/38 °C; and aged females, 35/37 °C and 35/38 °C. Flow in the femoral artery linearly increased with temperature for adult females and aged males (slopes >0, p < .05, R2 = 0.90–0.95). Flow in the femoral vein linearly increased with temperature for aged females (slope >0, p = .01, R2 = 0.98). Comparing volumetric flow response to temperature, sex and age had an influence on relative response at the femoral artery (p = .001) and femoral vein (p = .048) with statistically significant differences between adult and aged animals at 36–37 °C interval for the femoral artery (adult male: 5.7%/°C vs aged male: 92%/°C; adult female: 6.6%/°C vs. aged female: 106%/°C).
Effect of temperature was dependent on location, sex, and age; with mean velocity of the femoral artery increasing with temperature
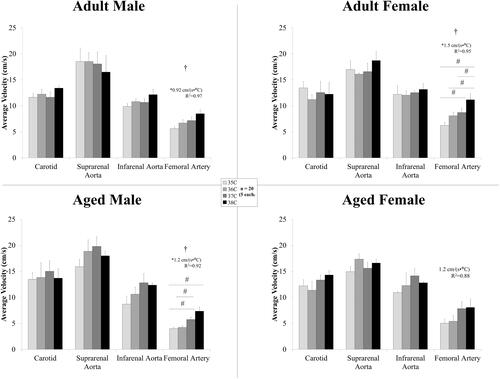
shows the average velocity across the cardiac cycle at the four arterial locations from adult and aged, male and female mice. Temperature had an influence on the average velocity in the femoral artery for the adult animals and aged males (, p < .03) with statistically significant differences between means for: adult females, 35/37 °C, 35/38 °C, 36/38 °C, and 37/38 °C; aged males, 35/37 °C, 35/38 °C, and 36/37 °C. In the femoral artery, average velocity linearly increased with temperature for adult animals and aged males (slopes > 0, p = .01–.03, R2 = 0.92–0.97); however the slopes were not different between groups (p > .05; adjusted slope 1.2 cm/(s × °C)).
Figure 4. Average velocity across the cardiac cycle (mean ± SEM) in the arteries for male and female, adult and aged mice (n = 5 each) at core temperatures of 35, 36, 37, and 38 °C. Response varied by location and across sex and age. Significance set at p < .05 for: temperature effect overall (†); pairwise comparisons between temperatures within a group (#); relative changes between same age group but opposite sex ($) and same sex but different age group (@), non-zero slope (*). Bold and underlined denotes p < .01.
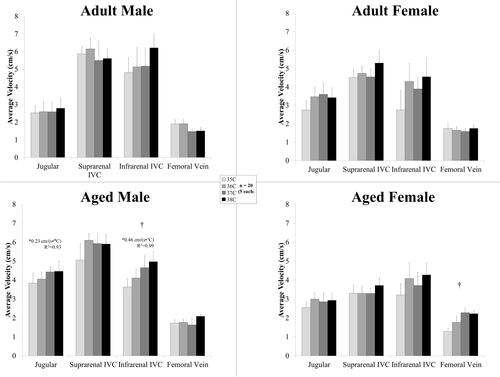
shows the average velocity across the cardiac cycle at the four venous locations from adult and aged, male and female mice. Temperature had an influence on the average velocity for the infrarenal IVC for aged males (p = .03) and for the femoral vein for aged females (p = .04). In the jugular and infrarenal IVC, average velocity linearly increased with temperature for the aged males (slope >0, p < .04, R2 = 0.92–0.99).
Figure 5. Average velocity across the cardiac cycle (mean ± SEM) in the veins for male and female, adult and aged mice (n = 5 each) at core temperatures of 35, 36, 37, 38 °C. Response varied by location and across sex and age. Significance set at p < .05 for: temperature effect overall (†); pairwise comparisons between temperatures within a group (#); relative changes between same age group but opposite sex ($) and same sex but different age group (@), non-zero slope (*). Bold and underlined denotes p < .01.
A summary of the mean velocity at peak systole and end diastole for all animal groups at every location is presented in . If there were no statistical differences between temperatures, the values are averaged across the four temperatures.
Table 1. A summary of the mean velocity (cm/s) at peak systole and end diastole for all animal groups at every location. Data presented as mean ± standard error (SEM).
For mean systolic velocities, temperature had an influence at the carotid, suprarenal and infrarenal aorta for aged females (, p < .05) with statistically significant differences between means for: suprarenal aorta, 35/36 °C (p = .04) and 35/38 °C (p = .03); infrarenal aorta, 35/38 °C (p = .03). Temperature had an influence at the infrarenal IVC for aged males (, p = .04) with statistically significant differences between means for 35/38 °C (p = .03). Supplemental Figure 1 shows the mean velocity across the lumen for each of the 16 CINE frames (i.e., plotted across the cardiac cycle) for the femoral artery for all four groups. Temperature had an influence on femoral artery mean systolic velocity for all groups ( and , p < .01) with statistically significant differences between means within a group for: adult male, 35/36 °C, 35/38 °C, and 37/38 °C; adult female, 35/36 °C, 35/37 °C, 35/38 °C, 36/38 °C, and 37/38 °C; aged males, 35/37 °C and 35/38 °C; and aged females, 36/37 °C and 36/38 °C. When comparing relative response for mean systolic velocity, sex and age had an influence on response at the suprarenal aorta (p = .03).
For mean diastolic velocities, temperature had an influence at the suprarenal aorta and femoral vein for aged females (, p < .03) with statistically significant differences between means for the suprarenal aorta, 35/37 °C (p = .04). Temperature had an influence on femoral artery mean diastolic velocity for all groups except aged females (, p < .02) with statistically significant differences between means within a group for adult females, 35/38 °C and 36/38 °C, and aged males, 36/37 °C and 36/38 °C.
Wall shear stress increased with temperature in the femoral artery
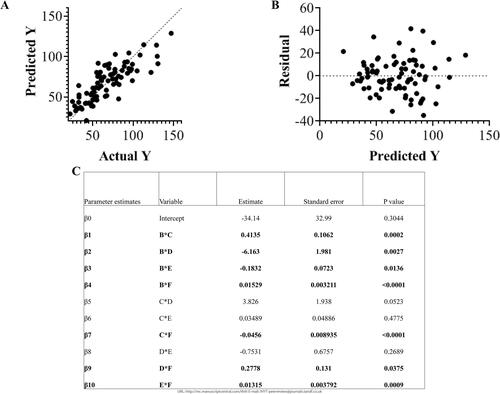
WSS is dependent on velocity and vessel area (Supplemental Figure 2). Average WSS in the arteries for each group is shown in . Temperature had an influence on average WSS for the infrarenal aorta (adult males) and for the femoral artery (adult females, p = .008; aged males, p = .006) with statistically significant differences between means for the infrarenal aorta in adult males 35/38 °C and for the femoral artery: adult females, 35/38 °C, 36/38 °C, and 37/38 °C; aged males, 36/37 °C. shows the multivariable regression analysis for WSS in the femoral artery. After comparing the AICs of the different models, the two-way interaction was the best fit (R2 = 0.68, p < .0001): Y = β0 + β1*B*C + β2*B* D + β3*B*E + β4*B*F + β5*C*D + β6*C*E + β7*C*F + β8*D*E + β9*D*F + β10*E*F with variables B: temperature, C: body weight, D: sex (1 male or 0 female), E: age (in weeks), F: heart rate. The terms of temperature and body weight (B*C) and temperature and sex (B*D) had the largest effect on wall shear stress with parameter estimates of 0.41 and −6.2, respectively.
Figure 6. For standard viscosity (0.04 dyne sec/cm2) across temperature, wall shear stress averaged across the cardiac cycle (mean ± SEM) in the arteries for male and female, adult and aged mice (n = 5 each) at core temperatures of 35, 36, 37, and 38 °C. Response varied by location and across sex and age. Significance set at p < .05 for: temperature effect overall (†); pairwise comparisons between temperatures within a group (#); and, non-zero slope (*). Bold and underlined denotes p < .01.
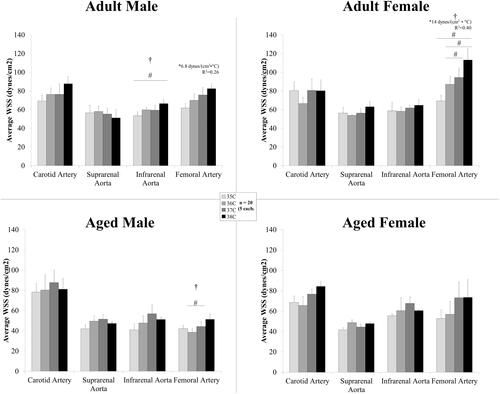
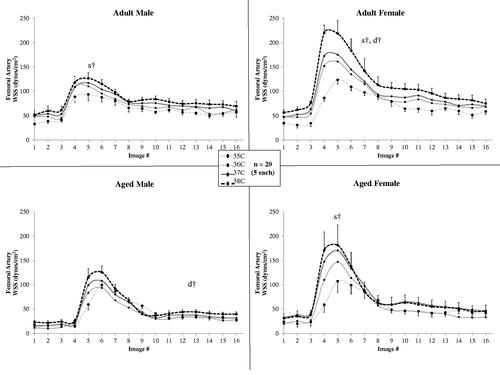
Figure 7. For standard viscosity (0.04 dyne sec/cm2) across temperature, wall shear stress plotted across the cardiac cycle in the femoral artery for male and female, adult and aged mice (n = 5 each) at core temperatures of 35, 36, 37, and 38 °C. Error bars shown only for 38 C and 35 C for clarity. Significance set at p < .05: for temperature effect overall at mean systole (s†) and mean diastole (d†).
shows the mean WSS for each of the 16 CINE frames (i.e., plotted across the cardiac cycle) for the femoral artery for all four groups. Temperature had an influence on femoral artery WSS at peak-systole for all groups except aged males (p < .04) with statistically significant differences between means within a group for: adult male, 35/36 °C (p = .04), 35/38 °C (p = .009), and 36/38 °C (p = .01); and adult female, 35/36 °C (p = .007), 35/37 °C (p = .008), 35/38 °C (p = .009), 36/37 °C (p < .05), 36/38 °C (p = .02), and 37/38 °C (p = .03). Temperature had an influence on WSS at diastole for adult females and aged males (p < .04) with statistically significant differences between means within a group for aged males at 36/37 °C (p = .04).
Figure 8. Multivariable regression analysis with two-way interactions for wall shear stress (Y) in the femoral artery (R2 = 0.68, p < .0001) with variables B: temperature, C: body weight, D: sex (1 male or 0 female), E: age (in weeks), F: heart rate: Y = β0 + β1*B*C + β2*B*D + β3*B*E + β4*B* F + β5*C*D + β6*C*E + β7*C*F + β 8*D*E + β9* D*F + β10*E*F. A. Plot of predicted Y versus Actual Y B. Plot of residuals for multivariable regression analysis model. C. Table of parameter estimates and p-values. Significance set at p < .05.
Discussion
In agreement with previous studies, adult males [Citation26], adult females and aged animals [Citation25] showed a linear increase in heart rate with increasing temperature. With an increase in heart rate and either no change or an increase in stroke volume, cardiac output increases. Temperature-induced increases in cardiac output cause an increase in volumetric flow rate in the body, and may also be necessary to maintain blood pressure subsequent to reductions in total vascular resistance resulting from cutaneous vasodilation due to increases in temperature [Citation17].
Volumetric flow tended to increase in the torso and periphery with increased core body temperature
For nearly all vessels and both age groups (excluding carotid, suprarenal aorta and IVC in adult males), velocity and volumetric flow increased from 35 °C to 38 °C suggesting that increases in cardiac output, and thus increases in volumetric flow (Q), are mediated through both area changes [Citation26] and velocity changes (Volumetric Flow = Area × Velocity). The increases in peripheral blood flow with temperature are consistent with the periphery and more superficial vessels being a site for heat exchange with the environment [Citation17,Citation19]. Previous researchers suggested that with a decrease in core body temperature, core veins, such as the infrarenal IVC, vasodilate to keep blood centrally and away from the skin and periphery where it might lose heat to the environment [Citation22,Citation23,Citation33]. In the infrarenal IVC our results illustrated the opposite [Citation26] for all animal groups. This could result from reduced cardiac output [Citation25] and aortic flow at lower temperatures.
An increase in volumetric flow as we have measured in several locations, further suggests that the hemodynamically inactive blood volume (60–70% of total blood volume [Citation34]) may decrease with increased core temperature and increased cardiac output leading to increases in bulk flow at all depths. The differences in volumetric flow at each location may be due, in part, to the ability of individual vessels to sense changes in heat and temperature (thermosensitivity [Citation11,Citation23,Citation35]).
Sex and age mediate vascular response to temperature
Aged males showed the largest response in volumetric flow due to large increases in velocity in the infrarenal IVC, femoral artery, and femoral vein. This partially contrasts with our theory which predicted that aged males had a diminished vascular response to temperature in the femoral location [Citation25]. The resolution was limited in the peripheral vessels and with the 3D acquisition were unable to plan slices perpendicular to the vessel [Citation25]. Methods were subsequently improved [Citation26,Citation28], and in this present study, we were able to plan slices perpendicular to the vessel to decrease partial-volume effects and quantify velocity as well as cross-sectional area. It remains unclear if this larger response in the cardiovascular system, as measured by velocity, reflects a diminished thermoregulatory ability of aged animals [Citation11,Citation36]. We hypothesize that if blood is shifted to the periphery, and thus superficial vessels, and the animals have a diminished ability to remove that heat due to, for example, greater fat mass [Citation29] that is not as thermally conductive [Citation37], then this could lead to diminished heat removal. An increase in fat content and thermal insulation inside the body also may explain the slightly longer imaging time for aged animals (i.e., it took longer to increase core temperature in aged animals). In agreement with our previous work. aged females had a similar response in the periphery compared to adult females [Citation25,Citation38]. Differences in sex and age at normothermia from this data set are further discussed in [Citation28].
Considerations for bioheat modeling
With changes in volume flow and/or velocity, heat transfer via convection would be hypothesized to change. Data presented here can direct where and when temperature-dependent changes in hemodynamics need to be considered when coupling computational fluid dynamics (CFD) and bioheat modeling [Citation21,Citation39,Citation40]. For example, the carotid is an anatomical location for which hemodynamic changes due temperature do not need to be incorporated. By contrast, velocity and volumetric changes would be pertinent for the infrarenal and peripheral vessels. Differences in mean systolic/diastolic () are also important considerations, not only for heat transfer, but also because of their influence on wall shear stress, a biomarker for cardiovascular health. This work provides further evidence of the effects of sex and age on CV responses, and these differences should be incorporated into mathematical and computational models.
Wall shear stress response: implications for heat adaptation and co-morbidities with cardiovascular disease
Changes in area and velocity, in response to temperature changes, not only contribute to changes in volumetric flow, but also contribute to alterations in cyclic circumferential strain of the vessel wall (area) [Citation25,Citation26] and shear stress on the luminal surface (area and velocity). In our work, we showed a 25–88% increase from 35 to 38 °C in systolic WSS with larger responses in female animals potentially due to sympathetic control in females [Citation41,Citation42]. In aged males, there was a deficit in WSS response at peak-systole further supporting the hypothesis that aged males have diminished response to thermal stress. WSS response comparisons are important to consider because alterations in WSS have been implicated in disease localization and progression in atherosclerosis [Citation43] with ∼100% increase in WSS for vascular pathology [Citation44] as well as a 75–300% increase during exercise potentially leading to exercise adaptations [Citation45]. The WSS response could contribute to cardiovascular adaptations to thermal stress, similar to exercise.
WSS at each temperature is also important because the relative difference in WSS, or directional changes between baseline and pathological states, has been shown to be a stronger determinant of flow-mediated inflammatory response compared to absolute magnitude differences between groups [Citation46]. Our average WSS model in the femoral artery could be utilized to provide this fundamental data for comparison when pathophysiology is present or there are additional cardiovascular states, such as exercise or dobutamine administration [Citation47–49]. To note, WSS in veins was calculated; however, the approximation of a circular cross-section is violated because of the non-circular nature of veins [Citation49]. Another assumption was that viscosity remained constant with temperature and across groups, and future work measuring blood viscosity at different temperatures and across sex and age would be of interest.
Analogy between exercise and temperature
The healthy mammalian cardiovascular system is sensitive and highly adaptive as evident in our quantification of not insubstantial cardiovascular changes despite relatively small changes in body temperature. For this study, core body temperature ranged from marginally hypothermic (35 °C) to marginally hyperthermic (38 °C), or ∼8.5%, and yet we see volumetric changes of the vasculature of over 30% in core vessels. For further context, we compare our results to another common cardiovascular stressor, exercise. The active homeostasis system responds differently at rest compared to during a bout of exercise. In a human study, volumetric flow rate in the aorta increased by 34% for moderate (HR increase of 40% compared to rest) and 67% for intense exercise (HR increase of 80%), and, in comparison, we quantified an increase in heart rate of 14% and an increase of 17% volume flow rate in the infrarenal aorta for adult males from 35 to 38 °C [Citation50]. For the peripheral vessels during exercise, there was an ∼1800% increase in area for the anterior tibial artery after acute mild exercise (HR increase of 17–34%), and we see a 100% increase in volumetric flow to the femoral artery from 35 to 38 °C [Citation51]. Thermoregulation has a large impact on the cardiovascular system, and we hypothesize temperature will compound the stress of exercise even using a mild temperature gradient such as in this work [Citation2,Citation52,Citation53].
Limitations
As previously discussed, the non-circular geometries and vessel curvature in the veins made image planning perpendicular to the vessel more challenging, and complex vessel curvature could introduce partial volume effect errors [Citation28]. However, slice planning, optimized in previous work with parameters for slower blood flow for anatomical landmarks, provided reproducible planning and slices were perpendicular to flow [Citation49].
For WSS calculations using Hagen-Poiseuille formula, assumptions regarding blood flow are needed. These assumptions (laminar flow, blood is Newtonian, and rigid vessel walls) are not valid for all locations or physiological conditions, and with the limited spatial resolution, the velocity profiles were not generated for the femoral locations. Despite these limitations, this equation is the standard for the field [Citation54]. Using this equation, relatively small changes in velocity and diameter escalate the changes in WSS. Future work is warranted to determine the effect of thermal stress on viscosity, vessel wall dynamics, and flow profiles.
We also must use anesthetized mice for imaging, leading to a slight reduction in cardiac output under anesthesia, but heart rates are closer to those recorded in conscious mice using isoflurane [Citation30]. For the isoflurane control in adult males, the largest volumetric flow increases were seen in the infrarenal IVC, femoral artery and vein (6.9, 7.0, and 0.9%/30 min, respectively) but were ∼2–8 times smaller than increases due to increased temperature (14.9, 35.3, and 7.2%/°C).
Conclusion and future work
Overall, the results demonstrate that there are differences in hemodynamic response to temperature across sex and age. In aged animals, flow increases were driven primarily by velocity changes suggesting a diminished ability for structural changes in area. These changes in blood velocity also cause changes in wall shear stress which is an important metric in cardiovascular disease progression and cardiovascular adaptation.
In this work, the effect of core body temperature on hemodynamics of the murine arterial and venous systems has been studied non-invasively, at multiple locations across age and sex. Age, in particular, had a significant impact on hemodynamic response as measured by volumetric flow and WSS at peak-systole. Future work incorporating pressure measurements and/or computational fluid dynamics (CFD) would be useful for examining stress-strain properties and luminal biomechanical forces such as wall shear stress along the entire vessel. Our data can provide physiologically-relevant parameters to CFD models and provide baseline data for the healthy murine vasculature to use as a benchmark for investigations of a variety of physiological and pathophysiological conditions of the cardiovascular system.
Authorship contributions
A. Colleen Crouch (ACC), Aditi Batra (AB), and Joan M Greve (JMG)
ACC and JMG conceived and designed the study; ACC and AB collected and analyzed data; ACC performed statistical analysis, interpreted the data, and wrote the paper; ACC and JMG critically revised the paper; all authors gave final approval of the paper.
Supplemental Material
Download PDF (326.2 KB)Disclosure statement
No potential conflict of interest was reported by the author(s).
Additional information
Funding
References
- van der Zee J. Heating the patient: a promising approach? Ann Oncol. 2002;13(8):1173–1184.
- Tucker R, Rauch L, Harley YR, et al. Impaired exercise performance in the heat is associated with an anticipatory reduction in skeletal muscle recruitment. Pflugers Arch – Eur J Physiol. 2004;448:422–430.
- Stewart IB, Rojek AM, Hunt AP. Heat strain during explosive ordnance disposal. Mil Med. 2011;176(8):959–963.
- Polderman KH. Application of therapeutic hypothermia in the intensive care unit: opportunities and pitfalls of a promising treatment modality-Part 2: practical aspects and side effects. Intensive Care Med. 2004;30(5):757–769.
- Centers for Disease Control and Prevention U. Hypothermia-related deaths–United States, 1999-2002 and 2005. MMWR Morb Mortal Wkly Rep. 2006;55:282–284.
- Fiala D, Havenith G. Modelling human heat transfer and temperature regulation. Stanford, CA: Springer International Publishing; 2015. p. 265–302.
- Brody GM. Hyperthermia and hypothermia in the elderly. Clin Geriatr Med. 1994;10(1):213–229.
- Collins KJ, Exton-Smith AN. Henderson award lecture: thermal homeostasis in old age. J Am Geriatr Soc. 1983;31(9):519–524. 1983
- Noe RS, Jin JO, Wolkin AF. Exposure to natural cold and heat: hypothermia and hyperthermia medicare claims, United States, 2004-2005. Am J Public Health. 2012;102(4):e11–e18.
- McDonald RB, Day C, Carlson K, et al. Effect of age and gender on thermoregulation. Am J Physiol. 1989;257(4 Pt 2):R700–4.
- Van Someren EJW. Chapter 22 – age-related changes in thermoreception and thermoregulation. Handb Biol Aging. 2011;2011:463–478.
- Chen CH, Nakayama M, Nevo E, et al. Coupled systolic-ventricular and vascular stiffening with age: implications for pressure regulation and cardiac reserve in the elderly. J Am Coll Cardiol. 1998;32(5):1221–1227.
- Minson CT, Wladkowski SL, Cardell AF, et al. Age alters the cardiovascular response to direct passive heating. J Appl Physiol. 1998;84(4):1323–1332.
- Nybo L, Møller K, Volianitis S, et al. Effects of hyperthermia on cerebral blood flow and metabolism during prolonged exercise in humans. J Appl Physiol. 2002;93(1):58–64.
- Bain AR, Nybo L, Ainslie PN. Cerebral vascular control and metabolism in heat stress. Compr Physiol. 2015;5(3):1345–1380.
- Qian S, Jiang Q, Liu K, et al. Effects of short-term environmental hyperthermia on patterns of cerebral blood flow. Physiol Behav. 2014;128:99–107.
- Crandall CG. Heat stress and baroreflex regulation of blood pressure. Med Sci Sports Exerc. 2008;40(12):2063–2070.
- Siddiqui A. Effects of vasodilation and arterial resistance on cardiac output. J Clin Exp Cardiolog. 2011;02:11.
- Kuhn LA, Turner JK. Alterations in pulmonary and peripheral vascular resistance in immersion hypothermia. Circ Res. 1959;7(3):366–374.
- Wissler EH. Pennes’ 1948 paper revisited. J Appl Physiol. 1998;85(1):35–41.
- Bhowmik A, Singh R, Repaka R, et al. Conventional and newly developed bioheat transport models in vascularized tissues: a review. J. Therm. Biol. 2013;38(3):107–125.
- Shepherd J, Vanhoutte P. Veins and their control. London-Philadelphia: W.B. Saunders Co.; 1975.
- Flavahan N, Vanhoutte P. Thermosensitivity of cutaneous and deep veins. Phlebology. 1988;3:41–45.
- Vanhoutte P. Return circulation and norepinephrine: an update. Paris; 1991.
- Crouch AC, Manders AB, Cao AA, et al. Cross-sectional area of the murine aorta linearly increases with increasing core body temperature. Int J Hyperthermia. 2018;34(7):1121–1133.
- Crouch AC, Scheven UM, Greve JM. Cross-sectional areas of deep/core veins are smaller at lower core body temperatures. Physiol Rep. 2018;6(16):e13839.
- Leon LR. The use of gene knockout mice in thermoregulation studies. J. Therm. Biol. 2005;30(4):273–288.
- Crouch ACC, Cao AAA, Scheven UMUM, et al. In vivo MRI assessment of blood flow in arteries and veins from head-to-Toe across age and sex in C57BL/6 mice. Ann Biomed Eng. 2020;48(1):329–341.
- Flurkey K, Mcurrer J, Harrison D. Mouse models in aging research. Mouse biomed Res. Amsterdam: Elsevier; 2007. p. 637–672.
- Constantinides C, Mean R, Janssen BJ. Effects of isoflurane anesthesia on the cardiovascular function of the C57BL/6 mouse. Ilar J. 2011;52(3):e21-31–e31.
- Teng D, Hornberger TA. Optimal temperature for hypothermia intervention in mouse model of skeletal muscle ischemia reperfusion injury. Cel Mol Bioeng. 2011;4(4):717–723.
- Duhan V, Joshi N, Nagarajan P, et al. Protocol for long duration whole body hyperthermia in mice. J Vis Exp. 2012;2012:e3801.
- Shepherd J, Vanhoutte P. The human cardiovascular system. Facts and concepts. New York: Raven Press; 1979.
- Greenway CV, Lautt WW. Blood volume, the venous system, preload, and cardiac output. Can J Physiol Pharmacol. 1986;64(4):383–387.
- Bligh J. The thermosensitivity of the hypothalamus and thermoregulation in mammals. Biol Rev Camb Philos Soc. 1966;41(3):317–365.
- Rooke GA, Savage MV, Brengelmann GL. Maximal skin blood flow is decreased in elderly men. J Appl Physiol. 1994;77(1):11–14.
- Stolwijk JAJ, Hardy JD. Section 9: reaction to environmental agents. Handb Physiol. Bethesda (MD): American Physiological Society; 1977.
- Drinkwater BL, Bedi JF, Loucks AB, et al. Sweating sensitivity and capacity of women in relation to age. J Appl Physiol Respir Environ Exerc Physiol. 1982;53(3):671–676.
- Coccarelli A, Boileau E, Parthimos D, et al. An advanced computational bioheat transfer model for a human body with an embedded systemic circulation. Biomech Model Mechanobiol. 2016;15(5):1173–1190.
- Shitzer A, Stroschein L. A, Vital P, et al. Numerical analysis of an extremity in a cold environment including countercurrent arterio-venous heat exchange. J. Biomech. Eng. 1997;119(2):179–186.
- Dart A, Du X-J, Kingwell BA. Gender, sex hormones and autonomic nervous control of the cardiovascular system. Cardiovasc Res. 2002;53(3):678–687.
- Huxley VH. Sex and the cardiovascular system: the intriguing tale of how women and men regulate cardiovascular function differently. Adv Physiol Educ. 2007;31(1):17–22.
- Cecchi E, Giglioli C, Valente S, et al. Role of hemodynamic shear stress in cardiovascular disease. Atherosclerosis. 2011;214(2):249–256.
- Dolan JM, Kolega J, Meng H. High wall shear stress and spatial gradients in vascular pathology: a review. Ann Biomed Eng. 2013;41(7):1411–1427.
- Taylor CA, Cheng CP, Espinosa LA, et al. In vivo quantification of blood flow and wall shear stress in the human abdominal aorta during lower limb exercise. Ann Biomed Eng. 2002;30(3):402–408.
- Suo J, Ferrara DE, Sorescu D, et al. Hemodynamic shear stresses in mouse aortas. Arterioscler Thromb Vasc Biol. 2007;27(2):346–351.
- Castle PEPE, Scheven UMUM, Crouch ACC, et al. Anatomical location, sex, and age influence murine arterial circumferential cyclic strain before and during dobutamine infusion. J Magn Reson Imaging. 2019;49(1):69–80.
- Crouch AC, Castle PE, Fitzgerald L, et al. Assessing structural and functional response of murine vasculature to acute β-adrenergic stimulation in vivo during hypothermic and hyperthermic conditions. Int J Hyperth. 2019;36(1):1136–1145.
- Palmer OR, Chiu CB, Cao A, et al. In vivo characterization of the murine venous system before and during dobutamine stimulation: implications for preclinical models of venous disease. Ann Anat. 2017;214:43–52.
- Weber TF, von Tengg-Kobligk H, Kopp-Schneider A, et al. High-resolution phase-contrast MRI of aortic and pulmonary blood flow during rest and physical exercise using a MRI compatible bicycle ergometer. Eur J Radiol. 2011;80(1):103–108.
- Meyer RA, Foley JM, Harkema SJ, et al. Magnetic resonance measurement of blood flow in peripheral vessels after acute exercise. Magn Reson Imaging. 1993;11(8):1085–1092.
- Nybo L, Secher NH, Nielsen B. Inadequate heat release from the human brain during prolonged exercise with hyperthermia. J Physiol. 2002;545(2):697–704.
- González-Alonso J. Human thermoregulation and the cardiovascular system. Exp Physiol. 2012;97(3):340–346.
- Katritsis D, Kaiktsis L, Chaniotis A, et al. Wall shear stress: theoretical considerations and methods of measurement. Prog Cardiovasc Dis. 2007;49(5):307–329.
- Gershon M. The second brain: the scientific basis of gut instinct and a groundbreaking new understanding of nervous disorders of the stomach and intestines. New York: HarperCollins; 1998.
- Carabotti M, Scirocco A, Maselli MA, et al. The gut-brain axis: interactions between enteric microbiota, central and enteric nervous systems. Ann Gastroenterol. 2015;28(2):203–209.
- Morrison TM, Choi G, Zarins CK, et al. Circumferential and longitudinal cyclic strain of the human thoracic aorta: age-related changes. J Vasc Surg. 2009;49(4):1029–1036.
- Greve JM, Williams SP, Bernstein LJ, et al. Reactive hyperemia and BOLD MRI demonstrate that VEGF inhibition, age, and atherosclerosis adversely affect functional recovery in a murine model of peripheral artery disease. J Magn Reson Imaging. 2008;28(4):996–1004.