
 ?Mathematical formulae have been encoded as MathML and are displayed in this HTML version using MathJax in order to improve their display. Uncheck the box to turn MathJax off. This feature requires Javascript. Click on a formula to zoom.
Abstract
Background
Detailed information on the temperature dependence of tissue thermophysical and mechanical properties is pivotal for the optimal implementation of mathematical models and simulation-based tools for the pre-planning of thermal ablation therapies. These models require in-depth knowledge of the temperature sensitivity of these properties and other influential terms (e.g., blood perfusion and metabolic heat) to maximize the treatment prediction outcome.
Methodology
A systematic literature review of experimental trials investigating thermophysical and mechanical properties of biological media, as well as blood perfusion and metabolic heat, as a function of temperature in hyperthermic and ablative thermal range, was conducted up to June 2021.
Results
A total of 61 articles was selected, thus enabling a comprehensive overview of the temperature dependence of thermophysical properties (i.e. thermal conductivity, specific heat, volumetric heat capacity, density, thermal diffusivity), and mechanical properties (shear, elastic, storage, loss and complex moduli, loss factor, stiffness) along with the principal measurement techniques. The reviewed studies considered different tissues, e.g., liver, fat, cartilage, brain, myocardium, muscle, bone, skin, pancreas tissues, and also some tumorous tissues.
Conclusions
The thermophysical properties of soft tissues appear rather constant until 90 °C, with slight differences ascribable to tissues characteristics and measurement methods. Conversely, the information on mechanical properties is heterogeneous because most of the articles investigated different types of properties in different biological tissues. Furthermore, most of the experiments were conducted ex vivo; only a small percentage concerned in vivo studies. Limited recent information about the temperature dependence of metabolic heat and blood perfusion was observed.
1. Introduction
The characterization of the thermophysical and mechanical behavior of biological tissues has always been playing a prominent and broad-spectrum role in the field of biomedical research. The in-depth investigation of the thermo-mechanical properties of biological structures can lead to the development and optimization of new diagnostic and therapeutic paradigms for medical applications.
The knowledge of tissue characteristics could help in predicting the outcome of therapeutic treatments or monitoring the evolution of a disease, relying on the intrinsic correlation between the properties of biological media and the physiological or pathological tissue state. For instance, Yeh et al. studied, by means of compression and relaxation cycles, a possible correlation between the elastic modulus of the liver and the degree of fibrosis in hepatic tissue determined by viral hepatitis type B or C, thus identifying a quadratic relationship between the elastic modulus and the stage of progression of the disease [Citation1]. Recent studies have also shown that various conditions or diseases, such as hydrocephalus and Alzheimer's disease, could cause a variation in the mechanical properties of the brain [Citation2–4]. Moreover, in the field of laser treatment for correction and reconstruction of cartilage, Chao et al. underlined how important it is to know the evolution of stress relaxation, to avoid the presence of residual stresses that could affect the treatment effectiveness [Citation5].
The assessment of the temperature dependence of thermophysical and mechanical properties of biological tissues has experienced a particular relevance in the biomedical scenario [Citation6,Citation7]. Indeed, the study of these properties as a function of temperature is pivotal for the optimal pre-procedural planning and execution of therapeutic approaches which entail a controlled tissue temperature variation. Mathematical models are used to plan these temperature-based therapies [Citation8,Citation9], and their developments require in-depth and detailed knowledge of the behavior of biological tissues as the temperature varies.
Over the last three decades, minimally invasive thermal procedures have been widely investigated for manifold diseases, e.g., benign and malignant neoplasms [Citation10–18], hyperplasia [Citation19], and atrial fibrillation [Citation20]. On account of the latest technological advances and improvements in diagnostic imaging, hyperthermic and ablative treatments have been under the spotlight thanks to multiple advantages over conventional techniques, i.e., shortened recovery times and reduction of tissue trauma hence decreased incidence of complications [Citation21,Citation22]. Furthermore, the possibility to find new therapeutic methods for tumor removal also applicable to non-surgical candidates (for instance, due to age-related reasons or an advanced stage of the disease) has fostered the research toward minimally invasive ablation techniques. Radiofrequency ablation (RFA) [Citation23,Citation24], microwave ablation (MWA) [Citation25], high-intensity focused ultrasound (HIFU) [Citation26] and laser ablation (LA) [Citation27,Citation28] represent the principal hyperthermic ablation techniques [Citation29]. Among these, RFA and MWA are the most commonly used approaches in the clinical setting [Citation30].
Despite the numerous advantages related to thermal therapies, there are still some margins of improvement for optimizing the techniques. The principal limitations include the risk to obtain a partial ablation of the tumor, the occurrence of relapses, and the possible overheating of the surrounding healthy tissues, leading to side effects such as severe pain and ulcers, up to excessive tissue carbonization [Citation31]. Hence, to prevent these risks, the research has focused on different strategies such as thermometry approaches to monitor and control the delivered thermal dose [Citation32–40], the application of nanomaterials to enhance the treatment selectivity [Citation41–44], and the implementation of reliable predictive mathematical and numerical models [Citation45,Citation46]. In particular, heat-transfer simulations are useful to study a priori the temperature distribution and to quantify the thermal effect of tissue involved in the treatment to effectively plan the therapy [Citation47,Citation48]. In this context, the predictive tools for thermal ablation procedures would benefit from accurate information on thermophysical and mechanical properties of biological media and other influential terms, such as blood perfusion and metabolic heat, to solve the governing equations and foresee the procedure outcome.
Considering the temperature excursion of hyperthermic and ablative treatments (i.e., 41 °C up to >100 °C [Citation49]), the analysis of temperature dependence of these properties is fundamental for attaining the most reliable simulation of the real scenario. In this context, we present a systematic literature review on the thermophysical and mechanical properties of biological tissues, blood perfusion, and metabolic heat as a function of temperature. After an insight on the effects of temperature in biological tissues and the influential role of the thermo-mechanical properties on thermal ablation applications, we review and discuss the temperature dependence of thermophysical and mechanical properties, as well as blood perfusion and metabolic heat, of different organs and tissues, along with the principal investigation methods and measurement techniques. This is to provide a comprehensive overview of these properties of biological media in relation to temperature in the hyperthermic and ablative range and worthwhile information on the current and future perspectives of this topic.
2. Relevance of temperature-dependent thermophysical and mechanical properties on thermal therapies
Regardless of the energy delivery modality, all thermal therapy approaches are characterized by a temperature variation from the physiological condition. This change entails different effects on the exposed biological media, which impact the sub-cellular, cellular, and tissue levels [Citation50,Citation51]. Incrementing the tissue temperature up to 41 °C may cause an increase in blood flow and ion diffusion across cell membranes [Citation52]. Temperature ranging from 41 °C up to 45–48 °C, i.e., in the so-called hyperthermia temperature interval, can lead to an increment in the cells’ sensitivity to injury [Citation53–55], unfolding and aggregation of proteins, inhibition of the repair of DNA damage [Citation56]. The time needed to attain an irreversible cell injury at hyperthermic temperatures is typically from 30 min up to one hour [Citation57]. At higher thermal intervals (temperatures of 48–60 °C), severe protein denaturation befalls [Citation52], and the required exposure time to attain irrecoverable thermal damage is a few seconds. Moreover, for temperatures exceeding 60 °C, coagulative necrosis occurs due to nearly instantaneous protein denaturation [Citation57]. Besides, at higher temperatures, several changes involving drying, vaporization, and carbonization (150 °C) of tissues can be observed [Citation58,Citation59].
As noted, heat transfer in biological media is affected by manifold mechanisms, especially in in vivo conditions, involving the heat generation due to the metabolism, blood perfusion, heat conduction and convection, water evaporation, and phase change [Citation31,Citation59]. In this complex phenomenon, the thermal distribution within tissue is affected by its thermophysical properties which determine its capability to conduct, convey, retain, and release thermal energy [Citation60]. One of the most recognized models to spatiotemporally describe the temperature distribution in tissues refers to the so-called bioheat equation, introduced by Pennes in 1948 and reported in (1) [Citation61]:
(1)
(1)
where ρ represents the tissue density, c is the specific heat of the tissue, i.e., the amount of heat required to increase the temperature of tissue by 1 °C per unit of mass; T is the transient temperature, t is the time, k refers to the thermal conductivity which describes the tissue capability to conduct heat, and it is related to the tissue density and specific heat by means of the thermal diffusivity α = k/(ρc) [Citation62,Citation63]; thus, α quantifies the ability of a tissue to conduct heat with respect to its capability to retain thermal energy. ωb is the mass flow rate of blood per unit volume, cb represents the specific heat of the blood, Ta is the temperature of the arterial blood, while ωbcb(Ta – T) is the blood perfusion term. qmet concerns the metabolic heat generated per volume unit of tissue and qext represents the external heat source, which is related to the thermal treatment modality.
Although the proposed equation neglects some important aspects as the possible effects of changing tissue water content upon overheating [Citation64] and simplifies the blood flow contribution to a scalar and local term [Citation59], this model underlies most of the formulations of predictive mathematical approaches, which are crucial for the optimization of heat therapies and their effectiveness [Citation48,Citation65–67]. Moreover, several modifications and improvements have been proposed toward the development of realistic and clinically usable predictive tools [Citation48,Citation68–70].
A common necessity to enhance the prediction capability and accuracy of these approaches is the proper characterization of the biophysical properties, thus the consideration of the temperature dependence of the influential terms. The strong impact of the input properties on the treatment planning model outcomes for thermal therapies has been witnessed by several investigations [Citation71–77]. For instance, Lopresto et al. implemented a simulation model of MWA, considering the temperature-dependent dielectric and thermal properties of tissue; the results showed the especially relevant influence of specific heat of tissue on the attained coagulation zone [Citation72]. Furthermore, concerning RFA, dos Santos et al. developed a probabilistic finite element approach of hepatic tissue ablation and observed that blood perfusion and thermal conductivity predominantly affected the coagulation zone dimensions [Citation73].
From an experimental point of view, the temperature influence on thermophysical properties has been assessed by several studies. In the following sections, the state-of-art on these temperature-dependent quantities (i.e., tissue thermal conductivity, specific heat, volumetric heat capacity, density, and thermal diffusivity) will be presented and discussed.
Furthermore, a section will be dedicated to the temperature dependence of metabolic heat and blood perfusion since their significant roles during ablation procedures [Citation78]. In particular, the presence of large-caliber blood vessels around the ablation zone has shown a non-negligible effect on the temperature distribution in the tissue [Citation79]. In fact, vessels with a diameter greater than 500 μm may determine a heat-sink effect thus a decrease in the effectiveness of the heat treatment [Citation80]. The convective heat dissipation role of vascularity has been investigated during RFA [Citation81,Citation82], MWA [Citation83], and LA [Citation84]. Moreover, the relevance of accounting for the temperature dependence of blood perfusion during thermal treatments has been assessed also by predictive models [Citation85–93].
The investigation of the mechanical behavior of biological media subjected to the temperature gradient is also a crucial factor for improving the efficiency of thermal procedures. In hyperthermic and ablative treatments, tissues can undergo structural and mechanical changes due to different thermally-induced processes, e.g., protein denaturation, dehydration, shrinkage, and mechanical stiffening [Citation94–97]. Hence mechanical properties may be deeply affected by the rate of temperature rise and the overall heat distribution [Citation98]. Thermally-induced deformations have been observed in both ex vivo experimental investigations [Citation95,Citation99,Citation100] and clinical trials [Citation101–103]. Several studies have shown tissue contractions and expansions during RFA [Citation101,Citation104,Citation105] and MWA [Citation97,Citation99,Citation100,Citation102,Citation103,Citation106–108], on different tissues such as liver, lung, kidney, assessing, for instance, contractions up to 70% in case of hepatic tissue [Citation95,Citation99,Citation100,Citation109]. Tissue shrinkage has also been reported after focal LA [Citation110], and variations of tissue stiffness have been documented in HIFU [Citation111]. In fact, the stiffness associated with lesions induced by thermal therapies is typically higher compared to the one of untreated tissue [Citation96,Citation112–114]. Despite the necessity to account for mechanical effects during thermal techniques, the consideration of these phenomena in predictive models is relatively recent [Citation48,Citation115,Citation116]. For instance, recent studies have proposed the thermomechanical modeling of LA [Citation71] and the coupling of thermo-electro-mechanical models for RFA and MWA [Citation117].
Mathematical frameworks have employed the thermoelastic wave equation and stress-strain equation to describe the mechanical behavior during thermal treatments [Citation71,Citation117–120]. For an isotropic, homogenous, and linear elastic material, the thermoelastic wave equation can be defined as reported in (2):
(2)
(2)
being ρ the density, t the time, u denotes the mechanical displacement vector, σij represents the stress tensor, and f is the force density vector.
By expressing the stress tensor component, defined by the stress-strain equation, modified to account also for the protein denaturation and the thermal expansion effects [Citation117,Citation119], the thermoelastic wave equation can therefore be expressed as:
(3)
(3)
where G is the shear modulus defined as
E is the Young’s modulus, ν is the Poisson’s ratio, α represents the volumetric thermal expansion, T is the temperature, β is the coefficient of volumetric protein denaturation shrinkage and ξ refers to the relative shrinkage.
Considering the complexity of the phenomenon, detailed information of the biomechanical behavior of tissue as temperature varies and the inclusion of mechanical changes in predictive models are imperative for avoiding the underestimation or overestimation of the treated tissue area [Citation117,Citation119], and for the appropriate thermal damage prediction.
In the following, the temperature sensitivity of tissue mechanical properties will be overviewed with a specific focus on the temperature dependence of the shear modulus (longitudinal and transversal), Young’s modulus, storage modulus, loss modulus, complex modulus, loss factor, and stiffness.
3. Methodology
A systematic literature review was conducted on PubMed and Scopus (up to June 2021) in order to identify relevant experimental studies investigating thermophysical and mechanical properties of biological tissues, as well as blood perfusion and metabolic heat, as a function of temperature, with a specific focus on the hyperthermic and ablative temperature range. With the aim of collecting the most pertinent articles, we identified keywords and divided them into five areas of interest: biological tissues, temperature dependence, thermophysical properties, mechanical properties, and blood perfusion and metabolic heat. The keywords chosen for each of the five areas of interest are shown in .
Table 1. Key-words for query construction, divided by areas of interest.
3.1. Organization of the material: inclusion-exclusion criteria and categorization of articles
Four authors conducted the systematic research. Letters-to-the-editor, abstracts, expert opinions, reviews, and non-English language manuscripts were not included in the systematic research. A total of 2447 articles was collected, of which 1727 were selected using the query on Scopus and 720 on PubMed. Following the elimination of duplicates (576), the remaining articles (1871) were divided up among six independent reviewers who performed a categorization by reading their title and abstract. Articles whose relevance to the present work was not clear from reading only the title and abstract were read in their entirety to determine their possible inclusion. The subdivision into the seven categories was as follows:
Category 0: articles excluded because they were not inherent to the purpose of our project. Among these, most did not characterize biological tissues, but rather analyzed the behavior of cells and/or chemical mediators or other non-biological materials, others did not analyze the temperature dependence of the properties, others still dealt with the implementation of a mathematical model.
Category 1: articles dealing with thermophysical properties
Category 2: articles dealing with mechanical properties
Category 3: articles dealing with blood perfusion and metabolic heat
Category 4: articles used as an in-depth study
Category 5: articles excluded because not in the English language
Category 6: articles excluded because we could not find their full text
In particular, the in-depth articles contained in category 4 allowed us to acquire further knowledge and details about how heat therapies are performed, and to attain background information concerning the different aspects of thermal therapies.
We, therefore, excluded a total of 1821 records, since 1780 papers were considered as non-inherent to the present work (Category 0), 27 records were not in English language (Category 5), and 14 did not possess full text availability (Category 6). Hence, 50 records were identified.
To prevent the exclusion of other relevant articles to the results of our systematic research, we also reviewed the bibliography and onward citing papers, and thus included the pertinent works (i.e., 11 records).
We then divided the attained 61 articles into four categories: three of them cover the macro-areas of interest and include 16 articles for thermophysical properties (Category 1), 12 articles for mechanical properties (Category 2), and 12 articles for blood perfusion and metabolic heat (Category 3); the fourth category includes 21 articles that we used as in-depth analysis (Category 4).
For each of the first three categories (i.e., Categories 1, 2, and 3), the papers were divided up between two independent reviewers who performed an analysis to extract the relevant information. Concerning the records of Category 4, papers were divided up among six independent reviewers in order to be analyzed.
The data concerning the thermophysical properties, mechanical properties, and blood perfusion as a function of temperature were obtained from the literature papers; when not directly reported in the manuscript text or tables, the data were extracted from the graphics displayed in the papers ().
Figure 1. Flow chart of the present systematic literature search.
4. Techniques for the measurement of thermal and mechanical properties
In the following sections, various experimental techniques for the evaluation of thermal and mechanical properties of biological tissues as a function of temperature will be presented along with the underlying basic working principles. Concerning the thermal properties, the dual-needle technique, the self-heated thermistor method, and differential scanning calorimetry analysis will be described; as far as regards mechanical properties a focus will be dedicated to rheology, dynamic mechanical analysis, and shear wave elastography.
4.1. Thermal properties measurement techniques
4.1.1. Dual-needle technique
The dual-needle technique is an experimental measurement method that allows for the quantification of thermal conductivity, thermal diffusivity, and volumetric heat capacity of biological tissues as temperature changes (). A typical experimental setup may include a thermal bath, the tissue sample, temperature monitoring sensors, the dual-needle probe, and the thermal properties analyzer (). The thermal bath is utilized to impose controlled temperature values throughout the measurements (typical temperatures range from room temperature to 95-100 °C, however, in the study by Lopresto et al. temperatures up to 113 °C were considered [Citation125]). The tissue specimen is placed in a galvanized container thus avoiding a direct interaction between the sample and the water in the thermal bath, without impeding the passage of heat. Fiber optic sensors [Citation62,Citation126] or thermocouples [Citation125,Citation127] are employed to monitor the temperature in the tissue during the experiment.
Figure 2. Techniques used for measuring thermal properties of biological tissues as temperature varies: setup and equipment. (a) Setup used to measure thermal properties with the dual-needle technique (top left); image of the galvanized container, employed to hold the tissue specimen and placed in the thermal bath, and of the utilized sensors, i.e., dual-needle sensor connected to the thermal properties analyzer and fiber optic sensors, housed in a needle, for temperature monitoring (top right) [Citation62]. The heating needle of the instrument heats the tissue for th=30 s, and the monitoring needle measures the resulting tissue temperature for 90s. The initial temperature Tin is then subtracted to the readings to obtain the ΔT to be used in EquationEquations (4)(8)
(8) and Equation(5)
(10)
(10) (bottom left). Thus, the thermal diffusivity, volumetric heat capacity, thermal conductivity, and the estimated error (i.e., Syx) can be obtained for the specific tissue temperature (bottom right). (b) Illustration of the thermistor probe utilized for the measurement of thermal properties with the self-heated thermistor technique [Citation121]. Below, the graph taken from Bhavaraju and Valvano (Reprinted by permission from Springer Nature Customer Service Center GmbH: Springer, International Journal of Thermophysics, [Citation122], Copyright 2021) shows the trend of the applied thermistor power over the resulting temperature rise as a function of t−1/2. The linear regression is employed to calculate the steady-state and transient terms. Two materials of known thermal properties are employed (e.g., agar-gelled water and glycerol) for the thermistor probe calibration. (c) Differential scanning calorimetry (DSC) systems: power compensation DSC (top left) and heat-flux DSC (top right), ‘R’ and ‘S’ represent the reference pan and the sample pan, respectively (figure modified from [Citation123]). Below, example of DSC thermographs (heat flow versus temperature) attained with a differential scanning heat-flux calorimeter (bottom left) and resultant trend of specific heat capacity of biological tissues versus temperature (bottom right). Reprinted by permission from Springer Nature Customer Service Center GmbH: Springer Nature, Biophysics, [Citation124], Copyright 2021. Through the measurement of the heat flux with the empty crucible pan, the crucible with reference material (with known mass and specific heat), and the crucible with the tissue sample under analysis, it is possible to calculate the specific heat capacity of the tissue sample, knowing the sample mass. The trends marked with 1 and 2 refer to the measurement on the wall of Baker’s cyst tissue and adipose tissue surrounding the cyst; 1’ and 2’ refer to the same samples undergoing reheating.
![Figure 2. Techniques used for measuring thermal properties of biological tissues as temperature varies: setup and equipment. (a) Setup used to measure thermal properties with the dual-needle technique (top left); image of the galvanized container, employed to hold the tissue specimen and placed in the thermal bath, and of the utilized sensors, i.e., dual-needle sensor connected to the thermal properties analyzer and fiber optic sensors, housed in a needle, for temperature monitoring (top right) [Citation62]. The heating needle of the instrument heats the tissue for th=30 s, and the monitoring needle measures the resulting tissue temperature for 90s. The initial temperature Tin is then subtracted to the readings to obtain the ΔT to be used in EquationEquations (4)(8) α=[cPtransient/Pstaedy−state(1+dk)]2(8) and Equation(5)(10) σ(t)=σ0⋅ sin (ωt+δ)(10) (bottom left). Thus, the thermal diffusivity, volumetric heat capacity, thermal conductivity, and the estimated error (i.e., Syx) can be obtained for the specific tissue temperature (bottom right). (b) Illustration of the thermistor probe utilized for the measurement of thermal properties with the self-heated thermistor technique [Citation121]. Below, the graph taken from Bhavaraju and Valvano (Reprinted by permission from Springer Nature Customer Service Center GmbH: Springer, International Journal of Thermophysics, [Citation122], Copyright 2021) shows the trend of the applied thermistor power over the resulting temperature rise as a function of t−1/2. The linear regression is employed to calculate the steady-state and transient terms. Two materials of known thermal properties are employed (e.g., agar-gelled water and glycerol) for the thermistor probe calibration. (c) Differential scanning calorimetry (DSC) systems: power compensation DSC (top left) and heat-flux DSC (top right), ‘R’ and ‘S’ represent the reference pan and the sample pan, respectively (figure modified from [Citation123]). Below, example of DSC thermographs (heat flow versus temperature) attained with a differential scanning heat-flux calorimeter (bottom left) and resultant trend of specific heat capacity of biological tissues versus temperature (bottom right). Reprinted by permission from Springer Nature Customer Service Center GmbH: Springer Nature, Biophysics, [Citation124], Copyright 2021. Through the measurement of the heat flux with the empty crucible pan, the crucible with reference material (with known mass and specific heat), and the crucible with the tissue sample under analysis, it is possible to calculate the specific heat capacity of the tissue sample, knowing the sample mass. The trends marked with 1 and 2 refer to the measurement on the wall of Baker’s cyst tissue and adipose tissue surrounding the cyst; 1’ and 2’ refer to the same samples undergoing reheating.](/cms/asset/ea346af8-1456-476f-9246-6d3d63321084/ihyt_a_2028908_f0002_c.jpg)
Table 2. Overview of the material thermal properties and relevant information which can be obtained through the dual-needle technique, self-heated thermistor technique, and differential scanning calorimetry.
A probe with two parallel needles (i.e., dual-needle probe) is used both to provide heat and measure the temperature in the tissue, once it is inserted in the prepared tissue sample. Thus, the basic principle of the dual-needle technique involves the imposition of a current to the first needle for a determined time (th), hence providing a certain heat q to the specimen, and the measurement of the attained tissue temperature variations, exerted by the second needle with temperature sensing capabilities. Considering as reference temperature the one measured when the heating phase initiates, the temperature rise ΔT can be obtained. The thermal properties analyzer, to which the two-needle probe is connected, is employed to measure the properties of interest.
Following the measurements, the values of thermal conductivity (k) and diffusivity (α) are calculated by the method of least squares in order to minimize the quadratic errors with respect to the temperatures attained by the theoretical model [Citation62,Citation126]:
(4)
(4)
(5)
(5)
in (Equation4
(4)
(4) ) and (Equation5
(5)
(5) ), Ei represents the exponential integral, whose approximation is given by polynomial functions [Citation128], while r refers to the distance between the two needles of the probe, and t is the time. Furthermore, the volumetric heat capacity (cv) is calculated as cv = k/α [Citation62].
The dual-needle technique has been employed also to study the thermal properties of interest during cooling processes [Citation126,Citation127]. Indeed, following the heating process, it is sufficient to let the thermal bath cool naturally and perform subsequent measurements as temperature subsides. As a result, it is possible to study the presence of irreversible effects on the thermal properties in tissue (as reported by Guntur et al. in porcine liver [Citation127]), determined by high temperatures also leading to variations of tissue state, or, conversely, certain reversibility of the variations in thermal properties, as observed by Silva et al. in ovine liver and kidney tissue [Citation126,Citation129].
4.1.2. Self-heated thermistor technique
The self-heated thermistor technique is an experimental measurement technique used to determine, in biological tissues, thermal conductivity, and diffusivity as a function of temperature ().
The technique typically involves the use of a thermal bath to impose temperatures of interest on a sample of the biological tissue under investigation; a protective container in which tissue sample is located before immersing it in a thermal bath; the use of a probe equipped with a single thermistor, which performs a dual function: measuring the tissue temperature and providing thermal power q(t) to the tissue of interest [Citation121].
In particular, the probe consists of spherical thermistors covered by a glass capsule, i.e., an insulator (). To perform the measurements, the probe is then placed inside the biological tissue.
The thermal properties measurement mechanism is based on the imposition of a certain q(t), and its regulation in order to keep the temperature of the thermistor (i.e., Tt) stable [Citation121]:
(6)
(6)
being Psteady state the steady-state power, whereas Ptransient represents the transient component, and t is the time. The values of tissue thermal conductivity k and thermal diffusivity α can be obtained by resolving the thermal model which describes the thermal interaction between the probe and the tissue [Citation130,Citation131]:
(7)
(7)
(8)
(8)
in which ΔT corresponds to the temperature change measured by the thermistor probe as the difference between Tt and the temperature of tissue at equilibrium before supplying the electrical power, while a, b, c, and d represent coefficients of calibration depending on the thermistor thermal properties and geometrical characteristics.
The properties measured by the thermistor probe are assumed to describe the average properties of a certain tissue volume surrounding the probe itself (e.g., ∼1 cm3 [Citation121]).
4.1.3. Differential scanning calorimetry
Differential Scanning Calorimetry (DSC) is a widely utilized method of thermodynamic analysis, allowing for the investigation of thermal properties of materials, including the measure of specific heat capacity of tissues (). In particular, in DSC, the temperature-dependent variation of physical and energetic material properties is monitored versus temperature and time [Citation132,Citation133]. DSC instruments typically consist of a single or a double furnace, two crucibles, one containing the specimen of the material under evaluation, whereas the other one is left empty and serves as a reference, and thermocouple sensors for temperature monitoring [Citation132]. Two DSC configurations can be identified on the basis of the operating mode, i.e., power compensation and heat-flux DSC [Citation132,Citation134] (). In the first DCS instrumentation, one furnace contains the crucible with the sample, while a second furnace encloses the reference pan. The temperatures of the specimen and reference are kept at the same value by changing the energy provided to the specimen and the one supplied to the reference. Hence this differential power is monitored versus sample temperature and time. Conversely, a single furnace is employed in the so-called heat-flux DSC. Within the furnace, a thermo-electric disk is utilized to transfer the heat to the specimen-containing and the reference crucibles [Citation133]. The differential temperature between the sample under test and the reference, i.e., ΔT, and the heat flux of the specimen q are characterized by a direct proportionality relationship according to the thermal equivalent Ohm’s law (Equation9(9)
(9) ):
(9)
(9)
in which R is the thermo-electric disk resistance [Citation135]. The different temperatures of the reference and the specimen under analysis are ascribable to the heat capacity of the sample material. Advantageous features of DCS techniques refer to the relatively reduced times and specimen dimensions required for heat capacity measurements [Citation123,Citation136].
4.2. Mechanical properties measurement techniques
4.2.1. Dynamic mechanical analysis
Dynamic Mechanical Analysis (DMA) is a commonly employed experimental technique for the measurement of the viscoelastic behavior of diverse typologies of materials in relation to time, frequency, and temperature, under application of oscillating loads [Citation137,Citation138] (). Typically, in DMA systems, the sample is held in position and fixed between two arms or plates, or through clamps, and subsequently enclosed in the thermal chamber. A sinusoidal axial or torsional oscillatory force is applied to the specimen by means of a motor and a driveshaft [Citation137,Citation138]. The induced deformation is monitored using an inductive displacement transducer (LVTD). Strain and stress are in phase in the case of elastic material behavior, whilst the material viscosity is related to the lag in phase between the imposed stress and the resulting strain [Citation142,Citation143]. Two widely employed DMA systems concern forced resonance and free resonance analyzers [Citation137,Citation144]. In forced resonance analyzers a particular oscillation frequency is imposed to the material of interest and temperature is varied in a set range, while in the free resonance mode, the occurring free oscillations associated with material damping are monitored [Citation137]. DMA allows for the measurement of various mechanical properties [Citation145]. For instance, in oscillatory tensile or compressive tests, considering the stress σ(t) and the resulting strain ε(t):
(10)
(10)
(11)
(11)
being σ0 the stress amplitude, ε0 the strain amplitude, ω oscillation frequency, t the time and δ the phase angle, different parameters can be obtained such as storage modulus E’, loss modulus E’’, complex modulus E*, and the loss factor tanδ (i.e., the tangent to phase angle) expressed as the ratio between the loss modulus and the storage modulus () [Citation142]. Different test modalities are available, e.g., dynamic tests (including frequency, strain, or time sweep, temperature ramp) and transient mode analyses. The possibility to characterize a broad range of materials under multiple conditions, and the commercial availability of the instruments, have fostered the application of DMA, also for the analysis of the mechanical behavior of biological materials as a function of temperature.
Figure 3. Principal measurement techniques employed for characterizing the mechanical behavior of biological tissues: setup and instrumentation. (a) System (Endura TEC ELF 3220) used for dynamical mechanical analysis tests on liver tissue (left); close-up on the acrylic platens, the tissue specimen, the loading cell, and the mover of the system used for the measurement of the viscoelastic properties (right). Reprinted from [Citation139], Copyright 2021, with permission from Elsevier. (b) Picture of the tissue specimen prepared for shear rheology tests, positioned between the upper and the lower plate of the parallel-plate system (a), sketch of the parallel-plate rheometer and the tissue (b): ‘H’ and ‘R’ represent the tissue specimen height and the plate radius, respectively. Reprinted from [Citation140], Copyright 2021, with permission from IOS Press. (c) Setup employed to perform share wave elastography measurements on ex vivo porcine brain tissues. Reprinted from [Citation141], Copyright 2021, with permission from Elsevier.
![Figure 3. Principal measurement techniques employed for characterizing the mechanical behavior of biological tissues: setup and instrumentation. (a) System (Endura TEC ELF 3220) used for dynamical mechanical analysis tests on liver tissue (left); close-up on the acrylic platens, the tissue specimen, the loading cell, and the mover of the system used for the measurement of the viscoelastic properties (right). Reprinted from [Citation139], Copyright 2021, with permission from Elsevier. (b) Picture of the tissue specimen prepared for shear rheology tests, positioned between the upper and the lower plate of the parallel-plate system (a), sketch of the parallel-plate rheometer and the tissue (b): ‘H’ and ‘R’ represent the tissue specimen height and the plate radius, respectively. Reprinted from [Citation140], Copyright 2021, with permission from IOS Press. (c) Setup employed to perform share wave elastography measurements on ex vivo porcine brain tissues. Reprinted from [Citation141], Copyright 2021, with permission from Elsevier.](/cms/asset/e0e7375d-f74b-4bc2-8a47-c7a8925e8e60/ihyt_a_2028908_f0003_c.jpg)
Table 3. Overview of the principal material parameters which can be obtained through classic stress-strain tests, dynamic oscillatory tests, and shear wave elastography.
4.2.2. Shear rheology
The rheological characterization of materials allows for the investigation of their deformation and flow under specific conditions [Citation146,Citation147]. Different experimental modalities exist, including flow, transient, and oscillatory analysis. As many materials exhibit a complex mechanical behavior that cannot be identified as purely elastic or viscous, since it is affected by both contributions (i.e., viscoelastic behavior), rheological evaluations are performed to measure the solid-like and viscous-like properties. Oscillatory tests are largely employed to investigate the characteristic of the viscoelastic material [Citation148], and consist of the application of a sinusoidal shear strain γ(t) at a specific oscillation frequency, ω, as expressed in (Equation12(12)
(12) ) [Citation149]:
(12)
(12)
and the monitoring of the subsequent time-dependent stress τ(t):
(13)
(13)
being γ0 the strain amplitude, τ0 the stress amplitude, t the time, and δ the phase angle [Citation150].
In the case of an ideal elastic solid material behavior, the resulting stress is in-phase with the applied shear deformation, the ratio between stress and strain represents the shear modulus. Conversely, for purely viscous material, there is a phase shift (δ) equal to 90° between the imposed strain and the resulting stress, moreover, the attained stress is proportional to the shear rate by a proportionality factor which is the viscosity. Viscoelastic materials are characterized by a phase lag between the applied strain and the obtained stress, hence 0°< δ < 90°. Oscillatory shear rheology permits to measure the storage modulus G’ which refers to the elastic and reversible response of the material, the loss modulus G’’, related to the irreversible remodeling and energy dissipation, the complex shear modulus G*, and the loss factor tanδ (which is the ratio between the loss modulus and the storage modulus, ). Different configurations exist, e.g., concentric cylinders, a plate and a cone, or two parallel plates [Citation151]. In this last configuration, for instance, a plate remains fixed whilst the other one possesses the capability to rotate, thus applying a shear strain to the specimen under study (). Furthermore, various test modes can be set, namely temperature ramp, and time, frequency, or strain/stress sweep.
4.2.3. Shear wave elastography
The method of shear wave elastography allows to nondestructively measure the elastic properties of diverse biological media and their variation, hence it represents a valuable tool for diagnostic purposes and to investigate the temperature dependence of mechanical properties. The basic principle of operation involves both the mechanical stimulation (production of share waves) and the attainment of real-time medical images of the tissue under analysis in order to monitor the share wave propagation. Through the assessment of the velocity of shear waves, the values of mechanical properties can be obtained. Particularly, in case of quasi-plane waves generation, the medium shear modulus G is related to the shear wave velocity cs, according to the following expression:
(14)
(14)
being ρ the tissue density [Citation152].
An experimental setup to perform shear wave elastography measurements is depicted in and refers to the study conducted by Liu et al. [Citation141] on porcine brain tissues. Particularly, as it can be observed, two samples of porcine brain were utilized for each experiment: one was employed to perform shear wave velocity measurements in six regions of interest and the other one was used to monitor the temperature change in the tissue. A thermometer consisting of four thermocouples was used to measure temperature: two of which (T2, T3) were inserted into one of the two brain samples, the other two (T1, T4) were immersed in the physiological saline solution in which the two tissue samples were located. A heating platform provided the necessary heat to increase the temperature of the physiological saline, thereby incrementing the brain temperature. An ultrasound scanner was used, exploiting the supersonic shear imaging technique [Citation153], shear waves were generated by an ultrasound probe in the brain tissue, and their propagation was traced; based on the monitoring of the velocity of the shear wave, information concerning the tissue shear modulus was attained.
5. Thermophysical properties of biological tissues as a function of temperature
Through thermophysical properties, it is possible to characterize the behavior of a material (tissue, in our case) when it is subjected to a change in temperature or given thermal energy (a widely used and referenced database in thermal properties studies can be consulted online: https://itis.swiss/virtual-population/tissue-properties/database/).
Concerning the variation of thermophysical properties with temperature, the majority of the literature studies have investigated the temperature dependence of these properties in ex vivo biological tissues, including liver, bone, myocardium, cartilage, brain, lung, spleen, kidney, pancreas, and tumorous tissues. The main results of the analysis on thermophysical properties are reported in .
Table 4. Thermophysical properties of biological tissues as a function of temperature.
5.1. Thermal conductivity
Thermal conductivity, expressed in W/(m·K), measures the ability of a material to conduct heat.
One of the earliest studies available in the literature dates back to 1985 when Valvano et al. measured the thermal properties of different healthy tissues, i.e., liver, heart, brain, lung, spleen, kidney, pancreas, and tumorous tissues, i.e., human adenocarcinoma of the breast and colon cancer [Citation121]. In this comprehensive study, which involved the utilization of 65 tissue samples for the measurements, self-heated thermistor probes were employed to assess the thermal properties in canine, porcine, human and rabbit tissues, at different temperatures (3 °C, 10 °C, 17 °C, 23 °C, 30 °C, 37 °C, and 45 °C). Besides, a liner fitting was used to represent the thermal properties variation with temperature and compare to that of water. This linear regression did not include the thermal properties of fat, cancer, and lung, since these tissues displayed significantly different values compared to the other investigated tissues. Within the considered temperature range, the temperature dependence of thermal conductivity of tissues resulted comparable with the one of water. Nonetheless, lower values were registered for thermal conductivity of tissues with respect to water. Moreover, substantial inter-tissue, inter- and intra-species variations in thermal conductivity were observed.
In 1986, Zelenov studied the trend of thermal conductivity of compact bone tissue harvested from a human femur, in the temperature range between 21 °C and 95 °C [Citation154].
The experimental setup included copper cylinders to contain the tissue, heating platforms to provide thermal energy, water to impose the desired temperature, and a differential thermocouple to measure temperature changes in the tissue. As observable from the results shown in , the thermal conductivity values in the radial and tangential directions resulted similar to each other, while the values in the axial direction were higher than the previous ones. For this characteristic behavior, the compact bone tissue can be typically defined as transversely isotropic. Furthermore, despite the partial anisotropy, an increasing trend was observed in all the directions until ∼37 °C, followed by a linear decrease.
By employing the same technique introduced by Valvano et al. in 1985 [Citation121], based on the use of a self-heated thermistor, the temperature sensitivity of the thermal conductivity of different tissues (such as trabecular bone, myocardium, and cartilage) has been assessed.
Fajardo et al. analyzed trabecular bovine bone tissue between 37 °C and 57 °C [Citation155]. The resulting trend of thermal conductivity, reported in , was slightly increasing with temperature. Bhavaraju et al. investigated the thermal conductivity of ex vivo porcine myocardium between 25 °C and 76 °C [Citation122]. The results showed a slightly increasing trend up to 37 °C; at this temperature, the thermal conductivity reached a value of 0.531 W/(m·K), and then decreased as the temperature rose, assuming a value of 0.476 W/(m·K) at 76 °C.
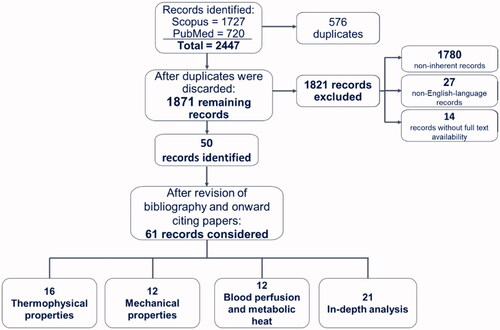
Figure 4. (a) Thermal conductivity of different tissues and biological media (i.e., trabecular bone, brain, lung, pancreas, spleen, collagen, liver, myocardium, septal cartilage, kidney) as a function of temperature. (b) Temperature dependence of thermal conductivity of liver investigated in different studies including measurements in human, bovine, ovine, porcine, and rabbit tissues.
Youn et al. analyzed the thermal conductivity of the cartilage of porcine nasal septum [Citation160]: the measurements were performed at under ex vivo conditions at 27 °C, 37 °C, and 50 °C, showing an increasing trend with temperature ().
Regarding the hepatic tissue, several studies have been performed both in human samples and in biological tissues of animals of different species.
Lopresto et al. opted for a technique based on the combined use of a thermal bath and a dual-needle thermistor, whose function was both to provide heat to the tissue and to measure its thermophysical properties [Citation125]. By adopting this approach, they investigated the thermal conductivity in ex vivo bovine liver tissue samples over a temperature range from 21 °C to 113 °C, excluding the measurements between 99 °C and 101 °C. The values corresponding to the mentioned temperatures were discarded due to excessive error increment in the measurement, probably related to the change in the state of the water contained in the tissue. The observed trend () was almost constant and remained in the range of 0.48–0.58 W/(m·K) up to 90 °C, after this temperature there was a rapid growth that culminated at 99 °C with a value of 2.25 W/(m·K). From 101 °C up to 113 °C, on the other hand, a decreasing trend was recorded, leading to values lower than the starting ones. In fact, at ∼113 °C the measured thermal conductivity was 0.19 W/(m·K).
The same measurement technique was used by Guntur et al. to study the thermal conductivity of ex vivo porcine liver [Citation127]. The temperature range under analysis included values from 20 °C up to 90 °C, in which the trend of the thermal conductivity could be described by an asymmetric quasi-parabolic curve with upward concavity, showing a minimum of 0.520 W/(m·K) at around 35 °C. Subsequently, they studied any changes in thermal conductivity during natural cooling, up to 20 °C. As shown in , the thermal conductivity value remained approximately constant from the last value recorded at 90 °C, denoting an irreversible change induced by tissue heating.
In a further study, Silva et al., utilizing the same measurement technique, investigated the thermal conductivity in ex vivo ovine liver, in a temperature range from 25 °C to 97 °C [Citation126]. From it is possible to observe a value varying within 0.46–0.56 W/(m·K) up to 90 °C; beyond this temperature, exponential growth of thermal conductivity was assessed, recording a value of 1.08 W/(m·K) at ∼97 °C.
Silva et al. also performed the measurement of thermal properties during cooling cycles from 90 °C to 95 °C to body temperature, i.e., 37 °C (). The thermal conductivity trend over temperature showed values higher than basal thermal conductivity for temperatures >90 °C and the absence of hysteresis. Moreover, temperatures >85 °C led to higher estimated errors in the thermal property measurement. Differently from the findings reported by Guntur et al. in porcine hepatic tissue [Citation127], the thermal conductivity of ovine liver samples returned to its baseline values upon natural cooling. Hence, the results suggested that, as long as total evaporation of tissue water is not reached (<100 °C), the variations in thermal properties due to heat can be recoverable. As before mentioned, these last data differ from the results attained in [Citation127]. However, it is difficult to perform a straightforward comparison between the two experimental studies since, for instance, tissues were procured from animals of different species (porcine [Citation127] and ovine [Citation126] liver tissues) and the tissue sample preparation protocols and methods presented differences (e.g., the immersion of the specimen in phosphate-buffered saline [Citation127] or the use of a sealed vacuum container to reduce the sample dehydration [Citation126]).
Recently, Mohammadi et al. employed the technique based on the usage of a dual-needle sensor to measure thermal properties of ex vivo porcine liver in a temperature range between 22 °C and around 97 °C [Citation62]. The results were comparable with previous studies investigating the thermal conductivity in bovine [Citation125], ovine [Citation126] tissues. In particular, the measured thermal conductivity was subjected to a gradual variation after ∼70 °C, showing an increase by 60% of its initial value at 92 °C, and further increased up to a value of ∼1.64 W/(m·K) at 97 °C.
In the same experimental work, the temperature dependency of thermal conductivity of ex vivo calf brain and porcine pancreas was also investigated. Concerning the brain tissue, a substantial increment of thermal conductivity with temperature was observed at 92 °C and above, which resulted in a thermal conductivity 4-times higher than the initial value in the 92–97 °C temperature interval (). Regarding the pancreatic tissue, the thermal characterization was possible only up to 45 °C, since at this temperature a change of the tissue state occurred. No substantial variations in the thermal conductivity of pancreas were assessed in the investigated interval (i.e., 22–45 °C).
Using the self-heated thermistor technique, Choi et al. investigated the thermal conductivity of both porcine and human liver at temperatures ranging from 25 °C to 80 °C under ex vivo conditions [Citation156]. In both cases, a slightly increasing trend in this thermal property with temperature was recorded (). After heating, further measurements at 25 °C were performed, and a decrease in thermal conductivity of 18% and 16% from the initial values of 0.49 W/(m·K) and 0.50 W/(m·K), was observed, respectively for swine and human tissues.
Watanabe et al. [Citation157], based on the steady comparative method, measured the change in thermal conductivity in pig liver between 25 °C and 90 °C and observed a direct proportionality between temperature and thermal conductivity, which could be described by the equation of a straight line. In a subsequent study, Watanabe et al. opted for the unsteady hot-wire method, which involves the use of a cylindrical heating probe, equipped with a thermocouple, to perform measurements, and a thermal bath to impose the temperature [Citation158]. The attained results on porcine liver samples between 25 °C and 100 °C showed a constant thermal conductivity value of ∼0.53–0.54 W/(m·K) up to 65 °C, and then a decreasing trend up to 100 °C. Both studies by Watanabe et al. were conducted under ex vivo conditions.
Bhattacharya et al. employed the unsteady hot-wire method to perform their studies [Citation159]. They investigated the thermal conductivity of ex vivo bovine liver between 25 °C and 90 °C and recorded an increasing trend of thermal conductivity with temperature ().
Following natural cooling, the thermal conductivity at 25 °C was found to be 23% higher than the initial value at the same temperature. Moreover, they analyzed the thermal conductivity of ex vivo bovine collagen between 25 °C and 80 °C. By performing heating and cooling cycles on different samples, in gradually increasing temperature ranges (), they found an increasing trend with temperature (). It was also noted that, for cycles exceeding a temperature of 55 °C, upon cooling the thermal conductivity did not return to the initial value, being 12% higher than the latter.
Moreover, Silva et al., using the dual-needle technique, examined thermal conductivity in ex vivo ovine kidney [Citation129]. The thermal conductivity remained constant from 20 °C to 80 °C and then was characterized by an increasing trend from 80 °C to 95 °C. Following the heating process, the tissue was subjected to a natural cooling process, which presented an almost superimposable trend compared to that obtained during heating.
Overall, as observable in , in the temperature interval of ∼20–60 °C, most of thermal conductivity values of biological tissues and media range between 0.4 W/(m·K) and 0.7 W/(m·K), with minimum values for bovine trabecular bone and maximum values associated to ovine collagen. At higher temperatures, up to 76–80 °C, a slight increase in thermal conductivity is observed for ovine collagen and in some studies on bovine and porcine liver tissue, whereas a decreasing trend is observed for porcine myocardium. Significant increases in thermal conductivity are registered above ∼90 °C, probably owing to vaporization, up to a value of 2.25 W/(m·K) at 99 °C for liver tissue. Conversely, from 101 °C up to 113 °C, thermal conductivity shows a decreasing trend with temperature (). A separate discussion is needed for compact bone, whose thermal conductivity in the 21–95 °C temperature interval assumes values ranging from ∼9 W/(m·K) up to almost 13 W/(m·K), which might be due to the bone low water content ().
5.2. Specific heat
Specific heat, expressed in J/(kg·K), represents the amount of heat required to increase the temperature of a material by 1 °C, per unit mass. This property was analyzed in liver, white and gray brain matter, compact bone tissue, Baker’s cyst wall and adipose tissue surrounding it, prostate, pancreas, and cardiac muscle tissue, among others. In addition, the trend of specific heat as temperature changes was investigated in tumor tissues such as glioblastoma, diffuse astrocytoma, breast cancer metastasis, and lung adenocarcinoma metastasis.
In the study by Watanabe et al. [Citation157], porcine liver samples were examined ex vivo by two measurement techniques: DSC and modulated differential scanning calorimetry (MDSC). The latter has the characteristic of not neglecting the effect of endothermic reactions caused by protein denaturation during tissue heating. By DSC, an increasing trend was recorded up to 65 °C, and at this temperature, a maximum peak of 3.75 × 10³ J/(kg·K) was reached. Then, a decreasing trend up to 90 °C was registered. In contrast, by MDSC, at temperatures between 20 °C and 90 °C, a linear relationship between temperature and specific heat was identified.
Human and porcine liver samples were analyzed under ex vivo conditions in the study by Choi et al. [Citation156] between the temperatures of 25 °C and 85 °C by DSC. For both tissues, measurements were performed under two different conditions. In the first case, samples were placed directly into the aluminum container of the DSC machine, preventing the water content from varying. In this way, two consecutive heating cycles were performed. In the second case, samples were pre-heated outside the DSC machine to account for water loss. Both tissues analyzed presented a similar behavior when varying the temperature. The results obtained in the first case showed, during the first heating, at around 65 °C, a maximum peak of 3.81 × 10³ J/(kg·K) for porcine liver and 3.72 × 10³ J/(kg·K) for human liver (, ). In contrast, during the second heating, the value of the specific heat remained nearly constant compared with the initial value, i.e., around 3.46 × 10³ J/(kg·K), for both tissues. In the second case, the specific heat maintained an approximately constant trend over the entire temperature range under consideration, however, the values recorded were 14% lower than those obtained by preserving the entire water content ().
Figure 5. (a) Specific heat relative to hepatic, adipose tissue, brain (white and gray matter), compact bone tissue in axial, radial, and tangential direction, as a function of temperature. (b) Temperature-dependent specific heat of tumorous tissues such as glioblastoma, diffuse astrocytoma, breast cancer, and lung adenocarcinoma. The results were attained from the study by Sano et al. [Citation161].
![Figure 5. (a) Specific heat relative to hepatic, adipose tissue, brain (white and gray matter), compact bone tissue in axial, radial, and tangential direction, as a function of temperature. (b) Temperature-dependent specific heat of tumorous tissues such as glioblastoma, diffuse astrocytoma, breast cancer, and lung adenocarcinoma. The results were attained from the study by Sano et al. [Citation161].](/cms/asset/ceef7f4f-b2e3-42e9-82bf-95a30e7db048/ihyt_a_2028908_f0005_c.jpg)
The temperature dependence of the specific heat of liver tissue (bovine) was investigated by Haemmerich et al., specifically in the 25–83.5 °C temperature range [Citation162]. The measurement experimental setup involved the usage of two plate electrodes to uniformly increase the temperature of the liver specimen by means of a radiofrequency generator, and thermocouples for temperature monitoring. The samples were insulated with expanded polystyrene. The temperature-dependent specific heat underwent a 1.2-fold increase at 83.5 °C (registering a value of 4.187 × 10³ J/(kg·K)) compared to its initial value at 25 °C. Furthermore, at temperatures >70 °C, a significant water loss was registered.
In a recent work, Agafonkina et al. investigated the thermal properties of different tissues, namely, human healthy and tumorous prostate tissue, as well as benign prostatic hyperplasia, human kidney (healthy and cancer tissue), human hepatic and pancreatic tissues (healthy), and porcine cardiac tissue, in the temperature range between −160 °C and 40 °C, by means of DSC [Citation163]. The results showed higher specific heat capacity values for tumor tissues of the kidney compared to healthy tissue. Moreover, a lower moisture content, compared to kidney tissues, was associated to lower values of specific heat capacity of liver, pancreas, and porcine cardiac tissue. Concerning the prostate, at temperatures above 10–15 °C, the specific heat capacity associated to tumorous tissue was characterized by a more rapid increase with temperature compared to normal tissue.
In the study performed by Zelenov, the specific heat trend, between 21 °C and 95 °C, of compact bone tissue from a human femur was analyzed [Citation154]. The experimental trial was conducted by the same technique used to measure thermal conductivity. In all three directions, the trend in specific heat was observed to decrease between 21 °C and 37 °C, whereas from 37 °C to 95 °C it linearly increased, culminating in a value of 1.941 × 10³ J/(kg·K), 2.131 × 10³ J/(kg·K) and 2.212 × 10³ J/(kg·K), for the axial, radial, and tangential directions, respectively ().
Chernyadiev et al. studied the specific heat of Baker’s cyst as a function of temperature [Citation124]. Baker’s cyst develops at the posterior side of the knee as a result of the accumulation of synovial fluid. In this study, the inner wall of the cyst and the adipose tissue surrounding it were examined under ex vivo conditions by DSC between 40 °C and 95 °C. Both tissues presented a slightly increasing trend with increasing temperature (). Particularly, the specific heat of the inner wall of the cyst, around temperatures of 65 °C and 70 °C, showed a maximum peak of 4.46 × 10³ J/(kg·K).
Finally, Sano et al. [Citation161] conducted a study including both the analysis of the white and gray matter of the brain and measurements on tumorous tissues affecting the brain. The analysis was performed by DSC at temperatures ranging from 37 °C to 60 °C. As depicted in , white matter and gray matter showed a similar trend, assuming comparable values to each other and slightly increasing with temperature.
The specific heat of diverse tumor tissues, although assuming different values, presented a qualitatively similar trend as the temperature varied (). The specific heat assumed an increasing trend between 37 °C and 43 °C; then, it decreased, albeit with a smaller slope, at higher temperatures.
5.3. Volumetric heat capacity
Volumetric heat capacity represents the amount of heat required to increase the temperature of a material by 1 °C, per unit volume. It is determined by the product of specific heat and density, and it is measured in MJ/(m3·K).
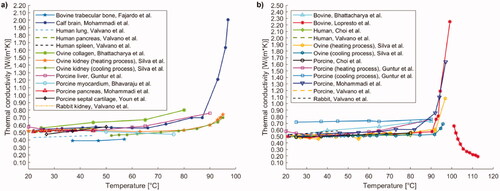
Volumetric heat capacity was investigated in the liver, pancreas, brain, and ovine kidney under ex vivo conditions. Relative to the liver, several experimental trials have been conducted. Guntur et al. [Citation127] analyzed the trend of volumetric specific heat of porcine liver samples by dual-needle technique, during a heating process and subsequent cooling. The temperature range under evaluation extended from 20 °C up to 90 °C. The results obtained from the heating process followed the trend of a quasi-parabolic asymmetric curve with upward concavity and exhibiting a minimum equal to ∼3.57 MJ/(m3·K) at 35 °C (). Regarding the cooling process, the specific volumetric heat remained approximately constant, throughout the temperature range considered, with the last value obtained at the end of the heating process (at 90 °C, during heating, the volumetric heat capacity was 4.296 MJ/(m3·K)).
A further study was conducted by Lopresto et al. [Citation125], who performed measurements on ex vivo bovine liver samples at temperatures ranging from 21 °C to 113 °C, excluding, as mentioned above, measurements in the range of 100 °C. The results, obtained by dual-needle technique, showed a constant trend up to 90 °C, followed by a rapid growth up to 99 °C. Conversely, from 101 °C to 113 °C, a progressive decrease in the specific volumetric heat capacity was assessed (). Moreover, Silva et al. [Citation126], using the same measurement technique, carried out studies on ex vivo ovine liver samples between 25 °C and 97 °C. They observed that the specific volumetric heat capacity remained almost constant up to 90 °C and then assumed an exponential behavior up to 97 °C. In a subsequent study, Silva et al. investigated the trend of the volumetric heat capacity of ex vivo ovine kidney, in a temperature range between 20 °C and 95–96 °C [Citation129]. The study was carried out by imposing a temperature increment, followed by a cooling process. The attained results showed a qualitatively constant trend up to 95 °C, i.e., a temperature value correlated to water vaporization in the tissue. In the cooling process, the trend of the specific volumetric heat capacity followed the values assumed during the heating process.
Figure 6. Temperature dependence of volumetric heat capacity of different biological media, i.e., bovine liver, calf brain, ovine kidney, ovine liver, porcine liver, and porcine pancreatic tissue.
With a similar setup, Mohammadi et al. also investigated the temperature dependence of volumetric heat capacity of porcine liver and pancreas tissues, and calf brain within the temperature range from 22 °C up to ∼97 °C [Citation62]. The porcine liver tissue reported an approximately constant volumetric heat capacity (ranged between 3.48 MJ/(m3·K) and 3.70 MJ/(m3·K)) up to 92 °C. After this temperature, an increment was observed (e.g., at 97 °C, a mean value of 4.99 MJ/(m3·K) was registered). Concerning the measurements on calf brain specimens, the volumetric heat capacity did not undergo major variations at temperatures lower than 93 °C; however, it increased at higher temperatures (e.g., 4.98 MJ/(m3·K), at 97 °C), as depicted in . Furthermore, for pancreas tissue, within temperatures of 22–45 °C, no substantial changes in volumetric heat capacity were assessed. In this temperature range, the average maximum and minimum values for pancreatic tissue samples were 3.63 MJ/(m3·K) and 3.76 MJ/(m3·K), accordingly.
5.4. Density
The density [kg/m3] represents the mass of a material per unit volume. The temperature dependence of density has been investigated on ex vivo ovine liver by Silva et al. [Citation126]. In particular, the density was evaluated in tissue samples at room temperature and following a tissue temperature increase imposed by a water thermal bath. The density measurements attained post-heating exhibited no substantial variations from the baseline density value measured at room temperature. Indeed, considering an average initial value of 1128 kg/m3, the average values at 60 °C, 90 °C, and 95 °C were 1028 kg/m3, 1031 kg/m3, and 1104 kg/m3, respectively. The observed density values were explainable by considering that mass and tissue volume were subjected to similar percentage losses upon heating (for instance, 24–23% at 90 °C).
5.5. Thermal diffusivity
Thermal diffusivity measures the rate at which a material reacts to a change in temperature. It is defined as the ratio of thermal conductivity to the product of density and specific heat capacity. Its unit of measurement is m2/s. Several studies measured the thermal diffusivity of biological media as it varies with temperature. These investigations involved different typologies of soft and hard tissues, including liver, myocardium, lung, brain, pancreas, spleen, kidney, bone, cartilage, and some cancerous tissues.
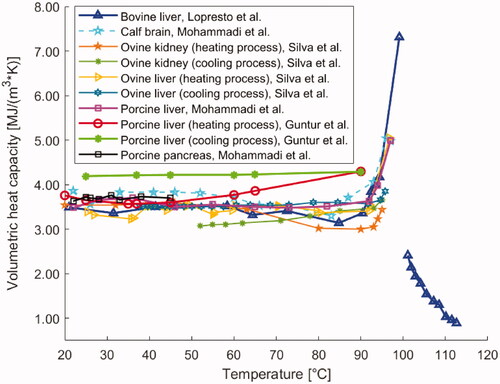
In the previously described investigation by Valvano et al. [Citation121], besides the thermal conductivity, also the thermal diffusivity of biological tissues as a function of temperature (i.e., 3–45 °C) was assessed by means of self-heated thermistors. The results of a linear fitting of the thermal properties of liver, heart, brain, spleen, kidney, pancreas with temperature indicated correspondence between the thermal diffusivity of tissue and the one of water, in terms of both temperature dependence trend and actual values. Lopresto et al. [Citation125] examined thermal diffusivity in bovine liver samples under the same conditions previously described in Section 5.1. The results showed a rise in thermal diffusivity at 99 °C corresponding to ∼2 times the baseline value at 21 °C, and specifically a marked increase from 90 °C to 99 °C. Between 101 °C and 108 °C, the thermal diffusivity subsided (decreasing by ∼25%) and then assumed again an increasing trend up to 113 °C ().
Figure 7. Thermal diffusivity of different biological materials (i.e., liver, brain, lung, pancreas, spleen, myocardium, and kidney tissue) versus temperature.
Guntur et al. measured thermal diffusivity in porcine liver from 20 °C up to 90 °C [Citation127]. In this case, the attained thermal diffusivity trend described a quasi-parabolic asymmetric curve, showing upward concavity, and a minimum at 35–40 °C equal to 0.141 × 10⁻⁶ m2/s (). Moreover, at 90 °C, thermal diffusivity was >30% higher than its initial value registered at 20 °C. During a successive cooling process to 20 °C, the thermal diffusivity remained approximately constant to the last value measured at 90 °C during heating (i.e., 0.192 × 10⁻⁶ m2/s).
Besides, Silva et al. [Citation126] investigated the thermal diffusivity in ovine liver between temperatures of 25 °C and 97 °C. The observed trend was almost constant up to 90 °C and exponentially increased from the latter temperature up to 97 °C. Silva et al. [Citation129] also measured the thermal diffusivity in ex vivo ovine kidney samples between 20 °C and 95 °C. From 20 °C up to about 60 °C, a constant trend was observed, whilst, from 60 °C up to 95 °C, the thermal diffusivity increased with temperature. Furthermore, after the temperature increment, the tissue thermal properties were analyzed once again during a natural cooling period. It allowed observing certain reversibility, since, upon cooling, the thermal diffusivity reverted approximately toward its previous values for both ovine liver [Citation126] and kidney tissues [Citation129].
As far as concerns porcine liver tissue (ex vivo), the study performed by Mohammadi et al. [Citation62] reported a progressive increment of thermal diffusivity from around 70 °C until 92 °C; at 92 °C, the thermal diffusivity value was 40% higher than the nominal value measured at 22 °C. Furthermore, major variations were observed between 92 °C and 97 °C, indeed thermal diffusivity rose to 0.297 × 10⁻⁶ m2/s at 97 °C. For calf brain tissue, the thermal diffusivity grew by 90% up to 92 °C; moreover, from 92 °C to 97 °C, a 2.5-fold increase in this thermal property was assessed, probably due to the onset of the vaporization phenomenon of the water present in the tissue. Overall, the results were in accordance with previous investigations [Citation125–127]. Finally, about pancreatic tissue, the results showed no substantial changes in thermal diffusivity in the investigated range of 22–45 °C, which was in agreement with the measurements on liver and brain tissues. The five previously described studies were conducted using dual-needle probes [Citation62,Citation125–127,Citation129].
Conversely, exploiting the self-heated thermistor technique, Bhavaraju et al. [Citation122] investigated thermal diffusivity on porcine myocardial samples over a temperature range extending from 25 °C to 76 °C. The measurements showed a weakly increasing trend as the temperature increased, up to a value of 0.179 × 10⁻⁶ m2/s at 76 °C (, ).
Furthermore, Youn et al. [Citation160] analyzed thermal diffusivity in porcine nasal septum cartilage at temperatures of 27 °C, 37 °C, and 50 °C. The results (displayed in ), obtained by the self-heated thermistor technique, exhibited no statistically significant difference in values of thermal diffusivity as the temperature rose.
Concerning hard tissues, thermal diffusivity in the human femur was investigated by Zelenov between 21 °C and 95 °C [Citation154], in axial, radial, and tangential directions. Regarding thermal diffusivity, an increasing trend up to 37 °C was registered, culminating in a peak. Thereafter, a linearly decreasing trend was identified, up to 95 °C. Although the trends were qualitatively similar in all the directions, it can be observed that, in the axial direction, diffusivity assumed the highest values, ranging from approximately 3.98 × 10⁻⁶ m2/s to 7.12 × 10⁻⁶ m2/s ().
6. Mechanical properties of biological tissues as a function of temperature
Mechanical properties characterize the behavior of a material, or, in our case, a biological tissue subjected to the application of forces. The mechanical properties of biological media analyzed in this paragraph as a function of temperature are shear modulus (transverse and longitudinal), elastic modulus (Young’s modulus), storage modulus, loss modulus, complex modulus, loss factor, and stiffness. The main results of the analysis on mechanical properties as a function of temperature are reported in .
Table 5. Mechanical properties of biological tissues as a function of temperature.
6.1. Shear modulus
Shear modulus, also known as tangential elastic modulus, expresses the tangential stress-strain relationship and it is measured in pascal [Pa]. As shown in , Liu et al. [Citation141] observed the variation of shear modulus in brain as a function of temperature using the shear wave elastography technique, applied to ex vivo porcine brain specimens (). From around 23 °C to ∼37 °C, the shear modulus subsided almost linearly with temperature, whereas between 37 °C and 43 °C, its value remained approximately constant. Furthermore, for temperatures exceeding 43 °C, an increase in the shear modulus of the brain with temperature was observed.
Concerning ex vivo bovine liver tissue, Sapin-de Brosses et al. measured the shear modulus using quantitative supersonic shear imaging technique (SSI) [Citation113]. The results in show that the average shear modulus, before the samples were heated, was 3.4 kPa and it remained approximately constant from 25 °C to 45 °C; above this threshold, its value rose exponentially with temperature (). In the same study, Sapin-de Brosses et al. also analyzed the shear modulus in ex vivo bovine muscle, distinguishing the longitudinal from the transverse component. From , it can be observed that the temperature-dependent trend of the longitudinal component could be divided into four phases: its value diminished linearly with temperature up to 43 °C, a variation in slope was observed at around 37 °C, afterward an exponential decrease until 57 °C, and a subsequent exponential increment with temperature up to 64 °C were registered.
Figure 8. Shear modulus of brain, liver, and muscle tissues as a function of temperature.
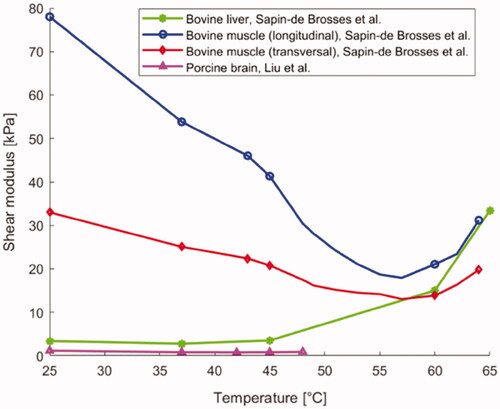
The transverse shear modulus had a very similar trend (), however, unlike the longitudinal component, only three phases could be identified: its value decreased linearly up to 43 °C with no change in slope, then, as for the longitudinal component, an exponential decrease until 57 °C, and a further exponential increment with temperature up to 64 °C were reported.
6.2. Elastic modulus
Elastic modulus (Young’s modulus), expressed in Pa, is a characteristic quantity of material that expresses the relationship between applied stress and deformation resulting from that stress. This definition is valid under the assumptions of uniaxial loading and elastic material behavior. Young’s modulus is among the main measures of intrinsic material stiffness, and it is often indicated as ‘material stiffness’ [Citation170].
Protsenko et al. studied how the elastic modulus varies in porcine nasal septum cartilage by imposing a temperature increment by means of RFA (500 kHz) [Citation164]. The elastic modulus was measured as a function of temperature in an ex vivo unconfined compression experiment. The equilibrium modulus at 60 °C was 80 kPa. The elastic modulus decreased with temperature once the cartilage reached values higher than ∼60 °C. Specifically, it continued to decrease until it reached 16 kPa at a temperature of 80 °C ().
An additional study investigating cartilage behavior was performed by Chao et al. who measured, using DMA, the variation in elastic modulus in rabbit nasal septal cartilage heated by laser irradiation (exposure of 10 s at a power density of 21.22 W/cm2, with a laser wavelength of 1320 nm), upon assumption of linear viscoelasticity [Citation5]. Samples underwent three laser exposures with cooling times of 30 s between each irradiation; the maximum surface temperature was 65 °C. Starting from a value of 6.08 MPa in native tissue, a decrease in elastic modulus throughout the laser treatment and following each subsequent irradiation was assessed. The most important change was observed immediately after the cessation of laser exposure when the elastic modulus value reached its minimum. After 60 min of immersion in a saline solution at 25 °C, the elastic modulus reverted to ∼90% of its initial value ().
The mechanical behavior of cartilage was also investigated by Liu et al. by means of the phase-sensitive optical coherence elastography method based on optical coherence tomography (OCT) [Citation165]. They measured Young’s modulus of ex vivo porcine nasal septal cartilage. As shown in , at room temperature (i.e., 20 °C) the elastic modulus was 1 MPa and its value increased in relation to increasing temperature up to 40 °C. In the range between 40 °C and 70 °C, Young’s modulus significantly decreased as a function of temperature. In the same study, the results obtained with OCT were compared to the values attained with a mechanical elastomeric system (i.e., method of mechanical compression, MMC, ).
In the study performed by Bonfield et al. [Citation166], Young’s modulus of bovine compact bone (femur) was investigated in dependence on temperature variation (−58–90 °C). Being the chemical stability of hydroxyapatite maintained under 400 °C [Citation171], the temperature dependence of Young’s modulus of bone was attributed mostly to the temperature dependence of Young’s modulus of collagen, considering an ideal hydroxyapatite-collagen composite material. Between 0 °C and 25 °C, it was possible to identify an inverse dependence between Young’s modulus and temperature (). On the other hand, between 50 °C and 90 °C, bone tissue was characterized by structural variations and non-equilibrium recovery.
6.3. Storage modulus
The storage modulus, measured in Pa, is related to the elastic component of a viscoelastic material and refers to the mechanical energy stored in a loading cycle [Citation139]. In case of uniaxial forces, the storage modulus is denoted by the symbol E', while, in case of deformations occurring due to shear forces, G' represents the shear storage modulus [Citation172]. The hypothesis of viscoelastic behavior differentiates the storage modulus from the elastic modulus.
In the work by Chae et al. [Citation167], the temperature dependence of the flexural storage modulus E' of porcine nasal septum cartilage was investigated, using DMA, with a single cantilever configuration. In this study it was shown that the storage modulus decreased with temperature, with a substantial variation from 58 °C to 60 °C where it decreased by 85–90%, showing this trend for all frequencies (13 Hz, 24 Hz, 37 Hz, and 61 Hz). In general, as can be seen from , relaxation began at 50 °C with a gradual decrease due to a combination of factors, including water loss and changes in the molecular structure of the material, caused by heating. The assumed value at the end of the relaxation was between around 4 MPa and 7 MPa at 65 °C. At room temperature, the storage modulus for longitudinally and transversely oriented samples was 19–22 MPa and 14–16 MPa, respectively.
Figure 9. (a) Temperature dependence of storage modulus E' of porcine septal cartilage and back skin. (b) Trend of shear storage modulus G' of porcine liver specimens as a function of preparation temperature.
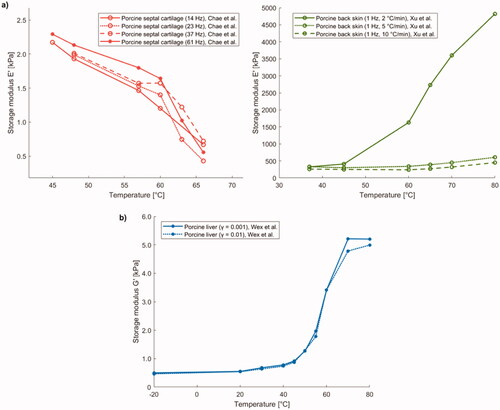
To evaluate the viscoelastic properties of skin as a function of temperature change (25–80 °C), Xu et al. performed experiments on ex vivo porcine skin samples using a DMA, utilizing a single cantilever bending testing mode [Citation168]. Specifically, they employed the same frequency (i.e., 1 Hz) and three different heating rates: 2 °C/min, 5 °C/min, and 10 °C/min. The storage modulus E', as shown in , increased with temperature for all three heating rates. However, using rates of 5 °C/min or 10 °C/min, its value did not significantly increase; in contrast, for a heating rate of 2 °C/min, there was a substantial increase (), probably owing to water release.
Wex et al., instead, performed rotary shear rheology experiments employing a parallel plate rheometer to quantify the values of shear storage modulus G' in porcine liver specimens (8 healthy porcine livers) as a function of preparation temperature (−20, 20, 30, 40, 45, 50, 55, 60, 70, 80 °C) [Citation114]. In order to increase the temperature of the sample, the specimen was placed in a Krebs Ringer Hepes Solution, previously heated at a set temperature. Concerning frozen-thawed samples, the samples were placed in a freezer (−20 °C) at least for 1 h and subsequently defrosted at room temperature. For the strain sweep tests, a frequency equal to 1 Hz and strain amplitudes between 0.0001-1 were considered, while for the frequency sweep a strain amplitude of 0.001 was set and frequency was changed from 0.1 Hz to 10 Hz. With regard to the shear storage modulus, they measured an increase in its value in correspondence with an increase in temperature (). Compared to the value at room temperature (i.e., 20 °C) they recorded an increase of 65% at a temperature of 45 °C (deformation equal to 0.1%), while for a deformation equal to 1% an increase of 55% at 45 °C with respect to room temperature was assessed. Moreover, at 70 °C, the results showed increases of factors of 9.3 and 9.1, compared to room temperature, for deformations equal to 0.1% and 1%, respectively. Almost constant values were registered for temperatures of 70–80 °C ().
Considering the frequency dependency, an increment in the preparation temperature from 20 °C to 70 °C resulted in a 10.4-, 9.4-, and 9.1-fold increase of the average value of the storage modulus for 0.1 Hz, 1 Hz, and 10 Hz, correspondingly.
6.4. Loss modulus
The loss modulus represents the viscous component of a viscoelastic material, and it is related to the mechanical energy dissipated as a result of deformation. It is denoted by the symbol E'' or G'' in case of application of uniaxial or shear forces, respectively, and measured in Pa.
also shows the values of the loss modulus E'' that were attained from the measurements of Xu et al. on specimens of porcine skin by means of DMA with a single cantilever bending testing mode [Citation168]. Their trend is similar to that of the storage modulus: they increased with temperature and with a heating rate of 2 °C/min there was a relevant increase as the temperature rose ().
Figure 10. (a) Loss modulus E'' of porcine back skin versus temperature. (b) Trend of shear loss modulus G'' of porcine liver samples as a function of preparation temperature.
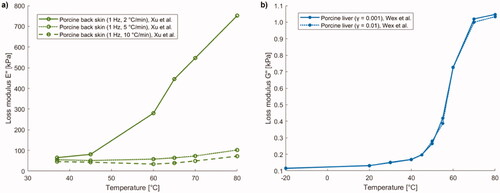
Wex et al. measured, by shear rheology experiments, the loss modulus G'' trend as a function of preparation temperature in porcine liver specimens and obtained a similar behavior to that of the storage modulus [Citation114]. The loss modulus also increased with increasing temperature, but less abruptly, indeed, with respect to the value at room temperature (i.e., 20 °C) they recorded an increase of 52% at 45 °C (deformation equal to 0.1%), whereas for a deformation equal to 1% an increase of a factor 44% at 45 °C with respect to room temperature was assessed; moreover, they noted increases equal to a factor of 7.8 (for deformation of 0.1%) and 7.6 (for deformation of 1%), at 70 °C (), which are less than the ones observed for the storage modulus. Regarding the frequency dependency, an increment of the preparation temperature from 20 °C to 70 °C showed a 9.9-, 8.4-, and 6.4-fold increase of the average value of the loss modulus for 0.1 Hz, 1 Hz, and 10 Hz, respectively. Therefore, the average value of the loss modulus resulted lower than the storage modulus for all the investigated preparation temperatures.
6.5. Complex modulus
The complex modulus is a complex number whose real part represents the storage modulus, while the imaginary part concerns the loss modulus. Consequently, the complex modulus considers, in a load-unload cycle, both the stored mechanical energy, determined by the elastic characteristic of the material, and the energy dissipated due to the viscous properties of the material. According to the nature of the imposed forces, the complex modulus E*, for uniaxial forces, or the shear complex modulus G*, for shear forces, can be defined.
In the work by Kiss et al. [Citation139], the frequency-dependent complex modulus E* of ex vivo porcine and canine liver tissue was studied by DMA techniques (dynamic mechanical testing in compression) using two different modalities to induce thermal injury: RFA and double immersion boiling (DIB). In the first approach, tissue lesions were produced at 70 °C, 80 °C, and 90 °C (treatment time of 10 min), by means of a multi-prong electrode connected to the radiofrequency generator. The lesions were then separated from the bulk tissue, put in saline solution for a minimum time of 1 h, and placed in a refrigerator. The second method, named DIB, was adopted due to the difficulty to obtain uniform ablations, the complexity of the preparation, as well as the reduced dimensions related to the samples, attained with RFA. This second approach used a distilled water bath and a temperature controller to obtain the temperature increment in tissue to a defined temperature value which was maintained for a specific time (15 min), after which the samples were placed in a second bath at room temperature (5 min). Also in this case, the cut samples were then placed in isotonic saline solution. Periodic strains were applied to the samples (0.1 Hz–50 Hz, with 1% peak-to-peak amplitude), which underwent a preload of compression to 1%. Prior to oscillations to each selected frequency, the strain level of 1.5% was maintained for 5 s. In this study all the measurements were performed at room temperature, thus the complex modulus was reported as a function of the preparation temperature (). For canine liver tissues, the two trends obtained with the two preparation methods were quite similar, indeed, both presented a local maximum at 70 °C. Regarding the samples of canine tissue treated with RFA, the complex modulus presented a local maximum in correspondence of a preparation temperature of 70 °C. At this temperature value, the attained absolute value of complex modulus was around 18 kPa at 0.1 Hz, ∼25 kPa for the frequency of 1 Hz, and 35 kPa at 10 Hz; a softening of the tissue at 80 °C was assessed, with a subsequent stiffening at 90 °C. A similar trend was observed for canine tissue prepared with double immersion boiling. Moreover, regarding the magnitude of complex modulus at 70 °C, values of around 20 kPa, 29 kPa, and 41 kPa were registered at 0.1 Hz, 1 Hz, and 10 Hz, accordingly. For porcine liver samples, an absolute maximum was observed corresponding to a preparation temperature of 75 °C. At this temperature, the absolute values of the complex modulus were, for instance, around 15 kPa, ∼20 kPa, and ∼30 kPa in case of 0.1 Hz, 1 Hz, and 10 Hz, respectively. After this temperature, the complex modulus started decreasing, and differently from the canine tissue, no further increase was observed except in case of the frequency of 10 Hz which showed a small rise at 90 °C.
Figure 11. (a) Magnitude of complex modulus (|E*|) of canine and porcine liver samples prepared with radiofrequency ablation (RFA) or double immersion boiling (DIB) as a function of preparation temperature. (b) Magnitude of complex shear modulus (|G*|) of porcine liver versus preparation temperature.
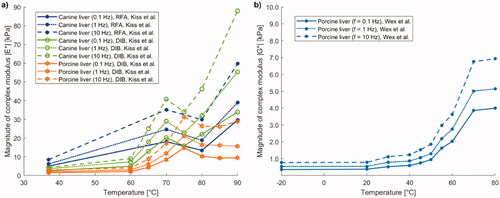
Wex et al. measured the complex shear modulus G* during shear rheology experiments performed on healthy porcine liver tissue [Citation114]. For a shear strain of 0.1%, the absolute value of the complex shear modulus rose by 164% from the room temperature to around 40 °C, whilst in case of 1% shear strain, an increase of 152% was assessed, in the same temperature interval. The complex shear modulus at 70 °C was found to be around 9 times higher than its value at room temperature. Regarding the frequency sweep tests, a comparison with the results of Kiss et al. was performed by converting the values of the absolute value of E*, attained by Kiss et al., to absolute values of G* considering a Poisson’s ratio of 0.5. A more progressive increment in the complex shear modulus was observed by Wex and colleagues, within the 40–70 °C temperature range, conversely, as previously reported, Kiss et al. attained a marked increase at around 70 °C. Despite the general accordance of the results, the main discrepancies could be ascribed to the different experimental protocols, sample preparation as well as the anisotropy associated with the hepatic tissue, considering the different performed tests: shear rheology experiments (Wex et al.), while tests in compression, normal to the specimen surface (in case of Kiss et al.). Overall, the results of Wex et al. showed that mechanical properties were influenced by temperature above the body temperature. Specifically, exceeding 40 °C, major variations in the collagen matrix led to changes in the mechanical properties of hepatic tissue ().
6.6. Loss factor
The loss factor (tanδ) represents the ratio of dissipated to stored mechanical energy and provides the tangent of the phase shift between stress and strain in a viscoelastic material. It is given by the ratio between loss modulus and storage modulus.
Xu et al. [Citation168] evaluated the loss factor (tanδ = E''/E') as a function of temperature for porcine skin specimens up to 80 °C. The loss factor was almost insensitive to temperature variation and remained approximately constant at a value of ∼0.2, thus the damping and viscous properties of the porcine skin tissue samples seemed not to be particularly influenced by the temperature variation ().
Figure 12. (a) Loss factor (tanδ = E''/E') of porcine back skin versus temperature, and tanδ of porcine and canine liver samples prepared with radiofrequency ablation (RFA) or double immersion boiling (DIB) as a function of preparation temperature. (b) Loss factor (tanδ = G''/G') of porcine liver versus preparation temperature.
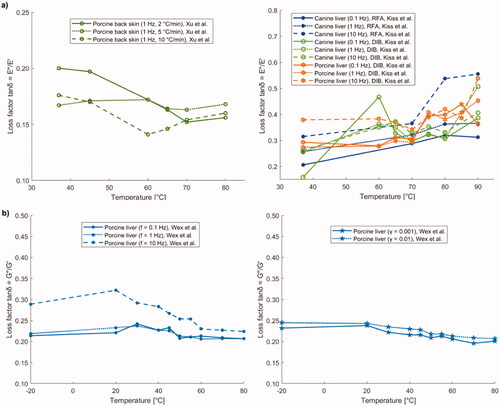
Furthermore, Kiss et al. [Citation139], as mentioned in the previous paragraph on the investigations concerning the complex modulus, analyzed canine and porcine liver using two different techniques for lesion preparation, i.e., RFA and DIB. As regards the samples undergoing RFA, at 80 °C the canine tissue was characterized by loss factor values (tanδ = E''/E') of 0.3 and 0.55 at 0.1 Hz and 10 Hz, respectively, hence denoting the most marked viscoelastic response, while lower values of loss factor were registered at preparation temperatures <80 °C (). Conversely, for the canine samples subjected to DIB, most of the values of loss factor ranged between 0.3 and 0.4. Finally, for DIB-induced thermal lesions in porcine samples, the loss factor ranged 0.275–0.55.
In , the loss factor values (tanδ = G''/G') measured by Wex et al. [Citation114] are reported. The loss factor in porcine liver samples slowly decreased as preparation temperature rose >20 °C, thus samples at room temperature appeared slightly more viscous than heated specimens. Particularly, the loss factor subsided with increasing temperature for shear deformations of 0.04–5%. Regarding the frequency dependence, the loss factor was in the range 0.2–0.35. The average value of the loss factor was higher at room temperature compared to the temperature of −20 °C and temperature ≥20 °C. Moreover, it showed similar trends for 0.1 Hz and 1 Hz, while higher values were registered for 10 Hz ().
6.7. Stiffness
The stiffness of a loaded structure is defined as the ratio between the applied load and the subsequent deformation; it is measured in N/mm and it represents an indication of how much load is required to attain a certain deformation [Citation170,Citation172].
Stiffness is the geometric property of the sample, and it is related to other mechanical properties. For instance, the Young’s modulus E, which is the material property, is directly proportional to the sample stiffness [Citation172]. Within the elastic region (i.e., where the relationship between strain and stress is linear), the axial stiffness of a longitudinal structure can be calculated as:
(15)
(15)
being A the cross-sectional area and L0 the initial length.
Wex et al. studied, through specific ex vivo indentation tests, how stiffness varies as a function of temperature in swine livers [Citation98]. The experimental setup included a force transducer, a robotic arm, the indenter, and whole porcine livers. The utilization of the whole organs was intended to reduce to the minimum the variations in boundary conditions. To study the temperature dependence of the tissue properties, a buffer solution was used to increase the temperature of the organs to 40 °C, 50 °C, 60 °C, 70 °C, 80 °C, or 90 °C, the indentation tests were then performed at room temperature (flat-punch indentation, constant velocity of 2 mm/s). Between 20 °C and 50 °C, the results showed no significant differences in the mean stiffness value, which, as reported in , was in the range of 0.25–0.29 N/mm. On the contrary, with increasing temperature (>60 °C), a significant increase in the stiffness of porcine liver was measured, with mean values of 0.77 N/mm, 1.24 N/mm, and 1.17 N/mm, at 70 °C, 80 °C, and 90 °C, respectively.
In the work by Bass et al. [Citation169], the instantaneous elastic stiffness was analyzed in lumbar spine porcine ligaments. A temperature-controlled bath was used to increment the tissue temperature at the initial temperature value of the tests (i.e., 37.8 °C). Experiments were performed in an environmental chamber at set temperatures of 37.8 °C, 29.4 °C, 21.1 °C, 12.8 °C, and 4.4 °C. The ligaments were maintained hydrated during the tests; the specimens were subjected to preconditioning (20% strain fast ramp and hold), a 20% strain fast ramp and hold, and oscillatory tests (20% oscillatory strain). An increase in stiffness was observed with decreasing temperature; particularly, considering an average stiffness value of 216 N/mm at 37.8 °C, the stiffness rose by 100% at 4.4 °C (i.e., 434 N/mm).
7. Blood perfusion and metabolic heat
Blood perfusion and metabolic heat have an impact on heat diffusion and temperature distribution within biological tissues. Hence, their possible variation as a function of temperature could in turn influence the final therapeutic outcome of thermal treatments [Citation173].
Investigations have shown that with decreasing temperature, i.e., from body temperature to 0 °C, the metabolic rate subsides, showing at 0 °C values 12–13 times lower than at 37 °C [Citation174]. Considering the metabolic heat [W/m3], it was found to depend on the local tissue temperature [Citation175]. Indeed, upon heating, during thermal treatments, cells require a higher amount of energy to guarantee, for instance, ion gradients across cell membranes and preserve structural properties. Enhanced rates of metabolic reactions have been assessed with increasing temperatures, particularly depending on the temperature sensitivity of kinetics of enzymatic reactions. Incremented turnover rates of fatty acids and glucose, as well as effects on the citrated cycle have been observed upon delivery of the thermal dose. All these elements may play a role to the microenvironmental conditions, hence to the final result of the hyperthermic procedures [Citation176,Citation177].
Another fundamental factor affecting the thermal outcome during hyperthermia treatments concerns the blood flow in perfused tissues. Blood perfusion refers to the passage of a certain blood volume through vessels embedded in biological tissues, in order to provide oxygen and deliver important nutrients to tissues, as well as remove waste substances [Citation178]. The blood flow can be expressed as the volume of blood, which is forced to flow within a tissue, per tissue mass per unit of time [Citation179], i.e., mL/100 g/min. Moreover, knowing the tissue density, the blood perfusion rate (i.e., the volumetric rate per unit tissue volume, often expressed in 1/s [Citation180]) can be attained as the product of blood flow and the tissue density [Citation181]. The blood flow has been investigated at both normothermic conditions and at temperatures that do not lie in the physiological range, by imposing a temperature variation to biological media through different methods. Likewise, the temperature sensitivity of the blood perfusion has been assessed in different tissues; preclinical studies on healthy tissues and on tumor models have been set, as well as evaluations on blood flow upon temperature changes during clinical trials.
In the experimental work performed by Xu and colleagues [Citation182], the blood perfusion of canine prostate tissues subjected to transurethral microwave treatments was assessed by means of pulse-decay self-heated thermistors. The attained values of steady-state blood perfusion rate over temperature (from ∼34.5 °C to around 43 °C) showed an approximately linear trend.
Akyürekli et al. [Citation183] investigated the impact of regional microwave hyperthermia (915 MHz, target temperature equal to 44.5 °C) on the blood flow of normal porcine skeletal muscle (21 animals underwent the hyperthermic procedure and 11 were selected as controls). The radioactive microsphere reference sample technique was employed to measure the blood flow. While the anesthesia and the thermocouples positioning did not significantly affect the blood flow distribution, the thermal treatment led to a non-uniformly spatially distributed blood flow. Dependence of temperature distribution was assessed, and an increased blood flow was registered in correspondence of more elevated tissue temperatures and close to the applicator. Particularly, heating for 15–30 min resulted in a mean four-fold increase in the blood flow. Thereafter the hematic flow progressively subsided. Interestingly, the outcomes of this study show that the variation of blood flow upon heating is essentially a local phenomenon, which does not arise from significant systemic flow changes.
Song et al. [Citation184–189] measured the blood flow between 42 °C and 45 °C, for a heating time of 120 min, in Sprague Dawley (SD) rat skin of the leg and muscle tissues by means of the radioactive microsphere method. The temperature change was induced through a water bath. Prior to the heating process, the measured blood flow was 7.1 ml/100 g/min and 4.6 ml/100 g/min for skin and muscle tissue, correspondingly. Incrementing the tissue temperatures at 42 °C and 43 °C, resulted in a gradually increasing trend that persisted during the 120 min of treatment, for both skin and muscle ( (A) and (B)). In case of heating at 44 °C ( (C)), the blood flow of skin rose until it reached a value ∼12.5-fold higher than the baseline value, after 30 min; afterward, a decrease of blood flow was assessed. Regarding the muscle, at this temperature, in the first 60 min, the blood perfusion rose up to 25.0 mL/100 g/min. In the following hour, no significant reduction in blood flow was observed. Concerning the temperature increment at 45 °C, substantial blood flow increases were obtained in both tissues ( (D)). Specifically, blood flow was around 14.2 times higher than the baseline value (after 15 min) for the skin and 7.9 times higher (after 30 min heating) for the muscle tissue. After these time points, blood perfusion started diminishing.
Figure 13. (a) Trend of blood flow versus heating time for different tissues, i.e., muscle, skin, and tumor at diverse hyperthermic temperatures: (A) 42 °C, (B) 43 °C, (C) 44 °C, (D) 45 °C. (b) Graphical representation combining the blood flow of muscle, skin, and tumor tissues as a function of heating time for all the above-mentioned temperatures, in the 42 °C–45 °C range.
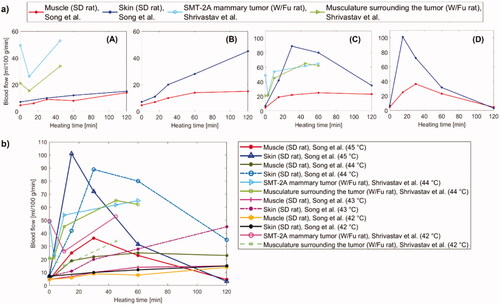
In the study performed Sekins et al. [Citation190], the variation of the blood flow upon temperature changes was measured in human thigh muscles (15 subjects) by correlating the radioactive washout of administered Xenon133 with the local perfusion rate. The temperature increment was assured by microwave diathermy treatments exerted in a contact modality at 915 MHz. The blood flow in human muscle tissue maintained its nominal value until a temperature, defined as critical (∼42 °C), was reached. At higher temperatures, the blood perfusion value underwent a fast rise compared to the baseline value.
As far as regards the investigation of blood perfusion in cancerous tissues, Eddy et al. [Citation191] studied the effect of hyperthermal temperature on the microvasculature of squamous cell carcinoma grown in the cheek pouch chamber of the hamster. Heating the tumor at 41 °C for 3–7 min caused a minimal pathological alteration, described with the reduction in vessel caliber and blood circulation through the tumor. When the tumor temperature was reduced to preheating levels the tumor bed dilated within 2–3 min, and blood circulation increased. After 3 min at 43 °C, a moderate reduction in tumor vessel caliber and blood circulation was observed, and for longer exposition, occasional thromboses, and persistent hyperemia occurred. At 45 °C, severe effects like compression and occlusion of vessels, hemorrhage, and thrombosis were observed, leading to a complete shutdown of circulation characterizing coagulation necrosis.
The impact of microwave heating on microcirculation was studied by Shrivastav et al. on Wistar/Furth (W/Fu) rats [Citation192]. The investigation regarded both healthy and tumorous (SMT-2A mammary adenocarcinoma grown on the right soleus muscle) tissues. The microwave treatment was exerted in a direct contact modality (frequency of 915 MHz), and the blood flow was monitored using 113Sn-labeled microspheres. At 39 °C, no significant variation from the baseline values was observed in the perfusion of both healthy and tumor tissues. Differently, for a temperature increment to 42 °C, the tumor blood flow subsided after 10 min and subsequently reverted to its initial value, after 45 min of heating. Conversely, in the healthy skeletal muscle tissue surrounding the tumor, this marked decrement in blood flow was not registered, and significant vasodilatation occurred after 45 min-heating. Concerning heating at a temperature of 44 °C, the value of the tumor blood flow was diminished after 3 min (vasoconstriction), however, subsequent vasodilatation was assessed at 10 min. Moreover, post 45 min heating at 44 °C, the tumor blood perfusion resulted 1.3-fold higher than the baseline value. Regarding the healthy tissue, after 45 min of heating at 44 °C, the measured blood flow was 3.2 times higher than the control value. Despite this higher enhancement upon heating, the blood flow in healthy tissue was never significantly higher compared to the cancer tissue.
The comparison between the blood flow at 42 °C, 43 °C, 44 °C, and 45 °C in healthy and cancer tissues in rats is shown in . Particularly, concerning the normal tissue, the blood flows of muscle and skin tissues of SD rats studied by Song et al. [Citation184–189], as well as the one characterizing the tumor surrounding musculature in W/Fu rats are presented, along with the blood flow of SMT-2A mammary adenocarcinoma, measured by Shrivastav et al. [Citation192] and previously described.
With regard to tumor tissues, Song et al. also measured the blood flow in Walker carcinoma 256 in SD rats by exposing the tissue to temperatures of 45 °C and 43 °C [Citation184–189]. In small (i.e., <0.5 g) tumors, imposing a temperature of 45 °C led to a weak rise in the perfusion value. Conversely, a significant decrease was observed, after 180 min from the end of the heat exposure, in bigger tumors that previously underwent a heating process conducted at 45 °C for 60 min. In contrast, a temperature elevation to 43 °C (60 min) did not induce substantial variations in blood flow.
Concerning clinical trials, Lagendijk and colleagues presented an in-depth analysis of the perfusion contribution given by the large and medium-sized vessels and by small vessels and discussed the accuracy of the bioheat equation-based approach for the estimation of the blood perfusion in tumors undergoing hyperthermal treatments [Citation193]. Trials on 23 patients with breast cancer treated with MWA showed that perfusion did not change with temperature (measured at different tumor locations) and treatment time during the stationary part of a single treatment session. Compared to the power delivered in a non-vascularized tissue phantom, a 10 times higher power was needed to maintain the therapeutic temperatures (42–44 °C) in in vivo breast tissues. No relationship between the minimum tumor perfusion and volume was found. This last result was in disagreement with previous studies on small animal models and theoretical dependency between perfusion and tumor volume.
Moreover, Waterman et al. studied the effects of hyperthermal temperature on blood flow rate in human tumors [Citation194]. Blood flow was determined by using the bioheat equation, from temperature measured in microwave-heated superficial tumors. The tumor blood flow resulted to be independent of temperature in the range of 40–44 °C. The mean blood flow rate increased 10–15% after 15–30 min of hyperthermia. According to a few data, a temperature above 44 °C caused a reduction of the blood flow. The results of this study were in general agreement with those obtained previously in human tumors by the laser doppler techniques and thermal clearance method.
Some studies investigated the blood perfusion response at a temperature above 45 °C. Brown et al. [Citation195] analyzed the changes in microcirculatory function caused by heat, KHT tumor, and muscle of mice leg. The clearance rate of the radioactive solution injected into the tissues was considered as an indicator of the vascular integrity, in the range 42–46 °C. Whereas until 45 °C the clearance rate of the muscle increased after a certain time at that temperature (∼5 min) and then decreased, at 46 °C the clearance rate started to decrease immediately after the application of the heat, for both tumor and muscle.
Lyons et al. [Citation196] assessed the perfusion in normal canine brain undergoing MWA, at steady-state temperatures from 42 °C to 49 °C and found an increasing amount of perfusion in these conditions.
Van Vulpen and colleagues assessed the prostate perfusion in patients with locally advanced prostate carcinoma, before and after regional and interstitial hyperthermia, until 53 °C, reporting an increase of perfusion in the treated area. Their method was based on fitting the measured tissue temperature trends at the steady-state and during the cooling [Citation197].
As it can be inferred from the experimental evaluations available in the literature, blood perfusion exhibits variabilities according to different factors, e.g., the kind of tumor, the stage of advancement, its dimensions, its vascular pattern, the investigated model (patients vs animals). Furthermore, upon heating, appreciable differences between non-cancerous and tumorous tissues blood flow exist, with a tendency of healthy tissue to dissipate heat more efficiently in comparison to tumors, owing to an enhanced blood flow compared to the baseline value during hyperthermia [Citation184,Citation198].
8. Discussion
Among all the analyzed macro-categories concerning the temperature dependence of biological tissue properties, the results related to thermophysical properties appeared comparable in terms of trends, even though specific differences ascribable to tissue type and experimental conditions must be taken into account. Several articles dealt with the study of the same thermophysical properties, likewise, different properties were investigated using a unique measurement system. Moreover, different properties were measured for each treated tissue, thus making a more complete characterization possible.
On the other hand, as far as the temperature sensitivity of mechanical properties is concerned, the information obtained is more heterogeneous from both points of view: in fact, we found a larger number of properties, measured by different experimental methods. Considering the number of articles analyzed, almost equal for thermophysical properties and mechanical properties, it is possible to deduce the difficulty in characterizing in depth a tissue and its behavior from the point of view of mechanical properties, since approximately the same number of articles dealt with a greater number of properties. On the other hand, the major complexity that can be found when analyzing the articles on thermophysical properties is to critically compare the results for the same property, since these were obtained also using different measurement techniques.
Another appreciable difference between thermophysical and mechanical properties is that in the former, in addition to measuring the thermophysical properties in relation to the increase in temperature, experimental tests were carried out also to evaluate the variation of these properties during cooling cycles. This typically does not happen, instead, for mechanical properties.
Finally, concerning blood perfusion and metabolic heat, we found a reduced number of articles dealing with the comprehensive characterization of these aspects as a function of temperature variation, especially on the temperature dependence of metabolic heat.
With regard to the different kinds of tissues analyzed, liver tissue resulted as one of the most characterized. This is in accordance with the necessity to study the physical behavior of hepatic tissue due to the burden of liver tumor [Citation199,Citation200] and other pathologies affecting this organ, and the advancements and positive results of thermal techniques toward its effective treatment [Citation201,Citation202].
8.1. Thermophysical properties
Most of the studies available to date, in the literature, on the temperature dependence of thermophysical properties have been performed at temperatures between ambient (around 23 °C) and ∼90–95 °C. This range includes many of the temperatures of interest for the development of thermal therapies, however, it excludes measurements around 100 °C, as evaporation and boiling of the water contained in the tissues would make the degree of uncertainty of the measurements too high, compromising their reliability. In fact, as observed in the study by Lopresto et al. [Citation125], at around 100 °C there are significant variations in thermophysical properties, not so much related to the intrinsic characteristics of the specific tissue but mostly determined by the change of state of the water contained in it, hence in this study, the measurements between 99 °C and 101 °C were discarded from the analysis. The thermophysical properties of soft tissues appear rather constant until approximately 90 °C. Beyond this temperature, the properties exhibit a steep increase until around 100 °C, and a few studies have reported the values for temperature higher than 100 °C, in which thermal properties assume decreasing values. Regarding the tissues considered in the different experimental works, we noticed that, as above mentioned, particular attention was paid to the liver, which has been studied by multiple researchers. This allowed us to compare the results obtained by different authors, in relation to the temperature ranges under investigation, the measurement techniques employed, or the nature of the sample used. For example, we have noted that at temperatures between 30 °C and 70 °C, the thermal conductivity of the liver assumes typical values in the range of 0.5 W/(m·K), although different trends are recorded as the temperature varies. In addition, in several studies, the tissue was subjected to a subsequent cooling after the heating process to investigate the possible presence of irreversible effects caused by the previous temperature increase. These effects can be traced to changes in the organic structure of the tissue and protein denaturation. Irreversible effects were observed in liver tissue and collagen. The kidney, on the other hand, despite being subjected to rather high temperatures during heating (up to 95 °C), did not undergo irreversible changes. In fact, it could be observed that the thermophysical properties measured during cooling followed the trend described during the heating process.
Regarding the measurement techniques used to analyze thermophysical properties in biological tissues, we have noticed that some of them are particularly recurrent. These techniques are the DSC, implemented to investigate the specific heat, the self-heated thermistor technique used to measure thermal conductivity and diffusivity, and finally, the dual-needle technique used to analyze thermal conductivity, volumetric heat capacity, and thermal diffusivity.
Concerning the measurement of specific heat, it is important to point out that not all the heat supplied to biological tissue results in an increase in temperature since part of it is involved in endothermic reactions of denaturation of proteins present in the tissue. In studies using DSC to measure the specific heat, it is possible to observe that the trends present a maximum peak at protein denaturation temperatures (around 60 °C). In fact, due to the endothermic reactions of protein denaturation, the biological tissue requires a greater amount of heat to increase its temperature by 1 °C, i.e., it is characterized by a higher specific heat. For this reason, Choi et al. [Citation156] decided to define the specific heat measured by DSC as ‘apparent specific heat’ in their discussion. In this regard, Watanabe et al. [Citation157], in addition to DSC, used MDSC, since the latter allowed to eliminate the effect of endothermic reactions on specific heat measurements.
Regarding the dual-needle technique and the self-heated thermistor technique, it is possible to identify some peculiarities and differences between them. For example, both involve the use of a thermal bath to impose on the sample the temperatures of interest at which to carry out the measurements, but what most distinguishes them is the type of probe used for measurements. In the first technique, a probe with two needles is used: the first needle provides thermal energy to the tissue, the second one allows to perform measurements. In the second technique, instead, there is a probe, equipped with a single thermistor, which performs both functions. Taking into consideration more recent articles, we have noticed a tendency to prefer the dual needle technique [Citation62,Citation125–127]. In fact, as previously described, the latter offers the opportunity to fully characterize the tissue, allowing the measurement of thermophysical properties of interest such as thermal conductivity and diffusivity, as well as volumetric heat capacity.
Overall, the slight differences associated with the different tissue characteristics and measurement methods can be ascribed to several factors. The measurement technique can impact the measurement accuracy and the models used to represent the temperature-dependent trends of the parameters. Moreover, the potential effect of the intraspecies variability on the thermal property values should be considered, as reported by Valvano et colleagues [Citation121], and a comparison of the thermal properties recovered from the same tissue but for different species [Citation62] may provide a more detailed overview of the tissue thermal property behavior. shows a considerable difference also between soft and hard tissues (such as bone), which is ascribable to the diverse water content [Citation122].
8.2. Mechanical properties
Regarding the results inherent to the mechanical properties, the information found is rather heterogeneous, since the articles deal with different tissues and properties. Considering the heterogeneity of the results obtained, it is difficult to create straightforward comparisons and parallels between studies dealing with the same property in the same tissue. In fact, in the literature, there are several articles regarding the mechanical properties, but only a restricted number investigated mechanical properties as a function of temperature, although their temperature dependence plays a pivotal role. In general, temperatures higher than 45 °C severely damage the proteins and collagen matrix within the biological tissue, thus resulting in the alteration of the biomechanical properties. The range between 0 °C and 90 °C is of interest, as these are the temperatures mainly investigated in the literature and it is precisely this range in which the predictive mathematical models for the use of thermal therapies are developed. Within this range of temperatures, we have identified some temperature values that are particularly significant for thermal therapies. Indeed, as pointed out by Liu et al. [Citation141], after 42 °C it is possible to identify a considerable variation in the trend of the shear modulus of the brain, which between 20 °C and 37 °C assumes a decreasing trend and after 42 °C, instead, increases with increasing temperature. It is therefore possible to determine a relationship between the variation of the shear modulus trend and protein denaturation, which occurs precisely between 42 °C and 67 °C. As studied by Xu et al. [Citation168], the variation of elastic properties of the skin also depends on the denaturation of some proteins. Among these, collagen, whose denaturation occurs at around 66.8 °C, assumes a fundamental role as it is the main responsible for the variation of elastic properties. As highlighted in the same study, the variation of elastic properties of the skin is also influenced by the effects of dehydration, which occurs during the heating process. A large number of properties are also addressed in the analyzed articles, using different experimental methods to measure their variations.
One experimental technique of particular importance is shear wave elastography, described in detail in Section 4.2.3. It has been used, for instance, to measure shear modulus in the brain and, as described by Liu et al. [Citation141], it has three main advantages over previously used methods. First, the measurements can be performed by immersing the samples in physiological saline, which allows a more realistic reproduction of the actual in vivo conditions. Another advantage is the possibility to perform the measurements in a nondestructive manner and, finally, the temperature can be precisely controlled with thermocouples. Another promising technique for future developments is phase-sensitive optical coherence elastography. The latter allows measuring the speed of propagation of elastic waves in the analyzed tissues, which have been previously excited by air pulses. This speed is then used to calculate Young's modulus of the tissues studied. Using this technique, it is possible to monitor changes in elastic properties in cartilage and different tumor types during heating processes. The advantages, described by Liu et al. [Citation165], are numerous, such as high sensitivity, but the factor that makes this method of particular interest is that it seems applicable also for in vivo measurements. Indeed, since it allows monitoring, noninvasively, of changes in elastic properties throughout the heating process used in cartilage remodeling, its potential application in clinical use is desirable.
Summarizing the behavior of most of the tissue’s mechanical properties, a significant increase of their values with temperature is observable. For instance, after thermal treatment at 60–80 °C, the stiffness of the thermal lesions is four to tentimes higher than normal liver tissue [Citation96,Citation203,Citation204], and its complex shear modulus is approximately nine-fold [Citation114].
8.3. Blood perfusion and metabolic heat
In several works, evaluating the variation of blood perfusion and metabolic heat, their values are reported at fixed temperatures, showing the trend as a function of time. Moreover, the variation in blood perfusion is typically experimentally investigated in the temperature range between around 41 °C and 45 °C. In general, a significant increase of perfusion is observed when the tissue is heated from the body temperature to 44–45 °C [Citation184–189], whereas, beyond 45 °C, the blood flow is reduced. However, these values strongly depend upon the nature of the tissue and tumor, the size of the tumor, the model under study and the experimental conditions.
Besides, different studies on these topics concern the variation of temperature in correspondence of blood flow changes, especially from a computational point of view. We believe that since blood perfusion and metabolic heat are two aspects of fundamental importance for the diffusion and distribution of heat, the effective preprocedural planning of thermal techniques and their overall outcome would benefit from further investigations on these phenomena, especially as a function of temperature, in order to develop increasingly reliable predictive mathematical models. Furthermore, the assessment of the temperature dependence of perfusion and metabolic heat in a wide range of temperatures, including both the typical hyperthermia and ablative temperatures (i.e., around 41 °C to >100 °C) would provide further insights for the characterization of tissue behavior during thermal procedures.
9. Conclusions
This systematic research allowed us to investigate the variation of thermophysical and mechanical properties, blood perfusion, and metabolic heat of biological tissues of interest, as a function of temperature. The collection of this information is of particular importance for the development of predictive mathematical models that permit to plan thermal therapies, aiming at a safer and effective removal of malignant masses. We, therefore, gathered useful information by searching Scopus and PubMed for articles that addressed the mentioned topics. This allowed us to analyze the evolution of the scientific literature from the late 60s until today. In particular, the first investigations concerning the temperature dependence of biological tissue properties date back to 1968 for mechanical properties and 1985 for thermophysical properties. The number of published studies has rapidly increased since the early 2000s, coinciding with the growing interest in thermal therapies and the development of the latter for tumor ablation. One of the most thoroughly characterized biological tissues, from the thermomechanical viewpoint, is the liver; several studies were found also for the cartilage. In contrast, for other tissues, such as brain, skin, bone, breast, kidney, spleen, lung, and pancreas tissue, only a partial characterization was assessed. Therefore, additional experimental trials regarding the temperature dependence of the thermophysical, mechanical properties, as well as blood perfusion, and metabolic heat of both healthy and cancerous tissues are required as they are involved in heat diffusion within biological tissues and affect the final thermal outcome and degree of tissue injury.
Furthermore, since thermal therapies induce temperature variations in the treated tissues, it is essential to know how these mechanisms, varying with temperature, affect their efficacy.
It is important to underline the almost total lack of studies carried out in vivo, a condition that would allow considering the possible effects determined by the environment and physiological factors. For this reason, future developments should be oriented toward the effective measurement of these properties in conditions that well mimic the physiological or pathophysiological environment typical of the tissue subjected to the thermal treatment.
Disclosure statement
No potential conflict of interest was reported by the author(s).
Additional information
Funding
References
- Yeh W-C, Li P-C, Jeng Y-M, et al. Elastic modulus measurements of human liver and correlation with pathology. Ultrasound Med. Biol. 2002;28(4):467–474.
- Wagshul ME, McAllister JP, Limbrick Jr DD, et al. MR elastography demonstrates reduced white matter shear stiffness in early-onset hydrocephalus. NeuroImage Clin. 2021;30:102579.
- Hall CM, Moeendarbary E, Sheridan GK. Mechanobiology of the brain in ageing and Alzheimer’s disease. Eur J Neurosci. 2021;53(12):3851–3878.
- Hiscox LV, Johnson CL, McGarry MDJ, et al. Mechanical property alterations across the cerebral cortex due to Alzheimer’s disease. Brain Commun. 2020;2(1):fcz049.
- Chao KKH, Ho KH, Wong BJF. Measurement of the elastic modulus of rabbit nasal septal cartilage during Nd:YAG (λ = 1.32 μm) laser irradiation. Lasers Surg Med. 2003;32(5):377–383.
- Cohen L. Measurement of the thermal properties of human skin. A review. J Invest Dermatol. 1977;69(3):333–338.
- Rossmann C, Haemmerich D. Review of temperature dependence of thermal properties, dielectric properties, and perfusion of biological tissues at hyperthermic and ablation temperatures. Crit Rev Biomed Eng. 2014;42(6):467–492.
- Hall SK, Ooi EH, Payne SJ. A mathematical framework for minimally invasive tumor ablation therapies. Crit Rev Biomed Eng. 2014;42(5):383–417.
- Alba-Martínez J, Trujillo M, Blasco-Gimenez R, et al. Mathematical models based on transfer functions to estimate tissue temperature during RF cardiac ablation in real time. Open Biomed Eng J. 2012;6:16–22.
- Lin W-C, Tung Y-C, Chang Y-H, et al. Radiofrequency ablation for treatment of thyroid follicular neoplasm with low SUV in PET/CT study. Int J Hyperth. 2021;38(1):963–969.
- Vogl TJ, Naguib NNN, Lehnert T, et al. Radiofrequency, microwave and laser ablation of pulmonary neoplasms: clinical studies and technical considerations - review article. Eur J Radiol. 2011;77(2):346–357.
- Vogl TJ, Straub R, Eichler K, et al. Colorectal carcinoma metastases in liver: laser-induced interstitial thermotherapy—local tumor control rate and survival data. Radiology. 2004;230(2):450–458.
- Muschter R. Laser-induced interstitial thermotherapy of benign prostatic hyperplasia and prostate cancer. Med Appl Lasers II. 1994;2327:287–292.
- Brookes JAS, Lees WR, Bown SG. Interstitial laser photocoagulation for the treatment of lung cancer. Am J Roentgenol. 1997;168(2):357–358.
- Saccomandi P, Schena E, Caponero MA, et al. Theoretical analysis and experimental evaluation of laser-induced interstitial thermotherapy in ex vivo porcine pancreas. IEEE Trans Biomed Eng. 2012;59(10):2958–2964.
- Gangi A, Alizadeh H, Wong L, et al. Osteoid osteoma: percutaneous laser ablation and follow-up in 114 patients. Radiology. 2007;242(1):293–301.
- Sherar MD, Gertner MR, Yue CK, et al. Interstitial microwave thermal therapy for prostate cancer: method of treatment and results of a phase I/II trial. J Urol. 2001;166(5):1707–1714.
- Schwarzmaier H-J, Eickmeyer F, Fiedler VU, et al. Basic principles of laser induced interstitial thermotherapy in brain tumors. Med. Laser Appl. 2002;17(2):147–158.
- Astrahan M, Imanaka K, Jozseff G, et al. Heating characteristics of a helical microwave applicator for transurethral hyperthermia of benign prostatic hyperplasia. Int J Hyperth. 1991;7(1):141–155.
- Mohr FW, Fabricius AM, Falk V, et al. Curative treatment of atrial fibrillation with intraoperative radiofrequency ablation: short-term and midterm results. J Thorac Cardiovasc Surg. 2002;123(5):919–927.
- Cantwell CP, Obyrne J, Eustace S. Current trends in treatment of osteoid osteoma with an emphasis on radiofrequency ablation. Eur Radiol. 2004;14(4):607–617.
- Bernardi S, Giudici F, Cesareo R, et al. Five-year results of radiofrequency and laser ablation of benign thyroid nodules: a multicenter study from the Italian minimally invasive treatments of the thyroid group. Thyroid. 2020;30(12):1759–1770.
- Nishikawa H, Kimura T, Kita R, et al. Radiofrequency ablation for hepatocellular carcinoma. Int J Hyperth. 2013;29(6):558–568.
- Jeong SY, Baek JH, Choi YJ, et al. Radiofrequency ablation of primary thyroid carcinoma: efficacy according to the types of thyroid carcinoma. Int J Hyperth. 2018;34(5):611–616.
- Meloni MF, Chiang J, Laeseke PF, et al. Microwave ablation in primary and secondary liver tumours: technical and clinical approaches. Int J Hyperth. 2017;33(1):15–24.
- Zhang R, Chen J-Y, Zhang L, et al. The safety and ablation efficacy of ultrasound-guided high-intensity focused ultrasound ablation for desmoid tumors. Int J Hyperth. 2021;38(2):89–95.
- Sartori S, Mauri G, Tombesi P, et al. Ultrasound-guided percutaneous laser ablation is safe and effective in the treatment of small renal tumors in patients at increased bleeding risk. Int J Hyperth. 2018;35(1):19–25.
- Korganbayev S, Orrico A, Bianchi L, et al. Closed-loop temperature control based on fiber bragg grating sensors for laser ablation of hepatic tissue. Sensors. 2020;20(22):6496.
- Brace C. Thermal tumor ablation in clinical use. IEEE Pulse. 2011;2(5):28–38.
- Izzo F, Granata V, Grassi R, et al. Radiofrequency ablation and microwave ablation in liver tumors: an update. Oncologist. 2019;24(10):e990–e1005.
- Welch AJ, Van Gemert MJC. Optical-thermal response of laser-irradiated tissue. Dordrecht: Springer Netherlands; 2011.
- Stauffer PR. Evolving technology for thermal therapy of cancer. Int J Hyperth. 2005;21(8):731–744.
- Korganbayev S, Orrico A, Bianchi L, et al. PID controlling approach based on FBG array measurements for laser ablation of pancreatic tissues. IEEE Trans Instrum Meas. 2021;70:1–9.
- Bianchi L, Mooney R, Cornejo Y, et al. Fiber bragg grating sensors-based thermometry of gold nanorod-enhanced photothermal therapy in tumor model. IEEE Sensors J. 2021. doi: 10.1109/JSEN.2021.3082042. https://ieeexplore.ieee.org/document/9435308.
- Lewis MA, Staruch RM, Chopra R. Thermometry and ablation monitoring with ultrasound. Int J Hyperthermia. 2015;31(2):163–181.
- Zhang B, Moser MAJ, Zhang EM, et al. A new approach to feedback control of radiofrequency ablation systems for large coagulation zones. Int J Hyperth. 2017;33(4):367–377.
- De Landro M, Felli E, Collins T, et al. Prediction of in vivo laser-induced thermal damage with hyperspectral imaging using deep learning. Sensors. 2021;21(20):6934.
- De Tommasi F, Massaroni C, Grasso RF, et al. Temperature monitoring in hyperthermia treatments of bone tumors: State-of-the-Art and future challenges. Sensors. 2021;21(16):5470.
- Bianchi L, Orrico A, Korganbayev S, et al. Two-dimensional temperature feedback control strategy for thermal ablation of biological tissue. In 2021 IEEE International Workshop on Metrology for Industry 4.0 & IoT (MetroInd4.0&IoT), Rome, Italy, June 2021. p. 301–306.
- Landro MD, Espíritu García-Molina I, Barberio M, et al. Hyperspectral imagery for assessing laser-induced thermal state change in liver. Sensors (Switzerland). 2021;21:643.
- Kang JK, Kim JC, Shin Y, et al. Principles and applications of nanomaterial-based hyperthermia in cancer therapy. Arch Pharm Res. 2020;43(1):46–57.
- Asadi S, Bianchi L, De Landro M, et al. Laser‐induced optothermal response of gold nanoparticles: from a physical viewpoint to cancer treatment application. J Biophotonics. 2021;14(2):e202000161.
- Liu X, Chen H, Chen X, et al. Radiofrequency heating of nanomaterials for cancer treatment: Progress, controversies, and future development. Appl Phys Rev. 2015;2(1):011103.
- Bianchi L, Mooney R, Cornejo YR, et al. Thermal analysis of laser irradiation-gold nanorod combinations at 808 nm, 940 nm, 975 nm and 1064 nm wavelengths in breast cancer model. Int J Hyperth. 2021;38(1):1099–1110.
- Pearce J. Mathematical models of laser-induced tissue thermal damage. Int J Hyperth. 2011;27(8):741–750.
- Shafirstein G, Feng Y. The role of mathematical modelling in thermal medicine. Int J Hyperth. 2013;29(4):259–261.
- Lopresto V, Pinto R, Farina L, et al. Treatment planning in microwave thermal ablation: clinical gaps and recent research advances. Int J Hyperth. 2017;33(1):83–100.
- Singh S, Melnik R. Thermal ablation of biological tissues in disease treatment: a review of computational models and future directions. Electromagn Biol Med. 2020;39(2):49–88.
- Lopresto V, Pinto R, Cavagnaro M. Experimental characterisation of the thermal lesion induced by microwave ablation. Int J Hyperthermia. 2014;30(2):110–118.
- Nikfarjam M, Muralidharan V, Christophi C. Mechanisms of focal heat destruction of liver tumors. J Surg Res. 2005;127(2):208–223.
- Roti Roti JL. Cellular responses to hyperthermia (40–46 degrees C): cell killing and molecular events. Int J Hyperthermia. 2008;24(1):3–15.
- Jaque D, Martínez Maestro L, del Rosal B, et al. Nanoparticles for photothermal therapies. Nanoscale. 2014;6(16):9494–9530.
- Krawczyk PM, Eppink B, Essers J, et al. Mild hyperthermia inhibits homologous recombination, induces BRCA2 degradation, and sensitizes cancer cells to poly (ADP-ribose) polymerase-1 inhibition. Proc Natl Acad Sci USA. 2011;108(24):9851–9856.
- Vujaskovic Z, Song CW. Physiological mechanisms underlying heat-induced radiosensitization. Int J Hyperthermia. 2004;20(2):163–174.
- Behrouzkia Z, Joveini Z, Keshavarzi B, et al. Hyperthermia: how can it be used? Oman Med J. 2016;31(2):89–97.
- Kok HP, Cressman ENK, Ceelen W, et al. Heating technology for malignant tumors: a review. Int J Hyperthermia. 2020;37(1):711–741.
- Chu KF, Dupuy DE. Thermal ablation of tumours: biological mechanisms and advances in therapy. Nat Rev Cancer. 2014;14(3):199–208.
- Ai H, Wu S, Gao H, et al. Temperature distribution analysis of tissue water vaporization during microwave ablation: experiments and simulations. Int J Hyperthermia. 2012;28(7):674–685.
- Zhmakin AI. Heat transfer in vivo: phenomena and models. In: Handbook of thermal science and engineering. Cham: Springer International Publishing, 2018. p. 2333–2379.
- Buck W, Rudtsch S. Thermal properties. In: Czichos H, Saito T, Smith L, editors. Springer handbook of materials measurement methods. Berlin, Heidelberg: Springer Berlin Heidelberg, 2006. p. 399–429.
- Pennes HH. Analysis of tissue and arterial blood temperatures in the resting human forearm. 1948. J Appl Physiol. 85:5–34.
- Mohammadi A, Bianchi L, Asadi S, et al. Measurement of ex vivo liver, brain and pancreas thermal properties as function of temperature. Sensors. 2021;21(12):4236.
- Nesvadba P. A new transient method of the measurement of temperature dependent thermal diffusivity. J Phys D Appl Phys. 1982;15(5):725–738.
- Rodrigues DB, Pereira PJS, Limão-Vieira P, et al. Study of the one dimensional and transient bioheat transfer equation: multi-layer solution development and applications. Int J Heat Mass Transf. 2013;62(1):153–162.
- Andreozzi A, Brunese L, Iasiello M, et al. Modeling heat transfer in tumors: a review of thermal therapies. Ann Biomed Eng. 2019;47(3):676–693.
- Nguyen TH, Park S, Hlaing KK, et al. Temperature feedback-controlled photothermal treatment with diffusing applicator: theoretical and experimental evaluations. Biomed Opt Express. 2016;7(5):1932.
- Bianchi L, Korganbayev S, Orrico A, et al. Quasi-distributed fiber optic sensor-based control system for interstitial laser ablation of tissue: theoretical and experimental investigations. Biomed Opt Express. 2021;12(5):2841–2858.
- Abraham JP, Sparrow EM. A thermal-ablation bioheat model including liquid-to-vapor phase change, pressure- and necrosis-dependent perfusion, and moisture-dependent properties. Int J Heat Mass Transf. 2007;50(13–14):2537–2544.
- Yang D, Converse MC, Mahvi DM, et al. Expanding the bioheat equation to include tissue internal water evaporation during heating. IEEE Trans Biomed Eng. 2007;54(8):1382–1388.
- Ferrás LL, Ford NJ, Morgado ML, et al. Fractional pennes’ bioheat equation: theoretical and numerical studies. Fract Calc Appl Anal. 2015;18(4):1080–1106.
- Mohammadi A, Bianchi L, Korganbayev S, et al. Thermomechanical modeling of laser ablation therapy of tumors: sensitivity analysis and optimization of influential variables. IEEE Trans Biomed Eng. 2022;69:302–313.
- Lopresto V, Pinto R, Farina L, et al. Microwave thermal ablation: effects of tissue properties variations on predictive models for treatment planning. Med Eng Phys. 2017;46:63–70.
- dos Santos I, Haemmerich D, Schutt D, et al. Probabilistic finite element analysis of radiofrequency liver ablation using the unscented transform. Phys Med Biol. 2009;54(3):627–640.
- Lobo SM, Liu Z-J, Yu NC, et al. RF tumour ablation: computer simulation and mathematical modelling of the effects of electrical and thermal conductivity. Int J Hyperth. 2005;21(3):199–213.
- Prasad B, Kim S, Cho W, et al. Effect of tumor properties on energy absorption, temperature mapping, and thermal dose in 13.56-MHz radiofrequency hyperthermia. J Therm Biol. 2018;74(January):281–289.
- Kashcooli M, Salimpour MR, Shirani E. Heat transfer analysis of skin during thermal therapy using thermal wave equation. J Therm Biol. 2017;64:7–18.
- Ezzat MA. Analytical study of two-dimensional thermo-mechanical responses of viscoelastic skin tissue with temperature-dependent thermal conductivity and rheological properties. Mech Based Des Struct Mach. 2021. doi: 10.1080/15397734.2021.1907757
- Pérez JJ, González-Suárez A, Berjano E. Numerical analysis of thermal impact of intramyocardial capillary blood flow during radiofrequency cardiac ablation. Int J Hyperth. 2018;34(3):243–249.
- Consiglieri L, dos Santos I, Haemmerich D. Theoretical analysis of the heat convection coefficient in large vessels and the significance for thermal ablative therapies. Phys Med Biol. 2003;48(24):4125–4134.
- Paul A, Narasimhan A, Kahlen FJ, et al. Temperature evolution in tissues embedded with large blood vessels during photo-thermal heating. J Therm Biol. 2014;41(1):77–87.
- Pillai K, Akhter J, Chua TC, et al. Heat sink effect on tumor ablation characteristics as observed in monopolar radiofrequency, bipolar radiofrequency, and microwave, using ex vivo calf liver model. Medicine (Baltimore). 2015;94(9):e580.
- Huang H-W. Influence of blood vessel on the thermal lesion formation during radiofrequency ablation for liver tumors. Med Phys. 2013;40(7):073303.
- Yu NC, Raman SS, Kim YJ, et al. Microwave liver ablation: influence of hepatic vein size on heat-sink effect in a porcine model. J Vasc Interv Radiol. 2008;19(7):1087–1092.
- De Vita E, De Landro M, Massaroni C, et al. Fiber optic sensors-based thermal analysis of perfusion-mediated tissue cooling in liver undergoing laser ablation. IEEE Trans Biomed Eng. 2021;68(3):1066–1073.
- Dřždǎl T, Togni P, Víšek L, et al. Comparison of constant and temperature dependent blood perfusion in temperature prediction for superficial hyperthermia. Radioengineering. 2010;19(2):281–289.
- Bosque JJ, Calvo GF, Pérez-García VM, et al. The interplay of blood flow and temperature in regional hyperthermia: a mathematical approach. R Soc Open Sci. 2021;8(1):201234.
- Tompkinsn DT, Vanderby R, Klein SA, et al. Temperature-dependent versus constant-rate blood perfusion modelling in ferromagnetic thermoseed hyperthermia: results with a model of the human prostate. Int J Hyperth. 1994;10(4):517–536.
- Schutt DJ, Haemmerich D. Effects of variation in perfusion rates and of perfusion models in computational models of radio frequency tumor ablation. Med Phys. 2008;35(8):3462–3470.
- Iljaž J, Wrobel LC, Hriberšek M, et al. Numerical modelling of skin tumour tissue with temperature-dependent properties for dynamic thermography. Comput Biol Med. 2019;112:103367.
- He Y, Shirazaki M, Liu H, et al. A numerical coupling model to analyze the blood flow, temperature, and oxygen transport in human breast tumor under laser irradiation. Comput Biol Med. 2006;36(12):1336–1350.
- Wang YZ, Li MJ, Liu D. Asymptotic analysis of transient heating on the triple-layered skin tissue with temperature dependent blood perfusion rate. Waves Random Complex Medium. 2021;doi: 10.1080/17455030.2021.1939193.
- Nadobny J, Lim A, Seifert G, et al. Improved patient-specific hyperthermia planning based on parametrized electromagnetic and thermal models for the SIGMA-30 applicator. Int J Hyperth. 2021;38(1):663–678.
- Ludin F, Yahud S. Model of hyperthermia therapy in melanoma treatment: comparison between constant and temperature dependent blood perfusion rate. J Telecommun Electron Comput Eng. 2018;10(1–17):51–55.
- Rossmann C, Garrett-Mayer E, Rattay F, et al. Dynamics of tissue shrinkage during ablative temperature exposures. Physiol Meas. 2014;35(1):55–67.
- Brace CL, Diaz TA, Hinshaw JL, et al. Tissue contraction caused by radiofrequency and microwave ablation: a laboratory study in liver and lung. J Vasc Interv Radiol. 2010;21(8):1280–1286.
- Bharat S, Techavipoo U, Kiss MZ, et al. Monitoring stiffness changes in lesions after radiofrequency ablation at different temperatures and durations of ablation. Ultrasound Med Biol. 2005;31(3):415–422.
- Sommer CM, Sommer SA, Mokry T, et al. Quantification of tissue shrinkage and dehydration caused by microwave ablation: experimental study in kidneys for the estimation of effective coagulation volume. J Vasc Interv Radiol. 2013;24(8):1241–1248.
- Wex C, Arndt S, Brandstädter K, et al. Biomechanical characterization of material properties of porcine liver after thermal treatment. Soft Mater. 2014;12(4):411–419.
- Liu D, Brace CL. CT imaging during microwave ablation: analysis of spatial and temporal tissue contraction. Med Phys. 2014;41(11):113303.
- Farina L, Weiss N, Nissenbaum Y, et al. Characterisation of tissue shrinkage during microwave thermal ablation. Int J Hyperth. 2014;30(7):419–428.
- Ganguli S, Brennan DD, Faintuch S, et al. Immediate renal tumor involution after radiofrequency thermal ablation. J Vasc Interv Radiol. 2008;19(3):412–418.
- Moreland AJ, Ziemlewicz TJ, Best SL, et al. High-powered microwave ablation of T1a renal cell carcinoma: safety and initial clinical evaluation. J Endourol. 2014;28(9):1046–1052.
- Ziemlewicz TJ, Wells SA, Lubner MA, et al. Microwave ablation of giant hepatic cavernous hemangiomas. Cardiovasc Intervent Radiol. 2014;37(5):1299–1305.
- Lubner MG, Brace CL, Hinshaw JL, et al. Microwave tumor ablation: mechanism of action, clinical results, and devices. J Vasc Interv Radiol. 2010;21(8):S192–S203.
- Merkle EM, Nour SG, Lewin JS. MR imaging follow-up after percutaneous radiofrequency ablation of renal cell carcinoma: findings in 18 patients during first 6 months. Radiology. 2005;235(3):1065–1071.
- Lee JK, Siripongsakun S, Bahrami S, et al. Microwave ablation of liver tumors: degree of tissue contraction as compared to RF ablation. Abdom Radiol. 2016;41(4):659–666.
- Lopresto V, Strigari L, Farina L, et al. CT-based investigation of the contraction of ex vivo tissue undergoing microwave thermal ablation. Phys Med Biol. 2018;63(5):055019.
- Farina L, Nissenbaum Y, Cavagnaro M, et al. Tissue shrinkage in microwave thermal ablation: comparison of three commercial devices. Int J Hyperth. 2018;34(4):382–391.
- Amabile C, Farina L, Lopresto V, et al. Tissue shrinkage in microwave ablation of liver: an ex vivo predictive model. Int J Hyperth. 2017;33(1):101–109.
- Natarajan S, Raman S, Priester AM, et al. Focal laser ablation of prostate cancer: phase I clinical trial. J. Urol. 2016;196(1):68–75.
- Shahmirzadi D, Hou GY, Chen J, et al. Ex vivo characterization of canine liver tissue viscoelasticity after high-intensity focused ultrasound ablation. Ultrasound Med Biol. 2014;40(2):341–350.
- Saccomandi P, Schena E, Pacella CM. New horizons for laser ablation: nanomedicine, thermometry, and hyperthermal treatment planning tools. In Image-guided laser ablation. Cham: Springer International Publishing; 2020. p. 145–151.
- Sapin-de Brosses E, Gennisson J-L, Pernot M, et al. Temperature dependence of the shear modulus of soft tissues assessed by ultrasound. Phys Med Biol. 2010;55(6):1701–1718.
- Wex C, Stoll A, Fröhlich M, et al. Mechanics of fresh, frozen-thawed and heated porcine liver tissue. Int J Hyperth. 2014;30(4):271–283.
- Wongchadakul P, Rattanadecho P, Wessapan T. Implementation of a thermomechanical model to simulate laser heating in shrinkage tissue (effects of wavelength, laser irradiationI intensity, and irradiation beam area). Int J Therm Sci. 2018;134:321–336.
- Karaki W, Rahul CA, Lopez D-A, Borca-Tasciuc , et al. A continuum thermomechanical model of in vivo electrosurgical heating of hydrated soft biological tissues. Int J Heat Mass Transf. 2018;127:961–974.
- Singh S, Melnik R. Coupled thermo-electro-mechanical models for thermal ablation of biological tissues and heat relaxation time effects. Phys Med Biol. 2019;64(24):245008.
- Keangin P, Wessapan T, Rattanadecho P. Analysis of heat transfer in deformed liver cancer modeling treated using a microwave coaxial antenna. Appl Therm Eng. 2011;31(16):3243–3254.
- Park CS, Liu C, Hall SK, et al. A thermoelastic deformation model of tissue contraction during thermal ablation. Int J Hyperth. 2018;34(3):221–228.
- Li X, Zhong Y, Jazar R, et al. Thermal-mechanical deformation modelling of soft tissues for thermal ablation. Biomed Mater Eng. 2014;24(6):2299–2310.
- Valvano JW, Cochran JR, Diller KR. Thermal conductivity and diffusivity of biomaterials measured with self-heated thermistors. Int J Thermophys. 1985;6(3):301–311.
- Bhavaraju NC, Valvano JW. Thermophysical properties of swine myocardium. Int J Thermophys. 1999;20:665–676.
- Giering K, Lamprecht I, Minet O, et al. Determination of the specific heat capacity of healthy and tumorous human tissue. Thermochim Acta. 1995;251:199–205.
- Chernyadiev SA, Aretinsky VB, Sivkova NI, et al. A calorimetric study of baker’s cyst biological tissues. Biophysics. 2018;63(6):989–993.
- Lopresto V, Argentieri A, Pinto R, et al. Temperature dependence of thermal properties of ex vivo liver tissue up to ablative temperatures. Phys Med Biol. 2019;64(10):105016.
- Silva NP, Bottiglieri A, Conceição RC, et al. Characterisation of ex vivo liver thermal properties for electromagnetic-based hyperthermic therapies. Sensors. 2020;20(10):3004.
- Guntur SR, Lee KI, Paeng D-G, et al. Temperature-dependent thermal properties of ex vivo liver undergoing thermal ablation. Ultrasound Med Biol. 2013;39(10):1771–1784.
- Abramowitz M, Stegun IA, Romer RH. Handbook of mathematical functions with formulas, graphs, and mathematical tables. Am J Phys. 1988;56(10):958–958.
- Silva NP, Bottiglieri A, Porter E, et al. Evaluation of thermal properties of ex vivo kidney up to ablative temperatures. IFMBE Proc. 2021;80:537–543.
- Hayes LJ, Valvano JW. Steady-state analysis of self-heated thermistors using finite elements. J Biomech Eng. 1985;107(1):77–80.
- Valvano JW, Allen JT, Bowman HF. The simultaneous measurement of thermal conductivity, thermal diffusivity, and perfusion in small volumes of tissue. J Biomech Eng. 1984;106(3):192–197.
- Gill P, Moghadam TT, Ranjbar B. Differential scanning calorimetry techniques: applications in biology and nanoscience. J Biomol Tech. 2010;21(4):167–193.
- Clas S-D, Dalton CR, Hancock BC. Differential scanning calorimetry: applications in drug development. Pharm Sci Technol Today. 1999;2(8):311–320.
- Haines PJ, Reading M, Wilburn FW. Chapter 5 - differential thermal analysis and differential scanning calorimetry. In: Brown C, editor. Principles and practice. Vol. 1. Amsterdam: Elsevier Science B.V. 1998. p. 279–361.
- Danley RL. New heat flux DSC measurement technique. Thermochimica Acta. 2002;395(1–2):201–208.
- Ackermann T. Book review: calorimetry. Fundamentals and practice. By W. Hemminger and G. Höhne. Angew Chemie Int Ed English. 1986;25(5):482–483.
- Peng Y-Y, Dussan DD, Narain R. Thermal, mechanical, and electrical properties. In: Polymer science and nanotechnology. Amsterdam, Netherlands: Elsevier, 2020. p. 179–201.
- Menard KP, Menard NR. An introduction to dynamic mechanical analysis. In: Dynamic mechanical analysis. Boca Raton; 2020. p. 1–18.
- Kiss MZ, Daniels MJ, Varghese T. Investigation of temperature-dependent viscoelastic properties of thermal lesions in ex vivo animal liver tissue. J Biomech. 2009;42(8):959–966.
- Ayyildiz M, Aktas RG, Basdogan C. Effect of solution and post-mortem time on mechanical and histological properties of liver during cold preservation. Biorheology. 2014;51(1):47–70.
- Liu Y-L, Li GY, He P, et al. Temperature-dependent elastic properties of brain tissues measured with the shear wave elastography method. J Mech Behav Biomed Mater. 2017;65:652–656.
- Gu B, Burgess DJ. Polymeric materials in drug delivery. In: Kumbar SG, Laurencin CT, Deng M, editors. Natural and synthetic biomedical polymers. Burlington, MA: Elsevier; 2014. p. 333–349.
- Dyamenahalli K, Famili A, Shandas R. Characterization of shape-memory polymers for biomedical applications. In: Yahia BA, editor. Shape memory polymers for biomedical applications. Sawston, Cambridge: Woodhead Publishing; 2015. p. 35–63.
- Menard KP, Menard N. Dynamic mechanical analysis. In: Encyclopedia of analytical chemistry. Chichester (UK): John Wiley & Sons, Ltd; 2017. p. 1–25.
- Akil H, Zamri MH. Performance of natural fiber composites under dynamic loading. In: Hodzic A, Shanks R, editors. Natural fibre composites. Sawston, Cambridge: Woodhead Publishing; 2014. p. 323–344.
- Ahmed J. Rheology and rheological measurements. In: Kirk‐Othmer encyclopedia of chemical technology. Wiley; 2021. p. 1–70.
- Morrison FA. Understanding rheology. Vol. 1, no. 3.1. New York: Oxford University Press; 2001.
- Kröger M, Vermant J. The structure and rheology of complex fluids. Appl Rheol. 2000;10(3):110–111.
- Weitz DA, Wyss HM, Larsen RJ. Oscillatory rheology measuring the viscoelastic behaviour of soft materials. GIT Lab J Eur. 2007;11(3–4):68–70.
- Laun M, Auhl D, Brummer R, et al. Guidelines for checking performance and verifying accuracy of rotational rheometers: viscosity measurements in steady and oscillatory shear (IUPAC technical report). Pure Appl Chem. 2014;86(12):1945–1968.
- Vedadghavami A, Minooei F, Mohammadi MH, et al. Manufacturing of hydrogel biomaterials with controlled mechanical properties for tissue engineering applications. Acta Biomater. 2017;62:42–63.
- Hoskins P. Principles of ultrasound elastography. Ultrasound. 2012;20(1):8–15.
- Gennisson J-L, Deffieux T, Fink M, et al. Ultrasound elastography: principles and techniques. Diagn Interv Imaging. 2013;94(5):487–495.
- Zelenov ES. Experimental investigation of the thermophysical properties of compact bone. Mech Compos Mater. 1986;21(6):759–762.
- Fajardo JE, Carlevaro CM, Vericat F, et al. Effect of the trabecular bone microstructure on measuring its thermal conductivity: a computer modeling-based study. J. Therm. Biol. 2018;77(789):131–136.
- Choi J, Morrissey M, Bischof JC. Thermal processing of biological tissue at high temperatures: impact of protein denaturation and water loss on the thermal properties of human and porcine liver in the range 25–80 °C. J Heat Transfer. 2013;135(6):1–8.
- Watanabe H, Kobayashi Y, Hashizume M, et al. Modeling the temperature dependence of thermophysical properties: study on the effect of temperature dependence for RFA. Annu Int Conf IEEE Eng Med Biol Soc. 2009;2009:5100–5105.
- Watanabe H, Yamazaki N, Isobe Y, et al. Validation of accuracy of liver model with temperature-dependent thermal conductivity by comparing the simulation and in vitro RF ablation experiment. Annu Int Conf IEEE Eng Med Biol Soc. 2012;2012:5712–5717.
- Bhattacharya A, Mahajan RL. Temperature dependence of thermal conductivity of biological tissues. Physiol Meas. 2003;24(3):769–783.
- Youn J-I, Telenkov SA, Kim E, et al. Optical and thermal properties of nasal septal cartilage. Lasers Surg Med. 2000;27(2):119–128.
- Sano F, Washio T, Matsumae M. Measurements of specific heat capacities required to build computer simulation models for laser thermotherapy of brain lesions. Tokai J Exp Clin Med. 2019;44(4):80–84.
- Haemmerich D, dos Santos I, Schutt DJ, et al. In vitro measurements of temperature-dependent specific heat of liver tissue. Med. Eng. Phys. 2006;28(2):194–197.
- Agafonkina IV, Belozerov AG, Vasilyev AO, et al. Thermal properties of human soft tissue and its equivalents in a wide low-temperature range. J Eng Phys Thermophy. 2021;94(1):233–246.
- Protsenko DE, Zemek A, Wong BJF. Temperature dependent change in equilibrium elastic modulus after thermally induced stress relaxation in porcine septal cartilage. Lasers Surg Med. 2008;40(3):202–210.
- Liu CH, Skryabina MN, Li J, et al. Measurement of the temperature dependence of Young’s modulus of cartilage by phase-sensitive optical coherence elastography. Quantum Electron. 2014;44(8):751–756.
- Bonfield W, Li CH. The temperature dependence of the deformation of bone. J Biomech. 1968;1(4):323–329.
- Chae Y, Aguilar G, Lavernia EJ, et al. Characterization of temperature dependent mechanical behavior of cartilage. Lasers Surg Med. 2003;32(4):271–278.
- Xu F, Seffen KA, Lu TJ. Temperature-dependent mechanical behaviors of skin tissue. IAENG Int J Comput Sci. 2008;35:1.
- Bass CR, Planchak CJ, Salzar RS, et al. The temperature-dependent viscoelasticity of porcine lumbar spine ligaments. Spine (Phila. Pa. 1976). 2007;32(16):436–442.
- Baumgart F. Stiffness - an unknown world of mechanical science? Injury. 2000;31(2):14–23.
- Robinson RA. An electron-microscopic study of the crystalline inorganic component of bone and its relationship to the organic matrix. JBJS. 1952;34(2):389–435.
- Guimarães CF, Gasperini L, Marques AP, et al. The stiffness of living tissues and its implications for tissue engineering. Nat Rev Mater. 2020;5(5):351–370.
- Song CW, Park HJ, Lee CK, et al. Implications of increased tumor blood flow and oxygenation caused by mild temperature hyperthermia in tumor treatment. Int J Hyperth. 2005;21(8):761–767.
- Schön MR, Kollmar O, Wolf S, et al. Liver transplantation after organ preservation with normothermic extracorporeal perfusion. Ann Surg. 2001;233(1):114–123.
- Mitchell JW, Galvez TL, Hengle J, et al. Thermal response of human legs during cooling. J Appl Physiol. 1970;29(6):859–865.
- Streffer C. Review: metabolic changes during and after hyperthermia. Int J Hyperth. 1985;1(4):305–319.
- Schubert B, Streffer C, Tamulevicius P. Glucose metabolism in mice during and after whole-body hyperthermia 1, 2. In: Third International Symposium, Cancer Therapy by Hyperthermia, Drugs, and Radiation: A Symposium Held at Colorado State University, Fort Collins, CO, 1980 June 22–26; Sponsored by the National Cancer Institute…[et Al.], 1982. Vol. 61, no. 82, p. 203–205.
- Copen WA, Lev MH, Rapalino O. Brain perfusion: computed tomography and magnetic resonance techniques. In: Masdeu JC, Gilberto González R, editors. Neuroimaging part I. Vol. 135. Amsterdam, Netherlands: Elsevier; 2016. p. 117–135.
- Fantini S, Sassaroli A, Tgavalekos KT, et al. Cerebral blood flow and autoregulation: current measurement techniques and prospects for noninvasive optical methods. Neurophoton. 2016;3(3):031411.
- Hristov J. Bio-heat models revisited: concepts, derivations, nondimensalization and fractionalization approaches. Front Phys. 2019;7:189.
- Liu TT. Perfusion imaging with arterial spin labeling MRI. In: A Toga, editor. Brain mapping. Waltham: Elsevier; 2015. p. 149–154.
- Xu LX, Zhu L, Holmes KR. Thermoregulation in the canine prostate during transurethral microwave hyperthermia, part II: blood flow response. Int J Hyperth. 1998;14(1):65–73.
- Akyürekli D, Gerig LH, Raaphorst GP. Changes in muscle blood flow distribution during hyperthermia. Int J Hyperth. 1997;13(5):481–496.
- Song CW, Lokshina A, Rhee JG, et al. Implication of blood flow in hyperthermic treatment of tumors. IEEE Trans Biomed Eng. 1984;BME-31(1):9–16.
- Song CW, Rhee JG, Levitt SH. Blood flow in normal tissues and tumors during hyperthermia. J Natl Cancer Inst. 1980;64(1):119–124.
- Song CW, Kang MS, Rhee JG, et al. Effect of hyperthermia on vascular function in normal and neoplastic tissues. Ann NY Acad Sci. 1980;335:35–47.
- Song CW, Kang MS, Rhee JG, et al. The effect of hyperthermia on vascular function, pH, and cell survival. Radiology. 1980;137(3):795–803.
- Song CW. Physiological factors in hyperthermia. Natl Cancer Inst Monogr. 1982;61:169–176.
- Song CW. Effect of hyperthermia on vascular functions of normal tissues and experimental tumors: brief communication. JNCI J Natl Cancer Inst. 1978;60(3):711–713.
- Sekins KM, Lehmann JF, Esselman P, et al. Local muscle blood flow and temperature responses to 915MHz diathermy as simultaneously measured and numerically predicted. Arch Phys Med Rehabil. 1984;65(1):1–7.
- Eddy HA. Alterations in tumor microvasculature during hyperthermia. Radiology. 1980;137(2):515–521.
- Shrivastav S, Kaelin WG, Joines WT, et al. Microwave hyperthermia and its effect on tumor blood flow in rats. Cancer Res. 1983;43(10):4665–4669.
- Lagendijk JJW, Hofman P, Schipper J. Perfusion analyses in advanced breast carcinoma during hyperthermia. Int J Hyperth. 1988;4(5):479–495.
- Waterman FM, Tupchong L, Nerlinger RE, et al. Blood flow in human tumors during local hyperthermia. Int J Radiat Oncol. 1991;20(6):1255–1262.
- Brown SL, Hunt JW, Hill RP. Differential thermal sensitivity of tumour and normal tissue microvascular response during hyperthermia. Int J Hyperth. 1992;8(4):501–514.
- Lyons BE, Samulski TV, Cox RS, et al. Heat loss and blood flow during hyperthermia in normal canine brain I: empirical study and analysis. Int J Hyperth. 1989;5(2):225–247.
- Van Vulpen M, Raaymakers BW, de Leeuw AAC, et al. Prostate perfusion in patients with locally advanced prostate carcinoma treated with different hyperthermia techniques. J Urol 2002;168(4 Part 1):1597–1602.
- Song CW. Effect of local hyperthermia on blood flow and microenvironment: a review. Cancer Res. 1984;44(10):4721s–4730s.
- Rahib L, Smith BD, Aizenberg R, et al. Projecting cancer incidence and deaths to 2030: the unexpected burden of thyroid, liver, and pancreas cancers in the United States. Cancer Res. 2014;74(11):2913–2921.
- Sung H, Ferlay J, Siegel RL, et al. Global cancer statistics 2020: GLOBOCAN estimates of incidence and mortality worldwide for 36 cancers in 185 countries. CA Cancer J Clin. 2021;71:209–249.
- Haemmerich D, Chachati L, Wright AS, et al. Hepatic radiofrequency ablation with internally cooled probes: effect of coolant temperature on lesion size. IEEE Trans Biomed Eng. 2003;50(4):493–500.
- Liu B, Huang G, Xie X, et al. Feasibility and outcomes of percutaneous radiofrequency ablation for intrahepatic recurrent hepatocellular carcinoma after liver transplantation: a single-center experience. Int J Hyperth. 2020;37(1):1202–1209.
- Arnal B, Pernot M, Tanter M. Monitoring of thermal therapy based on shear modulus changes: I. Shear wave thermometry. IEEE Trans Ultrason Ferroelectr Freq Control. 2011;58(2):369–378.
- Wex C, Stoll A, Fröhlich M, et al. How preservation time changes the linear viscoelastic properties of porcine liver. Biorheology. 2013;50(3–4):115–131.