
 ?Mathematical formulae have been encoded as MathML and are displayed in this HTML version using MathJax in order to improve their display. Uncheck the box to turn MathJax off. This feature requires Javascript. Click on a formula to zoom.
Abstract
Background
Hyperthermia treatment planning is increasingly used in clinical applications and recommended in quality assurance guidelines. Assistance in phase-amplitude steering during treatment requires dedicated software for on-line visualization of SAR/temperature distributions and fast re-optimization in response to hot spots. As such software tools are not yet commercially available, we developed Adapt2Heat for on-line adaptive hyperthermia treatment planning and illustrate possible application by different relevant real patient examples.
Methods
Adapt2Heat was developed as a separate module of the treatment planning software Plan2Heat. Adapt2Heat runs on a Linux operating system and was developed in C++, using the open source Qt, Qwt and VTK libraries. A graphical user interface allows interactive and flexible on-line use of hyperthermia treatment planning. Predicted SAR/temperature distributions and statistics for selected phase-amplitude settings can be visualized instantly and settings can be re-optimized manually or automatically in response to hot spots.
Results
Pretreatment planning E-Field, SAR and temperature calculations are performed with Plan2Heat and imported in Adapt2Heat. Examples show that Adapt2Heat can be helpful in assisting with phase-amplitude steering, e.g., by suppressing indicated hot spots. The effects of phase-amplitude adjustments on the tumor and potential hot spot locations are comprehensively visualized, allowing intuitive and flexible assistance by treatment planning during locoregional hyperthermia treatments.
Conclusion
Adapt2Heat provides an intuitive and flexible treatment planning tool for on-line treatment planning-assisted hyperthermia. Extensive features for visualization and (re-)optimization during treatment allow practical use in many locoregional hyperthermia applications. This type of tools are indispensable for enhancing the quality of hyperthermia treatment delivery.
1. Introduction
Locoregional hyperthermia applies elevated temperatures between 40 and 44 °C for 1 h to deep-seated malignancies, such as cervical, bladder and rectum tumors. Several randomized trials have demonstrated hyperthermia to be very effective in enhancing the anti-tumor effect of radiotherapy and chemotherapy [Citation1–3]. Hyperthermia typically increases the response rate by about 15–20%, without significantly increasing the incidence of normal tissue toxicity [Citation4]. Phased-array systems are regularly used to administer locoregional hyperthermia. These devices consist of multiple radio-frequent antennas organized in one or more rings around the patient, typically operating at a frequency between 60 and 120 MHz [Citation5,Citation6]. Commercially available phased-array systems are the BSD-2000 systems (Pyrexar Medical, Salt Lake City, USA) and the ALBA-4D system (Med-Logix, Rome, Italy) [Citation7–9]. The phases and amplitudes of the antennas determine the interference pattern created by the electromagnetic fields, so heating can be focused to the target region by adequate phase-amplitude selection. However, at the same time, excessive heating of normal tissue (i.e., hot spots) should be avoided.
To ensure that temperature levels in the therapeutic range are achieved, thermometry-guided treatments are essential, as specified in the quality assurance guidelines [Citation10]. Standard clinical thermometry feedback is based on (minimally invasive) thermometry probes that continuously monitor the target temperature. Noninvasive MR-thermometry is an elegant method to realize reference-based 3D temperature maps in near-real time. However, MR-thermometry can currently be applied with reasonable accuracy for a limited number of tumor sites only (e.g., soft tissue sarcoma) [Citation11,Citation12]. Reliability in the pelvic region is still significantly affected by organ movement and blood flow [Citation13]. Thus, full 3D temperature information during treatment is lacking, and hot spots are indicated by the patient when a pain sensation occurs, typically at temperature levels exceeding 44–45 °C [Citation14]. When the patient communicates a hot spot, phase-amplitude settings are adjusted to resolve the pain complaint and avoid thermal damage. Currently, these on-line adaptations are mainly based on the experience of the operators and empirical steering protocols. When reducing the temperature at the hot spot location, it is important to maintain adequate therapeutic heating of the tumor region, because of the thermal-dose effect relationship [Citation15,Citation16]. Maintaining adequate tumor heating can be a challenging task; the number of independent antennas in modern locoregional heating systems yield adequate steering possibilities, but this also makes the optimization problem complex because of the large number of degrees of freedom.
Hyperthermia treatment planning is used to simulate SAR and/or temperature distributions in the patient in order to visualize the effect of different treatment options or steering strategies [Citation17–20]. Treatment planning is thus a very useful instrument to assist in clinical decision-making and optimize SAR and temperature distributions during clinical hyperthermia [Citation21–27]. Inverse pretreatment planning, as applied in radiotherapy, does not prevent the incidence of hot spots during hyperthermia treatment. Because of the uncertainties caused by the lack of patient-specific tissue properties and local blood perfusion, the exact temperature level at potential hot spot locations is difficult to predict [Citation28,Citation29]. Nevertheless, treatment planning is qualitatively reliable, i.e., heating patterns can be correctly predicted, including potential hot spot locations, even when the predicted absolute temperature levels are less reliable [Citation30,Citation31]. Simulated and measured changes in heating patterns after phase-amplitude steering correlate [Citation30,Citation31], which makes adaptive treatment planning during treatment possible.
Adaptive treatment planning can thus be used on-line to suppress hot spots while maintaining the same level of tumor heating, or even aiming to improve tumor temperatures without inducing hot spots. First feasibility studies showed promising results for on-line use of adaptive treatment planning to assist in phase-amplitude steering [Citation32–35]. Thus, further development and clinical implementation of on-line adaptive treatment planning is worthwhile.
A clinical on-line treatment planning tool should in our view not be a ‘black box’ prescribing the (re-)optimized system settings, but rather a flexible interactive software tool for planning-assisted hyperthermia delivery. Effective on-line use of treatment planning requires software tools for instant visualization of SAR and temperature distributions corresponding to user-selected phase-amplitude settings and fast optimization of the phase-amplitude settings and re-optimization in response to hot spot complaints. Such dedicated software tools are not yet commercially available and need to be developed. This paper describes Adapt2Heat, an extension of the software package Plan2Heat [Citation36], as developed at the Amsterdam University Medical Centers (AUMC) for on-line use of hyperthermia treatment planning. Adapt2Heat and its functionality are described and the possible application is illustrated by different relevant real patient examples.
2. Methods
2.1. Program design and requirements
Standard treatment guidance in clinical hyperthermia is based on on-line thermometry probe information and patient feedback on tolerance and hot spots. Main requirements on software for planning-assisted hyperthermia delivery are
Manual selection and adjustment of phase-amplitude settings, followed by instant visualization of the corresponding predicted SAR/temperature distributions projected onto the patient’s CT scan. Axial, sagittal and coronal slice selection, zooming and color scaling should allow flexible visualization of the 3D distribution.
Visualization of predicted target SAR/temperature statistics and SAR/temperature values along the thermometry probes, as well as at user-specified normal tissue locations.
Tracking of the history in power, phase-amplitude settings and their effect on SAR/temperature statistics and thermometry probe values.
Initial phase-optimization to focus heating to the target location.
Re-optimization of phase-amplitude settings in response to hot spots, with user-friendly hot-spot selection.
2.2. Workflow and pretreatment planning
The workflow is visualized in . Adapt2Heat imports pre-calculated treatment planning data (i.e., SAR and temperature) for on-line adaptive planning and visualization, e.g., from Plan2Heat. These imported treatment planning data are based on patient-specific imaging. The following description of the workflow is based on pretreatment planning using Plan2Heat. Workflow for other packages would be quite similar. A CT scan is made in the treatment position (on a water bolus and mattresses) and with the thermometry probes in situ. The tumor target region is delineated by the physician. Tissue segmentation is performed based on CT Hounsfield Units, which can distinguish muscle-like and fatty tissue, bone and air/lungs [Citation37]. In this process, the thermometry probes are segmented as bone, which is corrected manually, as well as other artifacts, if present. The segmented anatomy is downscaled to simulation resolution; for locoregional heating typically 2.5 × 2.5 × 2.5 mm3. This anatomy is then combined with the applicator model and literature-based tissue properties are assigned. Electromagnetic fields are calculated for each antenna separately (unit amplitude and zero phase), using the Finite Difference Time Domain (FDTD) method with perfectly matched layer (PML) boundary conditions [Citation38,Citation39].
Figure 1. Schematic representation of the workflow of Adapt2Heat, using Plan2Heat for pretreatment planning and preparation. In the pretreatment planning phase a CT scan of the patient is segmented and E-fields are calculated using Plan2Heat. In the preparation and conversion phase, the matrix elements are pre-computed (Equations (1,2)), and the coordinates of the thermometry sensors are specified, as well as the potential hot spot locations. Required volume and geometrical input files for Adapt2Heat are converted to VTK and GOF, respectively and Adapt2Heat uses an XML configuration file, specifying the planning input data and basic patient information, as name, date of birth, etc.
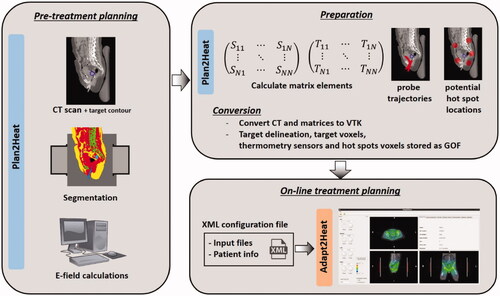
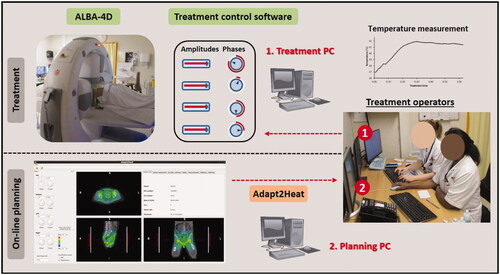
Figure 2. Situation during a hyperthermia treatment, where Adapt2Heat is used as an assistance tool. There is no direct connection between Adapt2Heat and the treatment control software, which avoids any risk of inadvertently affecting the actual treatment when using the treatment planning. The operators remain responsible for changing the system settings via the treatment control software.
For instant on-line visualization of SAR and temperature predictions, superposition is applied such that the SAR and steady-state temperature distributions are calculated by a vector-matrix-vector multiplication. The SAR at voxel (x,y,z) is calculated as:
(1)
(1)
where v is the feed vector containing the amplitudes and phases and S is a complex N × N Hermitian matrix (N: # antennas);
is the complex conjugate of v. Similarly, the temperature at voxel (x,y,z) is calculated as:
(2)
(2)
where T is a complex N × N Hermitian matrix and T00 is a constant representing the thermal boundary conditions. Temperature calculations are based on the Pennes bio heat equation, in which perfusion is accounted for by a heat-sink term [Citation40], but similar efficient superposition is possible in case one would consider implementing more advanced thermal modeling by inclusion of discrete vasculature [Citation41,Citation42]. Since these matrix elements in EquationEquations (1) and (2) can be pre-calculated based on the electric fields, instant visualization and fast calculations during optimization are possible. The reader is referred to previously published articles on derivation of these matrix elements for more details on this topic [Citation43,Citation44]. In addition to these matrices for SAR and temperature, a total power matrix is pre-calculated, such that the total power in the patient volume can also be calculated efficiently by a similar superposition.
All 3D distributions calculated by Plan2Heat are stored as hierarchical data format (HDF; https://www.hdfgroup.org/). CT data and SAR/temperature matrices are converted to VTK as input for Adapt2Heat. World coordinates of the thermometry sensors along the probe trajectories are specified for each probe (cervix, rectum, bladder) and stored in Generic Object Format (GOF), i.e., an ASCII file used to stream geometrical objects to and from a file or network connection [Citation36,Citation45]. Path tracks of the thermometry probes can be determined manually or using jTracktool; a java tracking tool used in combination with Plan2Heat [Citation36]. Similarly, the delineated target contour and the voxels representing clinical hot spot locations and the target are also stored as GOF. Clinical workflow at the AUMC uses an anatomical picture with 39 possible hot spot locations indicated by numbers. Voxel coordinates of hot spots represent a spherical region with a user-defined diameter. Manual voxel definition is possible but time-consuming. A separate module was added to Plan2Heat to create this input, in which the user can specify six world coordinates representing the center of the spherical region for the hot spot locations at the pubic bone, tail bone, left and right hip, left and right belly. These coordinates are used to reconstruct a spherical hot spot region with a user-specified diameter. Two additional user-defined coordinates represent the center of the upper legs at the end of the water bolus (where fringing fields can occur [Citation46]), which are used in combination with the six hot spots to approximate the other 33 regions by interpolation. If desired, manual correction of individual hot spot locations is possible. For each hot spot location and the target region, the voxel coordinates are stored automatically as GOF for import in Adapt2Heat.
After generation of the necessary input, Adapt2Heat is launched using an XML configuration file, which specifies the input files and general information about the patient. The following entries should be listed in the XML configuration file:
name: The name of the patient.
ZIS: The hospital identification number (called ‘ZIS’ in the Netherlands).
HT: The hyperthermia identification number.
DOB: Date of birth of the patient.
SEX: The sex of the patient (m/f).
physician: The patient’s physician.
site: The tumor site for which the patient is treated.
contours: A GOF file containing the polygons defining the target region, as delineated by the physician.
tracks: A GOF file specifying the thermometry sensor locations along the probe trajectories.
hotSpots: A GOF file specifying per hot spot location which voxels represent this hot spot location.
target: A GOF file defining which voxels correspond to the target region.
kernel: A VTK file with the temperature matrix input for superposition of the steady state temperature as in EquationEquation (2)
(2)
bound: A VTK file representing the T00 constant as in EquationEquation (2)
SARkernel: A VTK file with the SAR matrix input for superposition of the SAR as in EquationEquation (1)
totalPowerKernel: A list of matrix elements to calculate the total power in the patient by a vector-matrix-vector multiplication.
2.3. Functionality
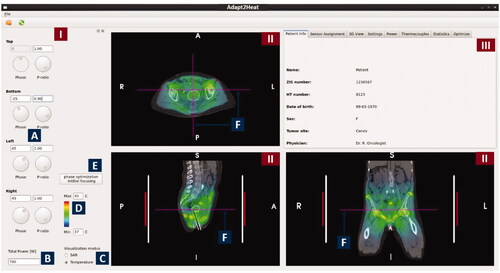
This section describes all currently available functionality in Adapt2Heat to assist the operators during hyperthermia treatments. A screenshot of the user interface is shown in . The user interface consists of a control panel on the left (1), three panels for visualization of the SAR/temperature prediction projected onto the CT scan (2); the white contour indicates the target region. A tabbed window (3), from which a tab with specific functions can be selected, according to the current needs of the operators.
Figure 3. Screenshot of the graphical user interface of Adapt2Heat. A control panel (I) allows for phase-amplitude selection, power adjustment, scaling, switch between SAR and temperature visualization and initial phase optimization (A-E). Predicted distributions are instantly updated and projected onto the CT scan in the visualization windows (II). The selected orthogonal slices are indicated by dotted lines in each cross section (F). In the tabbed window (III), specific functionality can be selected by clicking the individual tabs, as explained in the text.
2.3.1. Control panel
The control panel () provides the operators with functionality for phase-amplitude selection, SAR/temperature visualization, power adjustment, color scaling and initial phase optimization for focusing:
2.3.1.1. Phase-amplitude selection
Phases and amplitudes can be selected manually by changing the phases and power ratios (). Power ratios are used rather than amplitudes, as this is our clinical practice in defining system settings. When adapting the settings, the predicted SAR and temperature distributions are updated instantly. The top waveguide is considered as a reference, which means that its phase is fixed to 0° and editing of this field is disabled. The phases of the other waveguides are defined as phase delays with respect to this reference waveguide.
2.3.1.2. Total power selection
The total power delivered by the heating system can be adjusted in a text box ().
2.3.1.3. SAR/temperature visualization
The operators can instantly switch between SAR and temperature visualization using a radio button ().
2.3.1.4. Color scaling
The color contrast in the distribution can be enhanced or reduced by adjusting the minimum and maximum SAR/temperature level ().
2.3.1.5. Initial phase optimization
According to our treatment protocol, a treatment is started with standard (typically equal) amplitude settings for all waveguides, and phases are selected such that a focus at the tumor is realized. To determine these phases, an E-field probe is used at our institute, positioned at or close to the tumor location. A phase sweep from −180° to 180° is then performed for each individual waveguide combined with the reference waveguide to determine the optimal phase settings, yielding a maximum signal registered by the E-Field probe [Citation47]. This phase-optimization procedure is mimicked numerically when using the button ‘phase optimization initial focusing’ ().
2.3.2. SAR/temperature visualization panels
The panels for visualization of the SAR/temperature prediction projected onto the CT scan (, II) allow the user for slice selection, readout of SAR/temperature values, zooming and distance measurements on the CT scan. The red and white vertical bars next to the patient in the coronal and sagittal cross-sections indicate the length of the patient covered by the waveguides and the water bolus, respectively.
2.3.2.1. Slice selection
Any transversal, coronal and sagittal cross-section can be selected for visualization. This can be done by clicking one of these views to make the window active and step through the volume using + and - buttons. Dotted purple lines () in each view indicate the visualized slice location.
2.3.2.2. SAR/temperature display
When pressing the ‘shift’ button on the keyboard, while moving the mouse over the SAR/temperature distribution, the predicted value at the location of the mouse indicator is displayed next to the mouse indicator (). The value is updated continuously while moving the mouse.
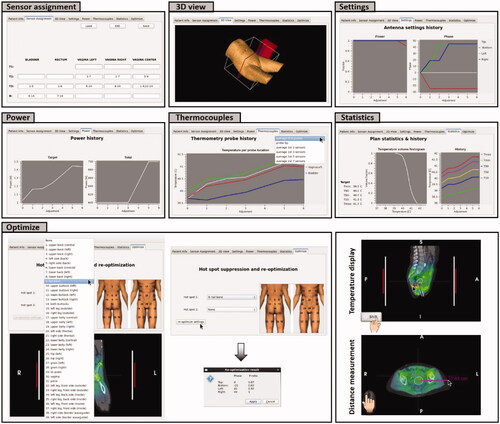
Figure 4. Tabs in the tabbed window of Adapt2Heat with specific functionality: Sensor assignment, 3 D view, Settings, Power, Thermocouples, Statistics and Optimize. The window in the right bottom corner also visualizes temperature display and distance measurement.
2.3.2.3. Distance measurement
The distance between two locations in the patient can be measured by clicking with the left mouse button on the first point, moving to the next point and releasing the mouse button (). The distance between these points is then printed in the window. This can be helpful e.g., in case the operators prefer manual phase selection based on wavelengths; in that case the distance from the tumor to the antennas can be measured. Since the wavelength in muscle tissue at 70 MHz is approximately 50 cm, a rule of thumb is that a 15° phase change induces a focus shift of about 1 cm [Citation7]. It can also be helpful to verify patient positioning, by comparing e.g., the distance between the tumor center and the pubic bone in the planning system and for the treatment during the treatment set-up phase.
2.3.2.4. Zooming
When necessary for a more accurate measurement or visualization, zooming can be performed using the scroll wheel of the mouse, which enlarges the CT – SAR/temperature overlay.
2.3.3. Tabbed window
The tabs in the tabbed window (, III) each provide specific functionality that can be selected when considered helpful during the treatment. The basic tab, also visible in , specifies the general patient information. Other tabs provide a 3D patient view, thermometry sensor assignment, visualization of the power history, predictions along the thermometry probes, statistics (including SAR/temperature volume histogram and SAR/temperature history) and re-optimization to suppress hot spots. A screenshot of all tabs is shown in and their functionality is discussed below.
2.3.3.1. Patient info
This window, as shown in , panel (III), shows the general information of the patient (name, date of birth, hospital number, hyperthermia number, sex, tumor site and physician), as read from the XML configuration file. This information ensures that the correct treatment plan is used, i.e., the plan created for the patient treated at that moment.
2.3.3.2. Sensor assignment
The tab Sensor assignment allows the operators to define which thermometry sensors of the standard cervix, bladder and rectum probes used for pelvic hyperthermia are in the tumor (indicated in our clinical workflow by T1), indicative for the tumor (T2) and which are measuring adjacent normal tissue (T3). Other sensors representing normal tissue temperatures are labeled as border (B). This assignment can be stored as XML file to be imported at the start of the next treatment session and edited when desired using the buttons ‘load’, ‘save’ and ‘edit’ on top of the window. This functionality assists the operators to ensure consistent sensor assignment over the full treatment course, which helps to ensure reliable and consistently reported treatment results in terms of indexed temperatures.
2.3.3.3. 3D View
The tab 3D view shows the position of the 3D outer contour of the patient with respect to the left antenna and an adjustable slicer at the location of the presently visualized transversal slice, to indicate the position of the transversal slice with respect to the antennas. The size of the water bolus is indicated by the white box. This 3D view can be rotated freely.
2.3.3.4. Settings
When selecting the tab Settings, the operators can see a plot of the history in power ratios and phases for the current session of Adapt2Heat.
2.3.3.5. Power
Selecting the tab Power shows the operators the history of the total power, as well as the history of the predicted amount of absorbed power in the target region for the current session of Adapt2Heat. This history in power absorbed in the target helps the operators to focus energy to the tumor.
2.3.3.6. Thermocouples
The tab Thermocouples shows the history of the predicted SAR/temperature along the individual thermometry tracks (cervix, bladder, rectum) for the current session of Adapt2Heat. A drop-down menu on the top right allows the operators to choose between different options for visualization. Default is the average SAR/temperature over the full length of the multi-sensor thermocouple probe (typically 7 or 14 points), but the operators can also choose averaging over the first 2, 3, 5 or 7 sensors or display the tip value. Visualization of this probe trajectory history helps the operators to ensure adequate temperatures and avoid a significant target temperature decrease when adjusting settings in response to hot spots.
2.3.3.7. Statistics
The tab Statistics shows the predicted SAR/temperature statistics for the target region, corresponding to the current settings. A SAR/temperature volume histogram is plotted and additionally the minimum and maximum temperature in the target are shown explicitly, together with the indexed SAR/temperatures SAR10/T10, SAR50/T50 and SAR90/T90, i.e., the SAR/temperature at least achieved in 10, 50 and 90% of the target volume. In addition, on the right hand side a plot is shown with the history of these statistics for the current session of Adapt2Heat. This statistics panel helps the operators to judge the heating quality.
2.3.3.8. Optimize
Automatic re-optimization functionality in response to hot spots is provided by the tab Optimize. For accurate hot spot registration based on the patient’s complaint, clinical workflow at the AUMC uses an anatomical picture with all possible hot spot locations indicated by numbers. This graphical representation ensures that the patient communicates the correct location to the operators. This anatomical picture with numbered hot spot locations is shown in the tab ‘Optimize’ and these numbers and the corresponding regions were implemented in Adapt2Heat. The operators can thus easily select the hot spot location indicated by the patient. In clinical practice, it is also possible that two different hot spots occur at the same time; this was accounted for by allowing selection of two hot spot locations.
After hot spot selection, clicking the button ‘re-optimize settings’ starts temperature-based re-optimization, maximizing target T90 with respect to constraints to all potential normal tissue hot spot locations. The principles of this optimization strategy have been published before [Citation43]. A constraint to the selected treatment limiting hot spot region(s) is set to reduce the average temperature at that location. To avoid the incidence of new hot spots, the temperature at the other potential hot spot locations should not increase significantly; to ensure this, a penalty term with this increase is added to the optimization goal function.
Fast re-optimization is ensured by averaging the temperature matrix elements (EquationEquation (2)(2)
(2) ) over the hot spot regions during the initialization process when starting Adapt2Heat. The hot spot regions are defined as described in section 2.2 (Workflow and pretreatment planning) and the diameter of these spherical regions is typically 5 cm. This averaging allows fast calculation of the average hot spot temperature during optimization by a vector-matrix-vector multiplication. This way re-optimization only takes up to a few seconds of calculation time. For more information about these re-optimization strategies the reader is referred to another publication [Citation48]. The re-optimization result is displayed in a pop-up window, which the operators can accept to proceed or cancel to proceed with manual steering.
A form of standard steering was implemented as a robust back-up, in case the optimization fails to return a valid solution, or in case no hot spot GOF file is provided as input in the XML configuration file. In those cases the power of the waveguide closest to the selected hot spot location is reduced by 15%, which is redistributed over the other waveguides to maintain a fixed power level; e.g., in case of hot spot 9, tail bone, the power supplied by the bottom waveguide is reduced by 15%. This is similar to our clinical steering protocol.
3. Results
In this section we will demonstrate possible practical use of Adapt2Heat to assist hyperthermia treatments through a cervical and pancreatic cancer patient examples. We will first demonstrate the main functionality using two artificial, but realistic, patient example cases to show how the software is designed to help to optimize settings, effectively suppress hot spots and compare standard protocol-based steering strategies and planning-based predictions. Section 3 will end with a real example of clinical use during treatment for a cervical cancer patient.
3.1. Example 1
Suppose that a cervical cancer patient is treated with the ALBA-4D system. Equal amplitudes are applied and the phase settings are top:bottom:left:right = 0:0:45:45 (°). The treatment starts with 600 W, which is increased to 700 W. Suppose that the patient feels a pain sensation of a hot spot at the pubic bone (nr. 29, ). According to the standard treatment protocol, the power ratio for the top antenna would be reduced to 0.8. shows the predicted effect of this strategy.
Figure 5. (A) Initial situation with a hot spot complaint at the pubic bone. (B) Predicted effect of the clinical steering strategy, reducing the power ratio for the top waveguide. (C) Evaluation of the effect of automatic re-optimization. Re-optimization is temperature based, reducing the temperature at the indicated hot spot location, while still maximizing target T90 and avoiding a significant temperature increase at all other potential hot spot locations.
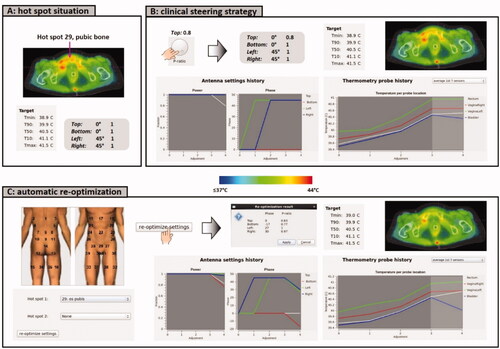
Adapt2Heat can provide an automatically generated suggestion for alternative settings to suppress the hot spot, which can also be evaluated and compared with the standard strategy (). The operators select hot spot nr 29 in the tabbed window ‘Optimize’ and apply for re-optimization of the phase-amplitude settings. This yields power ratios top:bottom:left:right = 0.83:0.77:1:0.97 and phases top:bottom:left:right = 0:-17:27:30. The planning-based strategy thus not only reduces the power of the top waveguide, but also the power of the bottom waveguide, in combination with small phase adjustments. Calculation of the re-optimized settings took 10 s on an Intel Xeon® E5-1650 v3 3.5 GHz running CentOS 6.8. The predicted effect is shown in . The tumor temperature is predicted to remain constant for both strategies. However, the re-optimized settings are predicted to be more effective in suppressing the hot spot than the standard clinical steering strategy. When evaluating also the predicted probe temperatures, averaged over the 1st 7 sensors, it is observed that the bladder temperature is lower for the re-optimized settings, compared to the clinical settings, indicating a more pronounced effect at the hot spot location. The predicted rectum temperature is increased slightly, but is still not higher than the cervix temperature, indicating adequate target focusing.
3.2. Example 2
Suppose that a pancreatic cancer patient is treated with the ALBA-4D system. A relatively low initial power of 400 W will be applied since the patient is rather thin. Because the pancreas is not located in the proximity of a natural body cavity, positioning of an E-field probe for initial phase optimization is not possible. Equal amplitudes will be applied and phases can be optimized using Adapt2Heat, by a simulated phase sweep (). show a good focusing to the target predicted for phases top:bottom:left:right = 0:74:54:50 (°). Heating the posterior part of the target is limited by cooling effects from the aorta, adjacent to the target.
Figure 6. (A) Initial situation with equal amplitudes and phases. (B) Predicted temperature distribution after applying a numerical phase sweep for phase optimization to focus to the pancreatic tumor location. (C) Evaluation of the predicted effect of a clinical steering strategy and an alternative strategy to resolve a hot spot complaint in the lower belly.
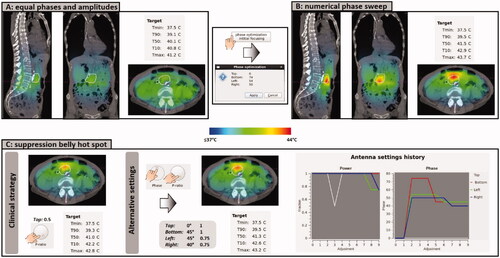
Due to the off-center location of the target, focusing to this location yields a risk of a hot spot in the belly. Since this is close to the heating focus, such a hot spot would be challenging to resolve without affecting the tumor temperature. Suppose the patient indeed indicates hot spot nr 22, i.e., central lower belly. Our clinical protocol would prescribe to reduce the power ratio of the top waveguide stepwise, until the pain disappears. Evaluation of this strategy in Adapt2Heat predicts that the power ratio should be reduced significantly to 0.5, to realize a substantial temperature reduction in the belly, in front of the target. However, the top antenna contributes considerably to heating the pancreatic tumor location, so this strategy is also likely to result in a reduction of the target temperature, which is indeed predicted; simulated T50 is reduced by 0.5 °C (). To avoid significant reduction of the target temperature, one could evaluate alternative strategies. For example: a phase shift of the bottom antenna, slightly moving the focus in posterior direction, would reduce the power delivered to the belly. A small reduction of the left and right phase slightly spreads the focus, thereby also reducing the hot spot temperature. To compensate for the loss of tumor heating as a result of these phase shifts, more power can be applied by the top and bottom waveguides, compared to left and right. shows that with power ratios top:bottom:left:right = 1:1:0.75:0.75 and phases top:bottom:left:right = 0:45:45:40 (°), a similar hot spot reduction is predicted, compared to the clinical steering strategy, but with better tumor heating.
3.3. Clinical use
In this final example, on-line use of Adapt2Heat during clinical treatment is demonstrated. A cervical cancer patient was treated with the ALBA-4D system. Multi-sensor thermocouple thermometry probes were positioned in the bladder, rectum and vagina/cervix and an E-field probe was inserted in the vagina according to standard clinical protocol [Citation49].
According to protocol, treatment started with equal amplitudes and phase optimization was based on a phase sweep, after which temperature rise measurements were performed using the optimized phases and two 40° bottom phase shifts, to verify focusing at the cervix [Citation47]. In this case, the evaluated phase settings were top:bottom:left:right = 0:-79:35:35 (°), 0:-39:35:35 (°) and 0:1:35:35 (°). The highest temperature rise in the cervix was measured for phases top:bottom:left:right = 0:1:35:35 (°), which were selected and applied in Adapt2Heat. Treatment started at 400 W and during the first ∼45 min, no hot spot complaints occurred. This allowed for a gradually increase of power to 575 W, to compensate for slowly decreasing measured target temperatures after 30 min, probably caused by increased local perfusion levels. This power increase was also applied (manually) in Adapt2Heat.
This power level appeared to be treatment limiting, and the patient reported a hot spot at the pubic bone (nr 29, ). Pretreatment planning may underestimate the local temperature and the actual temperature may exceed the pain threshold, or vice-versa. In this case, the patient experiences pain and no pronounced hot spot is predicted, but treatment planning can still help to reduce the local temperature below the pain threshold while maintaining adequate tumor heating. The present clinical protocol would suggest lowering the power ratio of the top waveguide. However, another strategy that could also be effective to reduce the temperature at the hot spot location is applying a phase shift to the bottom antenna. Predictions visualized in Adapt2Heat were used to find an effective steering strategy. The operators first tested a power ratio adjustment. Reduction of the top ratio to 0.5 resulted in a predicted decrease of the hot spot temperature from 40.1 °C to 39.8 °C (). Combining this with a phase of −30° for the bottom waveguide is expected to be more effective to significantly reduce the temperature near the pubic bone while still realizing similar or even slightly better target heating. This might prevent the commenced slight decrease of the measured target temperatures. Thus, based on these predictions by Adapt2Heat, the operators applied power ratios top:bottom:left:right = 0.5:1:1:1 and phases top:bottom:left:right = 0:-30:35:35 (°) to the control software of the ALBA-4D system.
Figure 7. (A) Initial situation with a hot spot complaint at the pubic bone. (B) Predicted effect of the clinical steering strategy, reducing the power ratio for the top waveguide, as well as an additional phase shift for the bottom applicator. (C) Clinically recorded antenna settings and average target temperatures. After phase-amplitude adjustment, average target temperatures remained constant at ∼41.5 °C and the patient confirmed disappearance of the hot spot. The treatment was completed with these settings, without further incidence of hot spots.
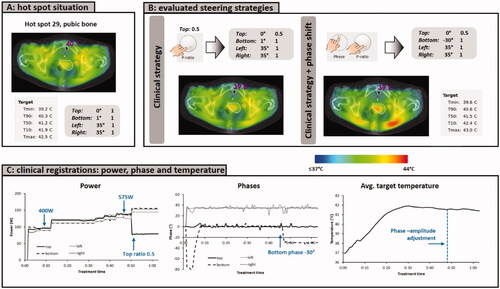
The patient confirmed disappearance of the hot spot after adjustment of the settings and no other hot spot occurred during the last part of the treatment. The temperature probe registrations during treatment showed average temperatures remained approximately constant at ∼41.5 °C (), so the hot spot was resolved, without affecting tumor heating.
4. Discussion
This paper presented and discussed Adapt2Heat, which was developed as a dedicated on-line hyperthermia treatment planning software package to enable planning-assisted locoregional hyperthermia treatments. A graphical user interface for planning-assisted treatment delivery has been in clinical use at our department for several years [Citation32], and continuous further developments have resulted in Adapt2Heat. Adapt2Heat meets the needs to assist the operators during treatment by providing insight in effects of phase-amplitude steering, as well as extensive functionality for manual or automatic (re-)optimization and visualization of SAR/temperature distributions. This way, the on-line treatment planning offered by Adapt2Heat is not a ‘black box’ prescribing the optimized system settings, but a flexible interactive software tool for planning-assisted hyperthermia delivery.
Adapt2Heat is an extension of the treatment planning package Plan2Heat [Citation36]. In our workflow, all pretreatment planning calculations that are used as input for Adapt2Heat are performed using Plan2Heat. Predictions by Plan2Heat have been validated for phantom set-ups, as well as in a clinical setting [Citation30–32,Citation36,Citation50,Citation51]. Adapt2Heat has been developed as a separate module, and pretreatment E-Field and SAR/temperature calculations could also be performed with other treatment planning/simulation software provided that the simulation set-ups were validated and results are converted to the correct data format (VTK and GOF) as input data for Adapt2Heat. This also allows for a flexible combination with other simulation techniques such as finite elements for electromagnetic field calculations, if desired.
The current version of Adapt2Heat is used in combination with the ALBA-4D system, but also combination with other heating devices (e.g., BSD Sigma-60 or Sigma Eye) would be possible, using either Plan2Heat or another package for pretreatment planning. All pretreatment planning and optimization calculations are general (i.e., independent of the number of antennas) and only small adaptations to Adapt2Heat are needed to support combination with other heating devices. These adaptations consist of layout of the control panel (in case the device has more than 4 antennas or antenna pairs), antenna and bolus visualization in the 3D view tab and the indicated antenna and bolus length in the visualization panels. As part of our ongoing research, the AMC-8 system and the BSD Sigma-60 and Sigma-Eye systems have been implemented in Plan2Heat [Citation52]. Implementing these heating devices also in Adapt2Heat would thus be a logical next step. Furthermore, ongoing research to improve the reliability of treatment planning, such as dielectric imaging to reconstruct patient-specific dielectric properties [Citation53,Citation54] or advanced thermal modeling including thermally significant large blood vessels [Citation41,Citation42], could be integrated easily in on-line treatment planning in the near future, since these aspects only influence the pretreatment planning process.
Commercial software is available to perform hyperthermia simulations and treatment planning (e.g., Sigma HyperPlan, for use in combination with BSD locoregional devices, COMSOL (www.comsol.com), CST studio suite (www.cst.com), Ansys High Frequency Structural Simulator (HFSS; www.ansys.com), and Sim4Life (SPAEG, Zurich, Switzerland)). However, commercial tools for on-line adaptive use of hyperthermia treatment planning that allow for planning-assisted hyperthermia delivery are still lacking and are currently primarily being developed by hyperthermia research groups. Besides Adapt2Heat, as presented in this paper, VEDO has been developed by Erasmus MC for use in combination with the HYPERcollar system for head&neck hyperthermia treatments [Citation35]. VEDO uses SAR-based treatment planning as performed by Sim4Life. Automatic (re-)optimization accounts for SAR constraints to critical tissues, the SAR values at the complaint region and the target SAR. Adapt2Heat provides both SAR-based and temperature-based planning. Although SAR-based and temperature-based planning both have pros and cons, for both strategies a comparable predictive value was observed for changes in measured temperature after phase-amplitude steering [Citation30]. Temperature-based treatment planning is preferred by our treatment operators, since this is more easy to interpret. Furthermore, automatic re-optimization in Adapt2Heat also accounts for the temperature at all potential hot spot locations to avoid incidence of new hot spots. A history of phase-amplitude settings, target SAR and temperatures is displayed for convenience of the operators. In addition, the operators can also use the phase-amplitude selection buttons in the control panel for manual re-optimization or fine-tuning. Thus, Adapt2Heat provides a more interactive and flexible treatment planning tool for on-line treatment planning-assisted hyperthermia.
Adapt2Heat is a tool and has no direct interaction with the treatment control software of the heating device and the treatment operators should always consciously and manually modify the system settings of the heating device to activate the re-optimized settings. Although this could induce a risk of human error, this risk can be considered minimal since always two operators perform locoregional hyperthermia treatments, who discuss every power/phase steering action needed during treatment delivery. The indirect guidance provided by Adapt2Heat also allows for flexible combination with the control software of other heating systems, and also ensures the same level of treatment safety compared to currently standard clinical practice with empirical steering, where the operators adjust the settings based on experience. In general, a positive impact on treatment quality can be expected when steering is assisted by online (adaptive) treatment planning, instead of based on just the experience of the operators. Overall treatment quality would be expected to become better and more consistant, since only a subset of the treatment operators have the many years of clinical experience in hyperthermia needed for optimal experience-based treatment guidance. Furthermore, occasionally tumor locations deviating from the mainstream of patients might occur, and treatment planning would help adequate heating in those cases. An example could be eccentrically located pelvic tumors [Citation33] or pancreatic tumor heating [Citation55], which is different from regular pelvic tumor heating and supported by very little thermometry in the tumor surroundings for treatment guidance.
This paper deals with examples of temperature based hyperthermia planning. A cross-over trial using SAR-based treatment planning performed earlier by Franckena et al. also demonstrated the potential of treatment planning-guided steering as an alternative to experience-based steering, but with the adopted SAR-based re-optimization strategy hot spot-related complaints could not always be resolved without reducing the thermal dose to the tumor [Citation56]. Temperature-based treatment planning in combination with effective re-optimization to suppress hot spots and minimizing the risk of introducing new hot spots might be more effective, since temperature-based optimization accounts for clinically relevant factors as blood perfusion, thermal conduction and bolus cooling. De Greef et al. evaluated the impact of tissue perfusion on the robustness of temperature-based optimization compared to SAR-based optimization and concluded that temperature-based treatment planning-guided optimization would be the best candidate to improve thermal dose delivery during hyperthermia treatments [Citation28].
Treatment planning-assisted hyperthermia delivery has been implemented in our clinical workflow and is routinely and successfully used for a few years [Citation32,Citation33]. Continuous developments have resulted in Adapt2Heat, a versatile on-line planning tool. Ongoing research aims to compare the effectiveness of temperature-based treatment planning-assisted steering with experience-based steering. Previous research has demonstrated that phase-amplitude steering by manual re-optimization supported with on-line use of temperature-based treatment planning is effective in suppressing hot spots, while maintaining the same level of tumor heating, as well as to improve tumor heating without inducing hot spots [Citation32,Citation33]. Based on these pilot studies, planning-assisted hyperthermia delivery using Adapt2Heat is expected to realize an improvement in treatment quality.
5. Conclusion
Adapt2Heat provides a versatile and flexible treatment planning tool for on-line treatment planning-assisted hyperthermia. Extensive features for visualization, optimization and re-optimization during treatment allow practical use in many locoregional hyperthermia applications. Online adaptive planning tools like Adapt2Heat are indispensable for further enhancing the quality of hyperthermia treatment delivery and achieving better treatment outcomes.
Disclosure statement
No potential conflict of interest was reported by the author(s).
Additional information
Funding
References
- Cihoric N, Tsikkinis A, van Rhoon G, et al. Hyperthermia-related clinical trials on cancer treatment within the ClinicalTrials.gov registry. Int J Hyperthermia. 2015;31(6):609–614.
- Issels RD, Lindner LH, Verweij J, European Organization for the R, Treatment of Cancer-Soft T, Bone Sarcoma G, and the European Society for Hyperthermic O, et al. Effect of neoadjuvant chemotherapy plus regional hyperthermia on long-term outcomes among patients with localized High-Risk soft tissue sarcoma: the EORTC 62961-ESHO 95 randomized clinical trial. JAMA Oncol. 2018;4(4):483–492.
- Van der Zee J, González González D, Van Rhoon GC, et al. Comparison of radiotherapy alone with radiotherapy plus hyperthermia in locally advanced pelvic tumours: a prospective, randomised, multicentre trial. Dutch deep hyperthermia group. Lancet. 2000;355(9210):1119–1125.
- Datta NR, Kok HP, Crezee H, et al. Integrating Loco-Regional hyperthermia into the current oncology practice: SWOT and TOWS analyses. Front Oncol. 2020;10:819.
- Stauffer PR. Evolving technology for thermal therapy of cancer. Int J Hyperthermia. 2005;21(8):731–744.
- Kok HP, Cressman ENK, Ceelen W, et al. Heating technology for malignant tumors: a review. Int J Hyperthermia. 2020;37(1):711–741.
- Zweije R, Kok HP, Bakker A, et al. Technical and clinical evaluation of the ALBA-4D 70MHz loco-regional hyperthermia system. Proceedings of the 48th European Microwave Conference. 2018. 328–331.
- Wust P, Beck R, Berger J, et al. Electric field distributions in a phased-array applicator with 12 channels: measurements and numerical simulations. Med Phys. 2000;27(11):2565–2579.
- Turner PF, Tumeh A, Schaefermeyer T. BSD-2000 approach for deep local and regional hyperthermia: physics and technology. Strahlenther Onkol. 1989;165(10):738–741.
- Bruggmoser G, Bauchowitz S, Canters R, ESHO Technical Committee in the Interdisciplinary Working Group Hyperthermia (IAH) in the German Cancer Society, et al. Quality assurance for clinical studies in regional deep hyperthermia. Strahlenther Onkol. 2011;187(10):605–610.
- Craciunescu OI, Stauffer PR, Soher BJ, et al. Accuracy of real time noninvasive temperature measurements using magnetic resonance thermal imaging in patients treated for high grade extremity soft tissue sarcomas. Med Phys. 2009;36(11):4848–4858.
- Gellermann J, Hildebrandt B, Issels R, et al. Noninvasive magnetic resonance thermography of soft tissue sarcomas during regional hyperthermia: correlation with response and direct thermometry. Cancer. 2006;107(6):1373–1382.
- Winter L, Oberacker E, Paul K, et al. Magnetic resonance thermometry: Methodology, pitfalls and practical solutions. Int J Hyperthermia. 2016;32(1):63–75.
- Stoll AM, Greene LC. Relationship between pain and tissue damage due to thermal radiation. J Appl Physiol. 1959;14(3):373–382.
- Franckena M, Fatehi D, de Bruijne M, et al. Hyperthermia dose-effect relationship in 420 patients with cervical cancer treated with combined radiotherapy and hyperthermia. Eur J Cancer. 2009;45(11):1969–1978.
- Kroesen M, Mulder HT, Van Holthe JML, Aangeenbrug AA, et al. Confirmation of thermal dose as a predictor of local control in cervical carcinoma patients treated with state-of-the-art radiation therapy and hyperthermia. Radiother Oncol. 2019;140:150–158.
- Kok HP, Wust P, Stauffer PR, et al. Current state of the art of regional hyperthermia treatment planning: a review. Radiat Oncol. 2015;10:196.
- Kok HP, Navarro F, Strigari L, et al. Locoregional hyperthermia of deep-seated tumours applied with capacitive and radiative systems: a simulation study. Int J Hyperthermia. 2018;34(6):714–730.
- Drizdal T, Paulides MM, van Holthe N, et al. Hyperthermia treatment planning guided applicator selection for Sub-superficial head and neck tumors heating. Int J Hyperthermia. 2018;34(6):704–713.
- Canters RA, Franckena M, Van der Zee J, et al. Optimizing deep hyperthermia treatments: are locations of patient pain complaints correlated with modelled SAR peak locations? Phys Med Biol. 2011;56(2):439–451.
- Kok HP, Crezee J. Hyperthermia treatment planning: clinical application and ongoing developments. IEEE J Electromagn RF Microw Med Biol. 2021;5(3):214–222.
- Kok HP, van der Zee J, Guirado FN, et al. Treatment planning facilitates clinical decision making for hyperthermia treatments. Int J Hyperthermia. 2021;38(1):532–551.
- Prasad B, Kim JK, Kim S. Role of simulations in the treatment planning of radiofrequency hyperthermia therapy in clinics. J Oncol. 2019;2019:9685476.
- Sreenivasa G, Gellermann J, Rau B, et al. Clinical use of the hyperthermia treatment planning system HyperPlan to predict effectiveness and toxicity. Int J Radiat Oncol Biol Phys. 2003;55(2):407–419.
- Canters RA, Franckena M, Van der Zee J, et al. Complaint-adaptive power density optimization as a tool for HTP-guided steering in deep hyperthermia treatment of pelvic tumors. Phys Med Biol. 2008;53(23):6799–6820.
- Kok HP, Van Haaren PMA, van de Kamer JB, et al. Prospective treatment planning to improve locoregional hyperthermia for oesophageal cancer. Int J Hyperthermia. 2006;22(5):375–389.
- de Bruijne M, Wielheesen DH, Van der Zee J, et al. Benefits of superficial hyperthermia treatment planning: five case studies. Int J Hyperthermia. 2007;23(5):417–429.
- De Greef M, Kok HP, Correia D, et al. Optimization in hyperthermia treatment planning: the impact of tissue perfusion uncertainty. Med Phys. 2010;37(9):4540–4550.
- De Greef M, Kok HP, Correia D, et al. Uncertainty in hyperthermia treatment planning: the need for robust system design. Phys Med Biol. 2011;56(11):3233–3250.
- Kok HP, Schooneveldt G, Bakker A, et al. Predictive value of simulated SAR and temperature for changes in measured temperature after phase-amplitude steering during locoregional hyperthermia treatments. Int J Hyperthermia. 2018;35(1):330–339.
- Kok HP, Ciampa S, De Kroon-Oldenhof R, et al. Zum vörde sive vörding PJ, stalpers LJA, geijsen ED, bardati F, bel A, and crezee J, toward on-line adaptive hyperthermia treatment planning: correlation between measured and simulated specific absorption rate changes caused by phase steering in patients. Int.J.Radiat.Oncol.Biol.Phys. 2014;90(2):438–445.
- Kok HP, Korshuize - van Straten L, Bakker A, et al. Online Adaptive Hyperthermia Treatment Planning During Locoregional Heating to Suppress Treatment-Limiting Hot Spots . Int J Radiat Oncol Biol Phys. 2017;99(4):1039–1047.
- Kok HP, Korshuize-van Straten L, Bakker A, et al. Feasibility of on-line temperature-based hyperthermia treatment planning to improve tumour temperatures during locoregional hyperthermia. Int J Hyperthermia. 2018;34(7):1082–1091.
- Li Z, Vogel M, Maccarini PF, et al. Improved hyperthermia treatment control using SAR/temperature simulation and PRFS magnetic resonance thermal imaging. Int J Hyperthermia. 2011;27(1):86–99.
- Rijnen Z, Bakker JF, Canters RA, et al. Clinical integration of software tool VEDO for adaptive and quantitative application of phased array hyperthermia in the head and neck. Int J Hyperthermia. 2013;29(3):181–193.
- Kok HP, Kotte ANTJ, Crezee J. Planning, optimisation and evaluation of hyperthermia treatments. Int J Hyperthermia. 2017;33(6):593–607.
- Hornsleth SN, Mella O, and, Dahl O. A new segmentation algorithm for finite difference based treatment planning systems. In: Franconi C, Arcangeli G, and Cavaliere R, editors. Hyperthermic oncology 1996. vol. 2. Rome: Italy Tor Vergata; 1996. p. 521–523.
- Berenger JP. A perfectly matched layer for the absorption of Electromagnetic-Waves. Comput Phys. 1994;114(2):185–200.
- Taflove A. The finite-difference time-domain method. Boston: Artech House; 1995.
- Pennes HH. Analysis of tissue and arterial blood temperatures in the resting human forearm. J Appl Physiol. 1948;1(2):93–122. 1948.
- Kok HP, Van den Berg CAT, Bel A, et al. Fast thermal simulations and temperature optimization for hyperthermia treatment planning, including realistic 3D vessel networks. Med Phys. 2013;40(10):103303.
- Gavazzi S, van Lier A, Zachiu C, et al. Advanced patient-specific hyperthermia treatment planning. Int J Hyperthermia. 2020;37(1):992–1007.
- Das SK, Clegg ST, Samulski TV. Computational techniques for fast hyperthermia temperature optimization. Med Phys. 1999;26(2):319–328.
- Kok HP, Van Haaren PMA, van de Kamer JB, et al. High-resolution temperature-based optimization for hyperthermia treatment planning. Phys Med Biol. 2005;50(13):3127–3141.
- De Bree J. A 3-D anatomy based treatment planning system for interstitial hyperthermia. [PhD Thesis]. Utrecht University. 1998.
- Wiersma J, van Dijk JDP, Sijbrands J, et al. The measurement of fringing fields in a radio-frequency hyperthermia array with emphasis on bolus size. Int J Hyperthermia. 1998;14(6):535–551.
- Crezee J, Zweije R, and, Kok HP. Patient-specific set-up procedures for treatment optimisation in locoregional hyperthermia. 14th European Conference on Antennas and Propagation (EuCAP), Copenhagen, Denmark, 2020. 1–5.
- Kok HP, Crezee J. Fast adaptive temperature-based re-optimization strategies for on-line hot spot suppression during locoregional hyperthermia. Cancers (Basel). 2021;14(1):133. 28
- Van Haaren PMA, Kok HP, Van den Berg CAT, et al. On verification of hyperthermia treatment planning for cervical carcinoma patients. Int J Hyperthermia. 2007;23(3):303–314.
- Van Haaren P, Kok P, Van Stam G, et al. SAR measurements and FDTD calculations in inhomogeneous phantom models. 9th International Congress on Hyperthermic Oncology, St.Louis, USA, 2004.Abstracts. 2004. p. 167.
- Van Haaren PMA, Van den Berg CAT, Kok HP, et al. Verification of hyperthermia treatment planning in cervix carcinoma patients using invasive thermometry. ESHO-2005: Abstracts. 2005. 36-37.
- Kok HP, Beck M, Loke DR, et al. Locoregional peritoneal hyperthermia to enhance the effectiveness of chemotherapy in patients with peritoneal carcinomatosis: a simulation study comparing different locoregional heating systems. Int J Hyperthermia. 2020;37(1):76–88.
- Balidemaj E, Kok HP, Schooneveldt G, et al. Hyperthermia treatment planning for cervical cancer patients based on electrical conductivity tissue properties acquired in vivo with EPT at 3 T MRI. Int J Hyperthermia. 2016;32(5):558–568.
- Gavazzi S, den Berg CAT, Savenije MHF, et al. Deep learning-based reconstruction of in vivo pelvis conductivity with a 3D patch-based convolutional neural network trained on simulated MR data. Magn Reson Med. 2020;84(5):2772–2787.,
- Kok HP, de Kroon-Oldenhof R, van Straten L K, et al. RF heating of pancreatic tumours guided by hyperthermia treatment planning and limited thermometry. Proceedings of the 48th European Microwave Conference. 2018. 332-335.
- Franckena M, Canters R, Termorshuizen F, et al. Clinical implementation of hyperthermia treatment planning guided steering: a cross over trial to assess its current contribution to treatment quality. Int J Hyperthermia. 2010;26(2):145–157.