
 ?Mathematical formulae have been encoded as MathML and are displayed in this HTML version using MathJax in order to improve their display. Uncheck the box to turn MathJax off. This feature requires Javascript. Click on a formula to zoom.
Abstract
Objective
This study aimed to assess the predictive value of conventional magnetic resonance imaging (MRI) combined with radiomics in determining the nonperfused volume ratio (NPVR) following high-intensity focused ultrasound (HIFU) ablation for uterine fibroids.
Methods and materials
A total of 216 symptomatic uterine fibroids in 216 women were subjected to HIFU ablation from October 2015 to March 2020. Baseline clinical and MR parameters acquired before and after HIFU ablation were analyzed, and the NPVR was calculated accordingly. Radiomics features were extracted using A.K. software on T2-weighted imaging (T2WI). The minimum redundancy and maximum relevancy (mRMR) method were used to refine the selected radiomics features. Then, multiple linear regression models, the Wilcoxon signed-rank test, and Spearman’s rank correlation and Bland–Altman analyses were conducted.
Results
Conventional MRI combined with radiomics revealed the signal intensity on T2WI (X9), enhancement degree on T1-weighted imaging (T1WI) (X11), uterine fibroid location (X4), wavelet_glszm_SizeZoneNonUniformity first order (X12) and wavelet_HHH_firstorder_Skewness (X13) negatively affected the NPVR. The resulting regression equation was NPVR = 104.030 − 11.886 × X9 − 5.459 × X11 − 2.776 × X4 − 0.20 × X12 − 16.913 × X13. The adjusted R2 values of the conventional MRI model and combined model were 0.385 and 0.408, respectively, and the two fitted models were statistically significant (p < 0.05). No significant differences were observed between the predicted NPVR value [81 (71, 91) %] of the combined model and the actual NPVR value [89 (77, 97) %] (p > 0.05). In addition, the predicted NPVR was correlated with the actual NPVR (r = 0.655, p < 0.001).
Conclusions
The efficiency of the combined model was better than that of the conventional MRI model in predicting the NPVR following HIFU ablation for uterine fibroids. Radiomics is an important supplemental modality to conventional MRI.
Introduction
High-intensity focused ultrasound (HIFU) was approved by the Food and Drug Administration (FDA) to treat uterine fibroids in 2004. This technique is effective, safe, and noninvasive; has limited side effects; and can preserve fertility [Citation1]. The basic principle in treating uterine fibroids involves the conversion of high-intensity ultrasound energy into heat energy at the target area. Because nonenhanced areas on enhanced magnetic resonance imaging (MRI) are essentially consistent with pathological necrotic areas [Citation2], contrast-enhanced (CE) MRI can be used to evaluate necrotic areas within uterine fibroids following HIFU ablation to evaluate the efficacy of early treatment. Previous studies [Citation3,Citation4] have shown that patients with a larger nonperfused volume ratio (NPVR) experience more obvious symptom relief and a lower probability of postoperative recurrence and reintervention. Therefore, a higher NPVR is critical for ensuring the long-term efficacy of HIFU ablation for uterine fibroids. The effective prediction of the preoperative NPVR may help identify patients who are not suitable for HIFU treatment or improve the methods and efficacy of HIFU treatment for uterine fibroids.
MRI has become the most important tool for the preoperative evaluation and efficacy prediction of HIFU ablation for uterine fibroids due to the specific characteristics of its multiple sequences and parameters [Citation5]. Existing NPVR prediction models for the HIFU ablation of uterine fibroids tend to be based on conventional T2-weighted imaging (T2WI) [Citation6,Citation7], which is highly sensitive in evaluating the histological characteristics of uterine fibroids before treatment. For example, rich cellular content, high water content or uterine fibroid degeneration can lead to a high signal intensity on T2WI. In addition to T2WI hyperintensity, obvious enhancement on contrast-enhanced T1-weighted imaging (CE-T1WI) can indicate a rich blood supply, another important factor limiting the HIFU ablation rate for uterine fibroids [Citation8,Citation9]. The theoretical basis for this resistance is that cellular uterine fibroids are composed of rich smooth muscle cells with high water content, sparse collagen fibers, and low acoustic impedance; thus, the absorption of ultrasonic energy and the subsequent tissue warming effect decrease, reducing the ablation effect. In contrast, degenerative uterine fibroids with high signal intensity on T2WI due to hemorrhage or edema are easily ablated because of the poor blood supply and low cell density [Citation10]. However, previous studies have revealed that uterine fibroids of different pathological types demonstrate some overlap on T2WI. Thus, the current NPVR prediction models based on conventional T2WI may be limited.
Radiomics reflects the functional state and heterogeneity of tissues by extracting and analyzing high-throughput information from conventional grayscale images. In recent years, radiomics has become widely applied in clinical research, confirming that, as a new tool, it can be an important supplement to conventional imaging. Currently, the application of radiomics for uterine fibroids is relatively limited; most applications are restricted to the differential diagnosis of different pathological types of uterine fibroids or the differentiation of atypical uterine fibroids from uterine sarcomas. Most of the methods used are relatively simple, such as histogram and texture analyses [Citation11,Citation12]. Preliminary results have shown that these methods have certain value in identifying cellular uterine fibroids and differentiating degenerative uterine fibroids from uterine sarcomas; thus, radiomics may have potential value in predicting the HIFU ablation rate of uterine fibroids. However, to the best of our knowledge, there have been no reports on the application of radiomics parameters for predicting the efficacy of HIFU ablation for uterine fibroids, which thus warrants further study. Therefore, based on the findings of previous studies, the principal objective of this study was to incorporate radiomics into the conventional MR model of NPVR prediction and explore its additional potential diagnostic value.
Materials and methods
Patients
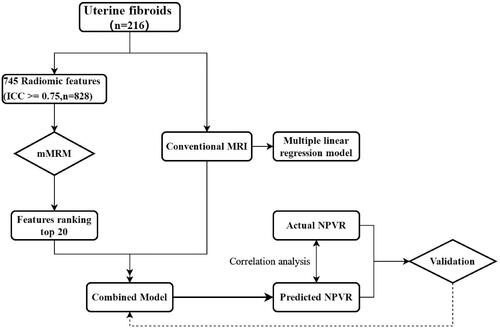
This retrospective study (2019KY33) was approved by the institutional review board of The First Affiliated Hospital of the University of Science and Technology of China (USTC), and the requirement for written informed consent was waived. The clinical and conventional MR data of 1050 patients with uterine fibroids treated with HIFU at The First Affiliated Hospital of the University of the USTC from October 2015 to March 2020 were retrieved. The inclusion criteria were as follows: (1) nonpregnancy during MR examination or no plans to become pregnant in the near future; (2) MR examination performed within one week before and after HIFU treatment; (3) no biopsy, operation or other treatment before MRI examination; (4) MR image quality that satisfied the analysis requirements; and (5) ablation of a single uterine fibroid regardless of the number present due to tolerance and other reasons. When the first uterine fibroid was ablated, other uterine fibroids within the range of the acoustic channel also received partial ultrasound energy, affecting the treatment time and dose of subsequent uterine fibroid ablation. The exclusion criteria were as follows: (1) lesion diameter less than 1 cm (as radiomics characteristics cannot be obtained for analysis from lesions with diameters measuring less than 1 cm [Citation13]); (2) the presence of artifacts causing image distortion, preventing region of interest (ROI) delineation; (3) the presence of other specific types of uterine fibroids and leiomyosarcomas requiring surgical treatment; and (4) obvious contraindications to MR examination. A flow diagram of the study is shown in .
Figure 1. Flow chart of the study design.
MR image acquisition
For data acquisition, a 3.0-T MR scanning system (Signa HDxT, GE Healthcare, USA) with an 8-channel phased-array body coil was used. The scanning range was from the iliac spine to the pubic symphysis. Scopolamine butylbromide (20 mg) was injected intramuscularly 15 min before scanning. The patients were asked to empty their bladders before the examination to keep them semi filled. The scanning sequence and parameters were as follows: (1) axial T1WI: repetition time (TR) 500 ms, excitation time (TE) 7.5 ms, matrix 352 × 192, number of excitations (NEX) 2, field of view (FOV) 32 cm × 32 cm, slice thickness 6 mm, slice spacing 2 mm; (2) axial T2WI and fat-suppressed (fs)-T2WI: TR 5000 ms, TE 72.5 ms, matrix 352 × 256, NEX 2, FOV 24 cm × 24 cm, slice thickness 6 mm, slice spacing 2 mm; (3) sagittal T2WI: TR 4500 ms, TE 72.5 ms, matrix 320 × 320, NEX 2, FOV 28 cm × 28 cm, slice thickness 6 mm, slice spacing 1 mm; (4) diffusion-weighted imaging (DWI): b values 0, 1000s/mm2, TR/TE 6000 ms/65 ms, matrix 96 × 130, NEX = 6; and (4) liver acceleration volume acquisition sequence (LAVA-flex) with CE: slice thickness 4 mm, FOV 38 cm × 40 cm, matrix 320 × 224, and contrast agent gadopentetate glucosamine (Gd-DTPA), which was injected by a high-pressure syringe via the elbow vein at a dose of 0.1 mmol/kg and a flow rate of 2.0 ml/s. Arterial-phase scanning was initiated 25 s after contrast injection, and venous-phase and delayed-phase scanning were initiated at 50 s and 3 min, respectively. After the above scans were completed, a sagittal delayed scan was performed, and a coronal delayed scan was added if necessary.
Pretreatment MRI evaluation
The evaluation of uterine fibroid MR data before HIFU was performed independently by two doctors (C.W. and B.S.) with 10 and 8 years of experience in gynaecological tumor imaging, respectively. If the evaluation of the imaging features was inconsistent, a consensus was reached through discussion. The following imaging features were recorded: (1) uterine position (X1: anterior = 0, posterior = 1); (2) uterine fibroid size (X2: expressed by the maximum diameter (Dmax)); (3) uterine fibroid volume (X3: V), V = 0.5233 × transverse diameter (D1) × anteroposterior diameter (D2) × vertical diameter (D3); (4) uterine fibroid location (X4: anterior wall = 0, posterior wall = 1, lateral wall = 2); (5) uterine fibroid type (X5: submucosal = 0, intramural = 1, subserosal = 2); (6) thickness of the abdominal wall in the central layer of the uterine fibroid (X6), (7) distance from the ventral side of the central layer of the uterine fibroid to the skin (X7); (8) abdominal wall scarring (X8: absent = 0, present = 1); (9) signal intensity on T2WI (X9: hypointense = 0, signal intensity equal to that of the skeletal muscle (Funaki type I); isointense = 1, higher than that of the skeletal muscle but lower than that of the myometrium (Funaki type II); hyperintense = 2, similar to or higher than that of the myometrium (Funaki type III)); (10) signal intensity on DWI (X10: lower than that of the myometrium = 0, similar to that of the myometrium = 1, higher than that of the myometrium = 2); and (11) and enhancement degree on CE-T1WI (X11: lower than that of the myometrium = 0, similar to that of the myometrium = 1, higher than that of the myometrium = 2).
Radiomics data processing
The ITK-SNAP software package (version 3.8; www.itksnap.org) was used for the manual segmentation of uterine fibroids, and a T2W nonfat suppression sequence was used for image segmentation. A doctor with 10 years of experience in MR imaging of gynaecological tumors drew the segmentation lines slice-by-slice along the edge of the uterine fibroid until the entire volume was drawn. The segmentation lines generally did not exceed 3–4 mm past the edge of the uterine fibroid to avoid the influence of partial volume effects. The ROI files were saved after delineation. To minimize measurement errors, another radiologist with 8 years of experience in imaging gynaecological tumors delineated the images of 20 patients randomly drawn from the entire cohort to assess the consistency between observers. The original uterine fibroid data and the corresponding segmented ROI files were imported into Artificial Intelligence Kit (A.K.) software package (version 3.2; GE Healthcare) for radiomics feature extraction. The minimum redundancy and maximum relevancy (mRMR) method were used to select the 20 radiomics features with a high correlation with the NPVR and no redundancy from the extracted data.
HIFU ablation
Intestinal preparation, skin preparation, bladder training and an assessment of patient comfort were performed before HIFU treatment. All of the treatments were performed by two trained professional doctors using a JC200 HIFU tumor therapy system (Chongqing HIFU Tech, China). The ablation zone was 1.5 cm × 1.5 cm × 1.0 cm, and the layered tentative treatment method was applied at 5 mm/slice. The exposure time in the initial stage of treatment was 1 s, followed by a 3s cooling step. This was repeated 5 times as per the method followed by a subsequent 2–3 cycles prior to a gradual increase in the exposure time until the patient’s tolerance threshold for exposure/cooling was met. The appearance of clumps of high-level echo on the real-time ultrasound image monitor indicated that the ablation in the target area was complete, leading to a subsequent shift to another therapeutic target area to continue treatment until the entire uterine fibroid was treated. During the treatment, electrocardiographic (ECG) monitoring was performed to track the patients' vital signs, and sedative and analgesic drugs were administered. The following parameters were recorded: sonication power (W), sonication time (s, total sonication time), treatment time (min, time required for the whole treatment process), and the total level of energy required for ablation (J).
Posttreatment MRI evaluation
The nonperfusion volume (NPV) was measured on CE-MRI according to the measurement method for the preoperative uterine fibroid volume (V), from which the ablation rate was then calculated according to the following formula: NPVR = NPV/V (%).
Statistical analysis
In this study, normal and skewed quantitative data are expressed as ± s and M (P25, P75), respectively, and categorical data are expressed as n (%). Ranked or categorical variables were set as dummy variables using the numbers 0, 1 and 2. The mRMR method was used to select radiomics features as described above. The NPVR was used as the dependent variable, and the conventional MR data, radiomics data, and a combination of conventional MR and radiomics data were used as independent variables to establish multiple linear regression models. The models were assessed with stepwise regression analysis, and parameters with F < 0.05 were included in the model, while those with F > 0.1 were excluded. The coefficient of determination R2 and the adjusted R2 were used to evaluate the models (0 ≤ R2 ≤ 1). The Durbin–Watson test was used to evaluate whether the residuals of the regression models were independent (range, 0–4). When the Durbin–Watson value was close to 2, the residuals were considered independent. Analysis of variance (ANOVA) was used to evaluate the overall regression effect of the model. p < 0.05 indicated that the fitted model was statistically significant. Tolerance and the variance inflation factor (VIF) were used to evaluate the multicollinearity of the model. Tolerance > 0.2 or VIF < 10 indicated the absence of significant multicollinearity between independent variables.
Relationships between the predicted and actual NPVR values were assessed with the Wilcoxon signed-rank test and Spearman’s rank correlation test. The χ2 test (R × C) and z-test with Bonferroni correction were performed to analyze the types (submucosal/intramural/subserosal) of fibroids found in different locations. Intraclass correlation coefficients (ICCs) were calculated to evaluate the repeatability of the measured radiomics data. An ICC > 0.8 indicated excellent agreement. SPSS 24.0 software (IBM SPSS, Armonk, NY, USA), MedCalc 16.0 and the R language package (version 3.6.1) were used for the statistical analyses, and p < 0.05 indicated a statistical significance.
Results
Baseline patient data
A total of 216 patients who met the inclusion criteria were enrolled in this study. The age ranged from 21 to 58 years, with an average age of 37 ± 8 years. Only one uterine fibroid was ablated for each of the 216 patients. Other clinical and baseline MR data are shown in . A total of 120 uterine fibroids were located in the anterior wall of the uterus, including 88 intramural myomas, 9 submucosal myomas, and 23 subserosal myomas. A total of 48 uterine fibroids were located in the posterior wall, including 40 intramural myomas, 4 submucosal myomas, and 4 subserosal myomas. Finally, 48 uterine fibroids were located in the lateral wall, including 45 intramural myomas, 1 submucosal myoma and 2 subserosal myomas. The χ2 test (R × C) showed that there were differences in the distribution of uterine fibroid types among the three locations (p = 0.026). Further z-tests showed that there was a significant difference between the types of uterine fibroids in the anterior wall and lateral wall (p < 0.05) but not between the types in the anterior wall and posterior wall or between those in the posterior wall and lateral wall (p > 0.05).
Table 1. Baseline data of uterine fibroid patients before HIFU.
Treatment results
The average acoustic power of the HIFU ablation was 388 ± 37 W, the average sonication time was 1211 ± 660 s, the average treatment time was 112 ± 53 min, the median ablation volume was 98,609 (35,155, 110,709) cm3, and the median NPVR was 89 (77, 97) %. The median treatment energy recorded by the machine was 411,400 (261,775, 619,920) J, and the median energy efficiency factor was 6.24 (3.40, 11.01) J/cm3 ().
Table 2. Results of uterine fibroid treatment by HIFU.
Radiomics features selected
The top 20 features retained after mRMR selection are shown in .
Table 3. The first 20 radiomic parameters related to the NPVR selected by mRMR.
Table 4. Multiple linear regression model for the NPVR based on conventional MRI and radiomics features.
Construction of a multiple linear regression model for the NPVR based on conventional MRI
A multiple linear regression model was established with the NPVR as the independent variable and the MR features of uterine fibroids listed in as the dependent variable using the stepwise method. The R2 of the conventional MRI model for the NPVR was 0.394, and the adjusted R2 was 0.385. The statistics obtained from ANOVA were F = 49.925 and p < 0.001, indicating that the fitted model was statistically significant. The Durbin–Watson value of the model was 1.986, very close to the standard value of 2, indicating that the residuals were independent of each other. The multicollinearity results showed that the tolerance of each variable was greater than 0.2 and the VIF was under 10, indicating that there was no multicollinearity among the explanatory variables. Ultimately, the independent variables of signal intensity on T2WI (X9), enhancement degree on CE-MRI (X11) and uterine fibroid location (X4) were entered into the multiple linear regression model.
The regression equation was determined as follows: NPVR = 103.851–11.868 × X9–5.64 × X11–2.984 × X4. The signal intensity on T2WI (X9), enhancement degree on CE-T1WI (X11) and uterine fibroid location (X4) were negatively correlated with the NPVR, and the order of the standardized regression coefficients was X9 > X11 > X4, indicating that the effect of X9 on the NPVR was greater than that of X11, whose effect was in turn greater than that of X4.
Construction of a multiple linear regression model for the NPVR based on conventional MRI and radiomics features
A multiple linear regression model was established with the uterine fibroid MR data shown in and the 20 radiomics parameters shown in as independent variables and the NPVR as the dependent variable. The final regression model R2 of the NPVR was 0.422, and the adjusted R2 was 0.408 (). The statistics from the ANOVA of the model were F = 30.617 and p < 0.001 (). The Durbin–Watson value of the regression model was 1.963 (very close to 2). In the collinearity test, the tolerance of all variables was greater than 0.2, and the VIF was below 10.
Table 5. ANOVA of the multiple linear regression model for the NPVR based on conventional MRI and radiomics features.
The signal intensity on T2WI (X9), enhancement degree on T1WI (X11), uterine fibroid location (X4), wavelet_HHL_glszm_SizeZoneNonUniformity (X12) and wavelet_HHH_firstorder_Skewness (X13) were entered into the final regression model (), and the regression equation was as follows: NPVR = 104.030–11.886 × X9– 5.459 × X11–2.776 × X4–0.20 × X12–16.913 × X13. The interobserver ICCs between the two radiologists for X12 and X13 were 0.985 and 0.909 (p < 0.001), respectively, and the Bland–Altman diagram also indicated good agreement ().
Figure 2. Bland–Altman diagrams were used for evaluating the consistency between the two observers who measured wavelet_HHH_firstorder_Skewness (2a) and wavelet_HHL_glszm_SizeZoneNonUniformity (2 b). In the figure, the abscissa represents the average value of the measured data of two observers, the ordinate represents the difference between the two groups of data, the blue solid line represents the average value of the difference between the two groups of data, the green dotted line represents the 95% CI of the average value of the difference between the two groups of data, and the orange line indicates the position where the average value of the difference is 0. The results obtained by the two measurers are relatively close, indicating that the consistency between the two observers was high.
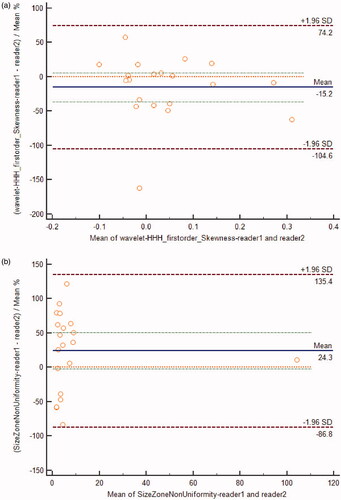
Table 6. Multiple linear regression analysis of the NPVR based on conventional MRI and radiomics features.
Evaluation of the combined NPVR prediction model
The conventional MR prediction model and the combined conventional MR and radiomics data model identified statistically significant independent variables, and the efficacy of these models was reasonable. The adjusted R2 (0.408) of the combined model was higher than that of the conventional MR prediction model (0.385), indicating that the fitting degree of the combined model was higher than that of the conventional MR prediction model.
Validation of the combined NPVR prediction model
According to the prediction model equation (NPVR = 104.030–11.886 × X9– 5.459 × X11–2.776 × X4–0.20 × X12 –16.913 × X13), the predicted NPVR was 81 (71, 91)%. There was no significant difference between the predicted and actual NPVR values (median: 81% vs. 89%; Z = −1.945, p = 0.052), and the two parameters were significantly positively correlated (r = 0.655, p < 0.001) ().
Figure 3. Correlation between the predicted and actual NPVR values of the final NPVR prediction model.
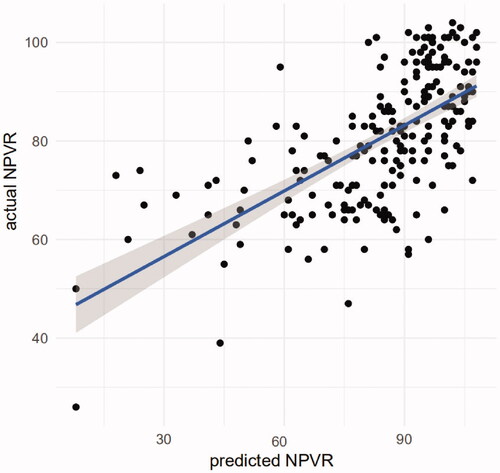
Figure 4. A 25-year-old patient with a uterine fibroid in the left wall of the uterus. Before HIFU, her uterine fibroids showed low signal intensity on T2WI (a) and DWI (b) and were slightly enhanced on CE-MRI (c); all their values were 0. The values of wavelet_HHH_firstorder_Skewness and wavelet_HHL_glszm_sizezonenonuniformity were 0.16 and 3.00, respectively. The ablation area was not enhanced on CE-MRI after HIFU (d). The predicted and actual NPVR values were 94% and 98%, respectively.
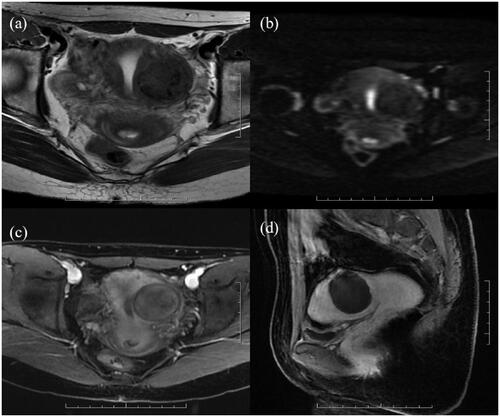
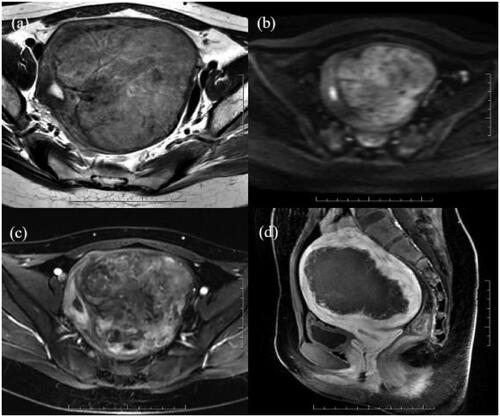
Figure 5. A 21-year-old patient with a uterine fibroid in the left wall of the uterus. The uterine fibroid showed high signal intensity on T2WI (a) and DWI (b) and significant enhancement on CE-MRI (c) before HIFU, and all of the values were 2. The values of wavelet_HHH_firstorder_Skewness and wavelet_HHL_glszm_sizezonenonuniformity were 0.02 and 2.14, respectively. CE-MRI after HIFU showed that the ablation area was not enhanced (d). The predicted and actual NPVR values were 69% and 66%, respectively.
Discussion
The immediate NPVR of uterine fibroids after HIFU is an important indicator that is closely associated with long-term prognosis; the larger the NPVR is, the better the long-term prognosis. Therefore, to ensure patient safety, the largest NPVR possible should be obtained [Citation14].
The conventional MR prediction model showed that the first independent prognostic factor was the signal intensity of the uterine fibroids on T2WI, which negatively affected the NPVR. T2WI is an important sequence for HIFU preoperative evaluation and prediction of the efficacy of uterine fibroid treatment. Although there are many reasons for a high uterine fibroid signal on T2WI, including cell richness, a rich blood supply and degeneration, it is generally recognized that in terms of uterine fibroid resistance to HIFU ablation, high T2WI signals generally occur due to rich cellular content and a rich blood supply to the fibroid. The high water content and high heat conduction efficiency of water in cellular uterine fibroids lead to less ultrasound energy deposition, reducing the curative effect. More acoustic energy loss due to blood flow in uterine fibroids with a rich blood supply decreases the temperature at the target area to a value lower than the set ablation temperature value, thus decreasing the curative effect [Citation15]. The T2WI signal classification method for uterine fibroids is currently performed using improved methods based on the Funaki classification. The most detailed method involves scaling the T2WI signal using the signals from the rectus abdominis and subcutaneous fat as a reference [Citation16]. The Funaki classification was the first proposed method and is currently the most widely used; therefore, the Funaki classification was used for T2WI signal classification in this study. We found that the NPVR of Funaki type III uterine fibroids was lower than that of Funaki type II and type I fibroids. The NPVR prediction model established by Fan [Citation17] was slightly different from that used for this study. In Fan’s prediction model, the uterine fibroid T2WI signal was the third influencing factor in the regression model; the first two were the position of the uterus and the uterine fibroid location. One possible reason for this difference is that most of the patients in this group had an anterior uterine position (87%, 187/216) and uterine fibroids located in the anterior wall (56%, 120/216).
Based on the Pennes biological heat transfer equation, the blood supply of uterine fibroids is likely one of the most important factors affecting the tissue temperature increase during HIFU treatment. The enhancement degree on CE-T1WI is the most direct and simple means for determining the blood supply of uterine fibroids. The richer the blood supply of the uterine fibroid is, the more heat is lost from the target area of ablation, resulting in an insufficient temperature rise in the uterine fibroid tissue and a lower NPVR after HIFU ablation. One study revealed that the NPVR of uterine fibroids after HIFU was negatively correlated with the degree of uterine fibroid MRI enhancement [Citation18]. Another study revealed that blood perfusion and permeability, derived from semiquantitative and quantitative parameters of dynamic contrast-enhanced (DCE)-MRI, were also negatively correlated with the NPVR. Liu Jing et al. selected the appropriate ultrasound energy according to Ktrans pseudocolour maps and achieved a good effect with HIFU for the treatment of uterine fibroids with a rich blood supply [Citation19]. In this study, the uterine fibroid enhancement degree on CE-T1WI was the second factor in the linear regression model, negatively affected the NPVR and was an independent predictor of the NPVR after HIFU. Thus, this parameter could be used as an important supplement to the T2WI signal intensity.
In this study, we found that the uterine fibroid location was also related to the NPVR. The NPVR of uterine fibroids differed according to the location, decreasing from the anterior wall to the posterior wall and the lateral wall. It is generally believed that the deeper the focus is, the greater the attenuation of ultrasonic energy will be due to the influence of the tissue on the acoustic channel prior to the focus, lowering the resulting NPVR [Citation20]. Thus, as uterine fibroids in the posterior wall are deeper and more vulnerable to the influence of the presacral plexus, the NPVR should be the lowest for uterine fibroids at this location. However, in our study, the NPVR of uterine fibroids located in the lateral wall was the lowest. We speculate that this may be due to the following: (1) 56% (120/216) of the patients in this study had anterior uterine fibroids, and the focus depth had relatively little effect on the NPVR; (2) the uterine artery supplies blood to the uterus from both sides of the uterus, and sidewall uterine fibroids are more susceptible to the effect of blood cooling; and (3) if the majority of lateral uterine fibroids are subserosal, which would place them too close to the surrounding organs (such as the bowels), to ensure patient safety during HIFU ablation, larger margins may be left from the pseudo capsule than for the other types of uterine fibroid, leading to a low NPVR. Although we did not find a significant difference in the types of lateral and posterior uterine fibroids among our data, the type of uterine fibroid remains an important factor affecting NPVR that should not be ignored.
The multiple linear regression model of the NPVR after HIFU ablation was established using the three aforementioned conventional MRI parameters with an adjusted R2 = 0.385, indicating that these three parameters can significantly explain 38.5% of the variation in the NPVR.
To further explore the complementary value of radiomics parameters in predicting NPVR after HIFU ablation of uterine fibroids, we established a multiple linear regression model by combining conventional MR parameters and screened radiomics parameters. The results showed that the above three conventional MRI parameters entered the combined model in the original order. The fourth parameter was the Size Zone Non Uniformity (SZN) derived from the Gray Level Size Zone Matrix (GLSZM) of the T2WI sequence. The larger the value of this parameter is, the greater the heterogeneity of the image [Citation21]. The results showed that the SZN had a slightly negative effect on the NPVR, with a larger SZN resulting in a smaller NPVR. Wavelet_HHH_firstorder_Skewness entered the combined model last, and the partial regression coefficient was −16.913, indicating that it negatively affected the NPVR; as wavelet_HHH_firstorder_Skewness increased, the NPVR decreased accordingly. Skewness indicates the degree of asymmetry in the distribution of the data in the histogram, where a skewness >0 indicates a positively skewed distribution, a skewness <0 indicates a negatively skewed distribution, and an increase in brighter pixels causes the histogram tail to move to the right, resulting in a positively skewed distribution [Citation22]. The distributions for wavelet_HHH_firstorder_Skewness in this group’s data were positively skewed. As the extraction of radiomics parameters in this study was based on T2WI sequences, an increase in the value of wavelet_HHH_firstorder_Skewness also represents an increase in the T2WI signal intensity. An increase in the T2WI signal usually indicates an increase in tissue water content and blood perfusion on MRI. These are the primary factors related to HIFU ablation resistance and uterine fibroid ablation difficulty. The NPVR of HIFU ablation of uterine fibroids decreases as the value of wavelet_HHH_firstorder_Skewness increases. In this study, the R2 of the combined model was larger than that of the conventional MRI model, and as the radiomics parameters were added to the proposed model, the fit of the model was slightly increased.
This study has some limitations. First, as the sample size was small, the data were not divided into training and validation groups. Second, no observer self-consistency test was performed. Third, no MR sequences other than T2WI were used for the radiomics analysis. Finally, HIFU ablation of uterine fibroids was performed by two doctors, and the difference in manipulation and proficiency between the doctors may have affected the results.
In conclusion, our preliminary study demonstrated that radiomics analysis can add value to the conventional MRI model in predicting the NPVR of HIFU ablation of uterine fibroids. In the combined prediction model, the signal intensity on T2WI, enhancement degree on CE-T1WI, uterine fibroid location, SZN and wavelet_HHH_firstorder_Skewness had a negative impact on the NPVR, and the NPVR predicted by this model correlated well with the actual NPVR. This prediction model may, therefore, have potential clinical value.
Disclosure statement
No potential conflicts of interest were reported by the author(s).
Additional information
Funding
References
- Cheung V, Lam T, Jenkins CR, et al. Efficacy and safety of ultrasound-guided high-intensity focused ultrasound for uterine fibroids: a preliminary experience. J Obstet Gynaecol. 2019;39(6):833–839.
- Rowland IJ, Rivens I, Chen L, et al. MRI study of hepatic tumours following high intensity focused ultrasound surgery. Br J Radiol. 1997;70:144–153.
- Spies JB. Sustained relief of leiomyoma symptoms by using focused ultrasound surgery. Obstet Gynecol. 2007;110(6):1427–1428.
- Fennessy FM, Tempany CM, McDannold NJ, et al. Uterine leiomyomas: MR imaging-guided focused ultrasound surgery–results of different treatment protocols. Radiology. 2007;243(3):885–893.
- Testa AC, Di Legge A, Bonatti M, et al. Imaging techniques for evaluation of uterine myomas. Best Pract Res Clin Obstet Gynaecol. 2016;34:37–53.
- Schwartz LB, Zawin M, Carcangiu ML, et al. Does pelvic magnetic resonance imaging differentiate among the histologic subtypes of uterine leiomyomata? Fertil Steril. 1998;70(3):580–587.
- Zhao WP, Chen JY, Chen WZ. Effect of biological characteristics of different types of uterine fibroids, as assessed with T2-weighted magnetic resonance imaging, on ultrasound-guided high-intensity focused ultrasound ablation. Ultrasound Med Biol. 2015;41(2):423–431.
- Funaki K, Fukunishi H, Funaki T, et al. Magnetic resonance-guided focused ultrasound surgery for uterine fibroids: relationship between the therapeutic effects and signal intensity of preexisting T2-weighted magnetic resonance images. Am J Obstet Gynecol. 2007;196(2):181–184.
- Wei C, Fang X, Wang C, et al. The predictive value of quantitative DCE metrics for immediate therapeutic response of high-intensity focused ultrasound ablation (HIFU) of symptomatic uterine fibroids. Abdom Radiol. 2018;43(8):2169–2175.
- Huang H, Ran J, Xiao Z, et al. Reasons for different therapeutic effects of high-intensity focused ultrasound ablation on excised uterine fibroids with different signal intensities on T2-weighted MRI: a study of histopathological characteristics. Int J Hyperth. 2019;36(1):476–483.
- Lakhman Y, Veeraraghavan H, Chaim J, et al. Differentiation of uterine leiomyosarcoma from atypical leiomyoma: diagnostic accuracy of qualitative MR imaging features and feasibility of texture analysis. Eur Radiol. 2017;27(7):2903–2915.
- Wang S, Zhao Z, Zhang Y, et al. Quantitative perfusion histogram parameters of dynamic contrast-enhanced MRI to identify different pathological types of uterine leiomyoma. J Zhejiang Univ. 2021;50(1):97–105.
- Andersen MB, Harders SW, Ganeshan B, et al. CT texture analysis can help differentiate between malignant and benign lymph nodes in the mediastinum in patients suspected for lung cancer. Acta Radiol. 2016;57(6):669–676.
- Keserci B, Duc NM. Magnetic resonance imaging parameters in predicting the treatment outcome of high-intensity focused ultrasound ablation of uterine fibroids with an immediate nonperfused volume ratio of at least 90. Acad Radiol. 2018;25(10):1257–1269.
- Keserci B, Duc NM. The role of T1 perfusion-based classification in magnetic resonance-guided high-intensity focused ultrasound ablation of uterine fibroids. Eur Radiol. 2017;27(12):5299–5308.
- Park H, Yoon S, Sokolov A. Scaled signal intensity of uterine fibroids based on T2-weighted MR images: a potential objective method to determine the suitability for magnetic resonance-guided focused ultrasound surgery of uterine fibroids. Eur Radiol. 2015;25(12):3455–3458.
- Fan HJ, Cun JP, Zhao W, et al. Factors affecting effects of ultrasound guided high intensity focused ultrasound for single uterine fibroids: a retrospective analysis. Int J Hyperthermia. 2018;35(1):534–540.
- Wang YJ, Zhang PH, Zhang R, et al. Predictive value of quantitative uterine fibroid perfusion parameters from contrast-enhanced ultrasound for the therapeutic effect of high-intensity focused ultrasound ablation. J Ultrasound Med. 2019;38(6):1511–1517.
- Liu J, Keserci B, Yang X, et al. Volume transfer constant (K(trans)) maps from dynamic contrast enhanced MRI as potential guidance for MR-guided high intensity focused ultrasound treatment of hypervascular uterine fibroids. Magn Reson Imaging. 2014;32(9):1156–1161.
- Gong C, Yang B, Shi Y, et al. Factors influencing the ablative efficiency of high intensity focused ultrasound (HIFU) treatment for adenomyosis: a retrospective study. Int J Hyperthermia. 2016;32(5):496–503.
- Thibault G, Fertil B, Navarro C, et al. Shape and texture indexes – application to cell nuclei classification. Int J Pattern Recognit Artif Intell. 2013;27(1):1515–1545.
- Goyal A, Razik A, Kandasamy D, et al. Role of MR texture analysis in histological subtyping and grading of renal cell carcinoma: a preliminary study. Abdom Radiol. 2019;44(10):3336–3349.