
 ?Mathematical formulae have been encoded as MathML and are displayed in this HTML version using MathJax in order to improve their display. Uncheck the box to turn MathJax off. This feature requires Javascript. Click on a formula to zoom.
Abstract
Purpose
To investigate the value of three-dimensional ultrasound fusion imaging (3DUS-FI) in real-time guiding needle placement by phantom models and in vivo simulations.
Materials and methods
Two radiologists (beginner and expert) performed needle placement using two-dimensional ultrasound (2DUS) and 3DUS-FI, respectively. In the phantom study, single-needle placement was performed by puncturing the center point of each ball and assessed based on the specimen length. Multiple-needles placement was performed by placing three needles in each ball, and their locations were confirmed by computed tomography, and assessed based on the distance deviation between needles. In the in vivo simulation study, simulated-needle placement was performed by placing a virtual ablation needle in each liver tumor and assessed by the simulated ablative cover rate and margin.
Results
Specimen length was significantly longer with 3DUS-FI in the beginner, whereas no significant difference was observed in the expert (2DUS vs. 3DUS-FI: beginner, 14.60 ± 2.60 mm vs. 16.25 ± 1.38 mm, p = .017; expert, 16.78 ± 1.40 mm vs. 16.95 ± 1.15 mm, p = .668). Distance deviation between needles was significantly smaller with 3DUS-FI (2DUS vs. 3DUS-FI: beginner, 25.06 ± 16.07 mm vs. 3.72 ± 1.99 mm, p < .001; expert, 11.70 ± 7.79 mm vs. 2.89 ± 1.52 mm, p < .001). The simulated ablative cover rate and margin were significantly larger with 3DUS-FI for the beginner, whereas only the latter was significantly larger for the expert (2DUS vs. 3DUS-FI: beginner, 73.55 ± 8.73% vs. 81.38 ± 11.84%, p = .001, 0.82 ± 0.97 mm vs. 2.65 ± 1.23 mm, p < .001; expert, 78.60 ± 9.91% vs. 83.24 ± 11.69%, p = .059; 1.65 ± 1.15 mm vs. 2.95 ± 1.13 mm, p < .001).
Conclusions
3DUS-FI is useful for real-time guiding precise needle placement and may be further use to improve the efficacy of liver thermal ablation.
Introduction
Thermal ablation therapies have been widely used to achieve high local tumor control, and ultrasonography (US) is the most commonly used guiding mode for thermal ablation, owing to its real-time guidance, high-contrast resolution, cost-effectiveness and no radiation exposure [Citation1,Citation2]. The success of thermal ablation primarily depends on precise needle placement to achieve sufficient safety margin, especially in those requiring multiple overlapping ablations [Citation3–5]. However, difficulties may occur during thermal ablation owing to US limitations. Gas bubbles can form during the first ablation. When gas bubbles form it limits tumor visibility and accurate secondary needle placement is difficult and unevaluable. Moreover, images from two-dimensional ultrasound (2DUS) are provided in a plane format, making accurate needle placement a challenging task. A certain proportion of inaccurate needle placement under 2DUS guidance has been observed in three-dimensional ultrasound (3DUS) [Citation6,Citation7]. Therefore, achieving precise needle placement with 2DUS alone sometimes remains challenging.
Although overlapping mathematic models and computer-assisted ablation planning systems have been used to guide needle placement for thermal ablation, needle placement was guided by 2DUS and they were used as references before needle placement [Citation8–12]. Computed tomography (CT) or magnetic resonance imaging (MRI)–US fusion imaging (FI) simultaneously displays real-time 2DUS images and the corresponding pre-acquired CT or MR images and was used to guide needle placement in tumors with poor visibility on 2DUS [Citation13,Citation14]. However, CT/MRI–US FI requires recent CT or MRI images before ablation, and the patient should be in the same position as when the CT or MRI images were obtained, which may not be sufficiently convenient, and most of the tumors are visible on 2DUS. Thus, considering the advantages of simple equipment, easy operation, time-saving, and high accuracy of registration, ultrasound–ultrasound (US–US) FI has been used to guide needle placement for thermal ablation [Citation15–20]. However, studies focused on using US - US FI to side-by-side compare the ablative margin for immediate assessment and guiding supplementary ablations at insufficient sites [Citation15–20]. Little attention has been paid to the use of US - US FI to real-time guide needle placement before ablation.
Therefore, we developed 3DUS-FI to real-time guide needle placement before liver thermal ablation. The present study aimed to investigate the value of 3DUS-FI in real-time guiding needle placement by phantom models and in vivo simulations.
Materials and methods
This study consisted of the phantom study and the in vivo simulation study ().
3DUS-FI
A US machine (Resona R9, Mindray, Shenzhen, China) was used with a magnetic position tracking system (3 D Guidance trakSTARTM, Ascension Technology Crop, Burlington, USA), consisting of a magnetic navigator, a magnetic field generator and a position sensor and equipped with a volume navigation system (uHIT Navi). The magnetic field generator was placed within 30 cm from the targets, and the position sensor was tightly attached to a convex probe (C6–2Gs, Mindray) through a bracket. The position sensor recognizes the spatial position and orientation of the probe when it is moved in a magnetic field and allows real-time position tracking using the magnetic navigator to display 3DUS volume images aligned with real-time 2DUS images.
The 3DUS-FI processes were described as follows:
Acquisition. 3DUS volume images of the tumor and its surrounding structures were acquired in freehand scanning mode with a slow uniform speed at the end of an expiratory or inspiratory breath.
Registration. Matching of the 3DUS volume images and real-time 2DUS images were verified. Because 3DUS volume images were acquired immediately before needle placement and the position of the phantom models and patients were fixed, they could automatically be fused with real-time 2DUS images with the aid of a magnetic position tracking system. If necessary, manual fine-tuning was required to obtain satisfactory registration.
Outline. Cross-sections of 3DUS volume images were selected based on the largest diameter dimension of the tumor in three perpendicular planes. The 5-mm safety margin of the tumor could be outlined with two concentric spheres in different colors (radius difference, 5 mm), and then the center point of the tumor could automatically be calculated and displayed. Since 3DUS volume images were acquired in the magnetic position tracking system and the 5-mm safety margin of the tumor was outlined three-dimensionally, the location and volume information of the tumor with a 5-mm safety margin were stored in 3DUS-FI.
Setting virtual ablation needle. The active tip of a virtual ablation needle could be set as a point to simulate the needle tip or as a sphere (the size is set accordingly) to simulate the ablation zone. Since the virtual ablation needle and the probe were linked by magnetic position tracking, their spatial position and orientation were consistent. With the probe’s movement, the 3D positional relationship between the virtual ablation needle and tumor could be observed in real-time. When a virtual ablation needle was placed in a certain position inside the tumor, the needle’s location could be saved in real-time.
Using 3DUS-FI for real-time guide needle placement. 3DUS-FI simultaneously displays real-time 2DUS images, 3DUS volume images, and 3D views of the coronal plane and lateral of the tumor in a screen.
Phantom study
1. Phantom models
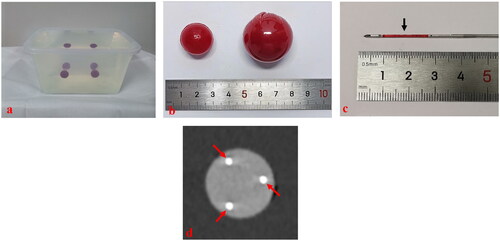
Self-design phantom models consisting of colloid and balls (mimicking liver tumors) were created and used to perform needle placement (). The materials and dosages per 1000 ml of water for the colloid included citric acid of 30 g; trisodium citrate dihydrate, 30 g; acrylamide, 80 g; N,N-methylenebisacrylamide, 5 g; L-ascorbic acid, 1 g; 3% hydrogen peroxide solution, 10 ml; and 1% ferrous sulfate heptahydrate solution, 2 ml (Damao, Tianjin, China). The materials and dosages per 1000 of mL water for the balls included agarose of 30 g (BioFroxx, Berlin, Germany); congo red, 5 g (Macklin, Shanghai, China); a gastric window contrast agent, 20 g (Dongya, Huzhou, China); and lopromide, 50 ml (Ultravist 300, Bayer, Leverkusen, Germany). The procedures of making the colloid were as follows: mixing and dissolving all materials with water and waiting for 30 min to solidify. The procedures of making the balls were as follows: mixing and dissolving all materials with water and heating to boil and then injecting into spherical molds (20 mm and 30 mm in diameter); taking out after cooling and wrapping the balls (30 mm in diameter) by the film (). The colors and textures between the balls and colloids were different; therefore, the specimen length of the balls could be measured accurately (). The balls inside the colloid could be well defined on the US and CT (). The depth of the balls from the surface was approximately 10 cm.
Figure 1. The flowchart shows the study protocol. 2DUS: two-dimensional ultrasound; 3DUS-FI: three-dimensional ultrasound fusion imaging.
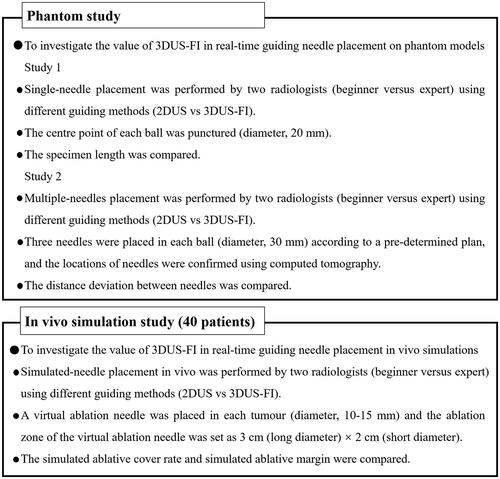
Figure 2. These photographs show the phantom models used to perform needle placement. (a) A phantom model consisted of colloid (colorless) and balls mimicking liver tumors (red). (b) A ball (20 mm in diameter) was used to perform a single-needle placement, and a ball (30 mm in diameter) was used to perform multiple-needles placement. Wrap the ball with film to prevent lopromide infiltration that may cause poor computed tomography (CT) scan. (c) The red stripe (arrow) inside the biopsy needle groove was a specimen after puncturing the center point of the ball. (d) A CT image after multiple-needles placement. The round, high echo was the largest coronal plane of the ball (30 mm in diameter) and the strong echo (arrows) were the points where the three needles passed through the largest coronal plane of the ball.
2. Study design
A beginner (with 1 year of experience in the interventional US) and an expert (with >8 years of experience in the interventional US) performed needle placement on phantom models guided by 2DUS and 3DUS-FI, respectively. Needle placement was performed using the 2DUS first. Single-needle placement was performed by puncturing the center point of each ball (20 mm in diameter), and an adjustable biopsy gun (MG1522, BARD Magnum, AZ) with an 18-G biopsy needle was used. Multiple-needles placement was performed by placing three needles in each ball (30 mm in diameter) based on a pre-determined plan, and cool-tip single electrodes (Cool-tip RF Ablation System, Covidien, Boulder, CO) were used. After multiple-needles placement, phantom models were sent for CT scan using an AquilionTM 64-slice helical CT machine (Toshiba, Tokyo, Japan). A total of 80 balls (20 mm in diameter) for single-needle placement and 80 balls (30 mm in diameter) for multiple-needles placement were created and randomly divided into 2DUS (n = 40, n = 40) and 3DUS-FI (n = 40, n = 40) groups. With each guiding method, the beginner and expert performed single-needle placement 20 times and multiple-needles placement 20 times, respectively. Needle placement on phantom models guided by 3DUS-FI is shown in .
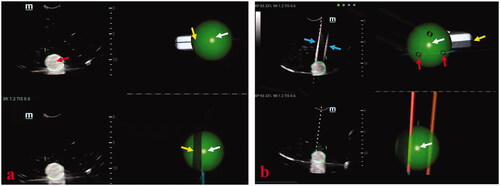
Figure 3. These photographs show needle placement on phantom models guided by three-dimensional ultrasound fusion image (3DUS-FI). Real-time two-dimensional ultrasound (2DUS) images (upper left), three-dimensional ultrasound (3DUS) volume images (lower left), 3 D views of the coronal plane (upper right) and lateral (lower right) of the ball were simultaneously displayed on a screen. The green balls and bright dots (white arrows) in 3 D views were 3 D displays of the ball and its center point based on magnetic position tracking. (a) With the probe’s movement, the 3 D positional relationship between real-time 2DUS images and the ball could be directly observed in 3 D views (yellow arrows). The largest plane and the center point of the ball (red arrow) could be observed in real-time to guide needle placement by moving the probe to make real-time 2DUS images toward the center points (white arrows) in 3 D views. (b) The virtual ablation needle and the probe were linked by magnetic position tracking. With the probe’s (yellow arrow) movement, the 3 D positional relationship between virtual ablation needles (red arrows) and the ball could be observed in 3 D views. Needle positions that had been placed inside the ball (blue arrows) could real-time be saved in 3 D views (red arrows), which provided important information for multiple-needles placement.
3. Data analysis
The specimen length of puncturing the center point of each ball (20 mm in diameter) was used to assess the accuracy of single-needle placement (). After each single-needle placement, the red strip length inside the biopsy needle groove was measured by two assistants, and the specimen length was defined as the average of the two measurements. Distance deviation between needles was used to assess the accuracy of multiple-needles placement performed by placing three needles in each ball (30 mm in diameter) and then a triangle could be formed by three points where three needles passed through the largest coronal plane of the ball (). Successful multiple-needles placement was defined as the center point of the largest coronal plane inside the triangle, whereas unsuccessful multiple-needles placement was defined as the center point of the largest coronal plane outside the triangle. The three-side lengths of the triangle were actual distances among needles and were marked with a, b and c (). The pre-determined plan of multiple-needles placement was placing three needles in a ball (30 mm in diameter), and an ideal equilateral triangle could be formed by three points where the three needles passed through the largest coronal plane of the ball. Based on the design and calculation, the side length of the ideal equilateral triangle was cm; therefore, the ideal distance among needles was
cm (). Distance deviation among needles was a quantitative term to assess the deviation degree in the actual distance among needles and the ideal distance among needles. Therefore, taking variance for reference, distance deviation among needles was calculated as [(a-
)2+(b-
)2+(c-
)2]/3. The actual distance among needles was reviewed and measured using the Digital Imaging and Communications in Medicine (DICOM) image data obtained from CT scan by RadiAnt DICOM ViewerTM software (Medixant, Poznán, Poland).
Figure 4. Photographs show assessments of needle placement performed on phantom models. (a) The specimen length (black arrows) of puncturing the center point (white arrow) of a ball (20 mm in diameter) was used to assess the accuracy of the single-needle placement. The longer the length of the specimen, the puncturing point was closer to the center point of the ball and the accuracy of single-needle placement higher. (b) When three needles were placed in a ball (30 mm in diameter), a triangle was formed from the three points where the three needles passed through the largest coronal plane of the ball. (c) The three side lengths of the triangle were actual distances between needles and marked with a, b, and c. Successful multiple-needles placement was defined as the center point of the largest coronal plane inside the triangle. (d) The pre-determined plan of multiple-needles placement was placing three needles in a ball (30 mm in diameter) and the three points where the three needles passed through the largest coronal plane of the ball forming an ideal equilateral triangle with the side length of cm. Therefore, the ideal distance between needles was
cm. Distance deviation between needles was a quantitative term to assess the deviation degree of the actual distance between needles and the ideal distance between needles and was used to assess the accuracy of multiple-needles placement. Thus, considering this variance for reference, distance deviation between needles was calculated as [(a-
)2+(b-
)2+(c-
)2]/3. The smaller the distance deviation between needles, the closer the multiple-needles placement was to the pre-determined plan and the higher the accuracy of multiple-needles placement.
![Figure 4. Photographs show assessments of needle placement performed on phantom models. (a) The specimen length (black arrows) of puncturing the center point (white arrow) of a ball (20 mm in diameter) was used to assess the accuracy of the single-needle placement. The longer the length of the specimen, the puncturing point was closer to the center point of the ball and the accuracy of single-needle placement higher. (b) When three needles were placed in a ball (30 mm in diameter), a triangle was formed from the three points where the three needles passed through the largest coronal plane of the ball. (c) The three side lengths of the triangle were actual distances between needles and marked with a, b, and c. Successful multiple-needles placement was defined as the center point of the largest coronal plane inside the triangle. (d) The pre-determined plan of multiple-needles placement was placing three needles in a ball (30 mm in diameter) and the three points where the three needles passed through the largest coronal plane of the ball forming an ideal equilateral triangle with the side length of 3 cm. Therefore, the ideal distance between needles was 3 cm. Distance deviation between needles was a quantitative term to assess the deviation degree of the actual distance between needles and the ideal distance between needles and was used to assess the accuracy of multiple-needles placement. Thus, considering this variance for reference, distance deviation between needles was calculated as [(a-3)2+(b-3)2+(c-3)2]/3. The smaller the distance deviation between needles, the closer the multiple-needles placement was to the pre-determined plan and the higher the accuracy of multiple-needles placement.](/cms/asset/8f7a9535-f24b-46fe-8a69-e8d885baeb75/ihyt_a_2057596_f0004_c.jpg)
In vivo simulation study
1. Patients
The study was approved by the ethics committee of the First Affiliated Hospital of Sun Yat-sen University (approval No. [2016] 213) and performed in compliance with the Declaration of Helsinki. Informed consent for using the patients’ clinical data was obtained from all participants. A total of 40 patients with liver tumors successfully underwent simulated-needle placement guided by 2DUS and 3DUS-FI between May and October 2021. The inclusion criteria were (1) patients who were ready to accept ablation treatment in our hospital and with the maximum tumor diameter of 10–15 mm; (2) the tumor visualized on 2DUS; and (3) the patient’s ability to cooperate with the operator for respiratory control was good. The exclusion criteria were (1) tumors with indistinct border or irregular shape and (2) tumors obscured by the ribs and 3DUS volume images could not be obtained by one freehand scanning.
2. Study design
The beginner and the expert performed simulated-needle placement in liver tumors with the guidance of 2DUS and 3DUS-FI, respectively. All patients underwent respiratory training before the study. Simulated-needle placement was performed using 2DUS first. The processes of simulated-needle placement guided by 2DUS were described as follows: (1) The location and volume information of the tumor with a 5-mm safety margin was obtained using 3DUS-FI. An active tip of the virtual ablation needle was set as a sphere sized 3 cm (long diameter) × 2 cm (short diameter) to simulated the ablation zone. (2) 3DUS-FI was withdrawn and simulated-needle placement with the 2DUS guidance was performed. When the patient held the breath at the same respiratory phase of acquiring 3DUS volume images of the tumor, the operator decided the largest plane and the center point of the tumor, and then, a virtual ablation needle was placed. The position of the placed virtual ablation needle was saved in 3DUS-FI in real-time. (3) Results of the simulated-needle placement guided by 2DUS were reviewed by two radiologists using 3DUS-FI for consensus. Simulated-needle placement guided by 3DUS-FI was performed following the 3DUS-FI processes. Simulated-needle placement guided by 3DUS-FI is shown in .
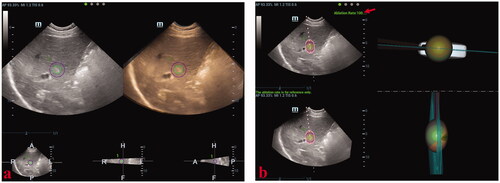
Figure 5. These photographs show simulated-needle placement performed in a liver tumor with the largest diameter of 10 mm by three-dimensional ultrasound fusion image (3DUS-FI). (a) The safety margin of the tumor of 5 mm was outlined for 3 D tracing by two concentric spheres in different colors (the radius difference was 5 mm). Real-time two-dimensional ultrasound (2DUS) images (left) and three-dimensional ultrasound (3DUS) volume images (right) were registered efficiently. (b) Real-time 2DUS images (upper left), 3DUS volume images (lower left), three-dimensional (3 D) views of the coronal plane (upper right) and lateral (lower right) of the tumor were simultaneously displayed on a screen. When the patient held the breath at the end of inspiration (with the same respiratory phase while acquiring 3DUS volume images of the tumor), the largest plane and the real-time center point of the tumor could be observed to guide needle placement. The virtual ablation needle was placed at the center of the tumor to achieve complete overlapping between the ablation zone and the tumor with a 5-mm safety margin. When the virtual ablation needle was placed, the simulated ablative cover rate was automatically displayed on the screen in real-time (red arrow).
3. Data analysis
Simulated ablative cover rate and ablative margin were used to assess the accuracy of simulated-needle placement. The simulated ablative cover rate was defined as the percentage of the ablation zone of the virtual ablation needle completely covered the tumor with 5-mm safety margin. The simulated ablative margin was defined as the ablative margin that could be achieved after the ablation zone of the virtual ablation needle completely covered the tumor.
Statistical analysis
Continuous variables were presented as means and standard deviations. Comparison of the specimen length, distance deviation among needles, simulated ablative cover rate and simulated ablative margin obtained using different guiding methods or from different operators were performed by two independent sample t-tests. Statistical analysis was performed using the Statistical Package for the Social Sciences 22.0 (SPSS Inc., Chicago, IL).
Results
Results of the specimen length and distance deviation between needles are demonstrated in and . For the beginner, the specimen length obtained using 3DUS-FI was significantly longer than that obtained using 2DUS, whereas, for the expert, no significant difference of the specimen length was observed between 2DUS and 3DUS-FI (2DUS vs. 3DUS-FI: beginner, 14.60 ± 2.60 mm vs. 16.25 ± 1.38 mm, p = .017; expert, 16.78 ± 1.40 mm vs. 16.95 ± 1.15 mm, p = .668). The specimen length of the beginner was significantly shorter than that of the expert when using 2DUS for guidance, whereas no significant difference was observed when using 3DUS-FI (beginner vs. expert: 2DUS, 14.60 ± 2.60 mm vs. 16.78 ± 1.40 mm, p = .002; 3DUS-FI, 16.25 ± 1.38 mm vs. 16.95 ± 1.15 mm, p = .089). Successful rates of multiple-needles placement by the beginner and expert were 80% (16/20) and 90% (18/20), respectively, with 2DUS and 100% (20/20) with 3DUS-FI. The distance deviation between needles in the beginner and expert was significantly smaller when using 3DUS-FI for guidance (2DUS vs. 3DUS-FI: beginner, 25.06 ± 16.07 mm vs. 3.72 ± 1.99 mm, p < .001; expert, 11.70 ± 7.79 mm vs. 2.89 ± 1.52 mm, p < .001). The deviation between needles of the beginner was significantly larger than that of the expert when using 2DUS for guidance, whereas no significant difference was observed when using 3DUS-FI (beginner vs. expert: 2DUS, 25.06 ± 16.07 mm vs. 11.70 ± 7.79 mm, p = .004; 3DUS-FI, 3.72 ± 1.99 mm vs. 2.89 ± 1.52 mm, p = .144).
Table 1. Results of single-needle placement performed on phantom models.
Table 2. Results of multiple-needles placement performed on phantom models.
A total of 40 liver tumors (23 hepatocellular carcinomas and 17 metastatic liver cancers) in 40 patients (25 men, 15 women; age range, 18–73; mean ± SD, 55.05 ± 14.13 years) were enrolled in this study. The median tumor diameter was 13.5 mm (mean ± SD, 12.9 ± 2.05 mm). The simulated ablative cover rate and simulated ablative margin are demonstrated in . For the beginner, the simulated ablative cover rate and simulated ablative margin obtained using 3DUS-FI were significantly higher than that obtained using 2DUS (2DUS vs. 3DUS-FI: 73.55 ± 8.73 mm vs. 81.38 ± 11.84 mm, p = .001; 0.82 ± 0.97 mm vs. 2.65 ± 1.23 mm, p < .001). For the expert, the simulated ablative margin obtained using 3DUS-FI was significantly larger than that obtained using 2DUS (2DUS vs. 3DUS-FI: 1.65 ± 1.15 mm vs. 2.95 ± 1.13 mm, p<.001), whereas for the expert, no significant difference of the simulated ablative cover rate was observed between 2DUS and 3DUS-FI (2DUS vs. 3DUS-FI: 78.60 ± 9.91 mm vs. 83.24 ± 11.69 mm, p = .059). The simulated ablative cover rate and simulated ablative margin of the beginner were significantly smaller than that of the expert when using 2DUS for guidance, whereas no significant difference was observed when using 3DUS-FI (beginner vs. expert: 2DUS, 73.55 ± 8.73% vs. 78.60 ± 9.91%, p = .018, 0.82 ± 0.97 mm vs. 1.65 ± 1.15 mm, p = .001; 3DUS-FI, 81.38 ± 11.84% vs. 83.24 ± 11.69%, p = .482, 2.65 ± 1.23 mm vs. 2.95 ± 1.13 mm, p = .260).
Table 3. Results of simulated-needle placement performed in patients (n = 40).
Discussion
In this study, 3DUS-FI was useful for real-time guiding precise needle placement in phantom models and in vivo simulations. 3DUS-FI facilitates optimal needle placement to achieve better ablative coverage and ablative margin. Thus, 3DUS-FI may be expected for further use in clinical practice to improve the efficacy of liver thermal ablation.
Precise needle placement for thermal ablation is important to achieve the primary success of complete ablation, decrease ablation sessions, and reduce the risk of local tumor progression [Citation1,Citation3–5]. For small tumors that allows the destruction of the entire tumor and a safe margin in a single application, operators place the ablation needle at the center of the tumor under US guidance. In our study, single-needle placement was performed by puncturing the center points of the balls using a biopsy needle and was assessed by measuring the specimen length. The longer length of the specimen indicated a closer puncturing point to the center point of the ball. Therefore, placing a needle at the center of the tumor could be quantitatively assessed. Accurately positioning the largest plane and puncturing the center point of the tumor is very important for successful needle placement during thermal ablation. In our study, although no significant differences in the specimen length and simulated ablative cover rate were observed between 2DUS and 3DUS-FI for the expert, the simulated ablative margin obtained using 3DUS-FI was significantly larger than that obtained using 2DUS. Thus, our results supported that inaccurate positioning of the largest plane and center point of the tumor might cause insufficient ablative margin, especially for thermal ablation with a single application. With the probe’s movement, the 3 D positional relationship between real-time 2DUS images and the tumor could be directly observed, and the largest plane and the center point of the tumor could be visualized in real-time to needle placement when using 3DUS-FI for guidance. Thus, through real-time guidance of the largest plane and the center point of the tumor, 3DUS-FI facilitates optimal single-needle placement to achieve better ablative coverage and ablative margin.
For larger tumors that require multiple overlapping ablations to destroy the entire tumor and obtain a safe margin, the operators place multiple needles inside the tumor with a safety margin three-dimensionally depending on their experience under US guidance. In our study, a pre-determined plan of multiple-needles placement was designed, and distance deviation between needles was used to assess the accuracy of multiple-needles placement. The pre-determined plan was to perform the optimal multiple-needles placement with the three ideal distances between needles of cm. Therefore, multiple-needles placement was performed based on the pre-determined plan as much as possible to obtain the ideal distance between needles of
cm. Distance deviation between needles was designed as a quantitative term to assess the deviation degree between the actual and ideal distance between needles and was calculated by considering all three distances between needles into consideration. The smaller distance deviation between needles indicated closer multiple-needles placement to the pre-determined plan. Thus, the accuracy of multiple-needles placement could be quantitatively assessed. In this study, distance deviation between needles in both the beginner and expert was significantly smaller when using 3DUS-FI for guidance. Our results supported that performing multiple-needles placement to obtain the ideal overlapping ablation zones was more challenging [Citation3,Citation5,Citation21]. However, when compared with 2DUS guidance, the distance deviation between needles was significantly shorter from 25.06 ± 16.07 mm to 3.72 ± 1.99 mm (p < .001) in the beginner and from 11.70 ± 7.79 mm to 2.89 ± 1.52 mm (p < .001) in the expert when using 3DUS-FI for guidance. Thus, 3DUS-FI is useful for guiding optimal multiple-needles placement. First, the 3 D positional relationship between the needle and tumor could be real-time observed in 3DUS-FI. Moreover, the 3 D view of the coronal plane plays an important role in visualizing the sites of needle insertion in the coronal direction. Studies found that additional information primarily obtained from a reconstructed coronal view with 3DUS, which was unavailable with 2DUS, frequently result in needle reposition and additional puncturing [Citation6,Citation7,Citation20]. Second, 3DUS-FI provides real-time feedback. The needle positions that had been placed inside the tumor could real-time be saved in 3DUS-FI, which provided important information for multiple-needles placement.
In our study, the accuracy rate of needle placement performed by the beginner was significantly lower than that by the expert when using 2DUS for guidance, whereas no significant difference was observed when using 3DUS-FI for guidance. Ronnie et al. found that the operator’s experience played an important role in determining complete ablation achievement and suggested that radiofrequency ablation for liver tumors should be performed by clinicians with adequate knowledge and experience [Citation22]. Treatment efficacy in needle-based procedures is strongly dependent on the accuracy of needle placement, and therefore, 3DUS-FI might be useful in decreasing variations among operators and further shortening the learning curve.
This study has several limitations. First, the tumor and its virtual ablative margin were outlined with spheres. Irregularly shaped tumors are common, and the margin of the irregular tumor should be outlined by depicting its contours in three axial planes for clinical applications. However, the tumors were outlined with spheres based on the largest diameter dimension in three perpendicular planes in this study, which ensured a completely consistent tumor volume among different guidance and operators. Second, simulated multiple-needles placement was not performed in in vivo simulations. The influence of the thermal effect caused by multiple needles has not been simulated in 3DUS-FI, and multiple overlapping ablations involved complex mathematical issues for coverage that would increase the complexity in this study [Citation8,Citation23]. Thus, performing a single simulated-needle placement may be more suitable for our study purpose, and the simulation of multiple needle applications should be developed within 3DUS-FI. Third, this is a preliminary study aimed at investigating the value of using 3DUS-FI in real-time guiding needle placement by phantom models and in vivo simulations. Further 3DUS-FI improvements based on clinical applications and further studies to investigate the effectiveness of using 3DUS-FI in real-time guiding needle placement for liver thermal ablation in clinical settings are warranted.
In conclusion, 3DUS-FI is useful for real-time guiding precise needle placement and may be further used to improve the efficacy of liver thermal ablation.
Disclosure statement
The authors report there are no competing interest to declare.
Additional information
Funding
References
- Ahmed M, Brace CL, Lee FT, Jr., et al. Principles of and advances in percutaneous ablation. Radiology. 2011;258(2):351–369.
- Lorentzen T, Nolsøe CP, Ewertsen C, EFSUMB, et al. EFSUMB guidelines on interventional ultrasound (INVUS), part I. general aspects (long version). Ultraschall Med. 2015;36(5):E1–E14.
- McGhana JP, Dodd GD. 3rd. Radiofrequency ablation of the liver: current status. AJR Am J Roentgenol. 2001;176(1):3–16.
- Kim YS, Lee WJ, Rhim H, et al. The minimal ablative margin of radiofrequency ablation of hepatocellular carcinoma (> 2 and < 5 cm) needed to prevent local tumor progression: 3D quantitative assessment using CT image fusion. AJR Am J Roentgenol. 2010;195(3):758–765.
- Park MJ, Kim YS, Rhim H, et al. A comparison of US-guided percutaneous radiofrequency ablation of medium-sized hepatocellular carcinoma with a cluster electrode or a single electrode with a multiple overlapping ablation technique. J Vasc Interv Radiol. 2011;22(6):771–779.
- Rose SC, Hassanein TI, Easter DW, et al. Value of three-dimensional US for optimizing guidance for ablating focal liver tumors. J Vasc Interv Radiol. 2001;12(4):507–515.
- Xu HX, Yin XY, Lu MD, et al. Usefulness of three-dimensional sonography in procedures of ablation for liver cancers: initial experience. J Ultrasound Med. 2003;22(11):1239–1247.
- Dodd GD, 3rd, Frank MS, Aribandi M, et al. Radiofrequency thermal ablation: computer analysis of the size of the thermal injury created by overlapping ablations. AJR Am J Roentgenol. 2001;177(4):777–782.
- Chen MH, Yang W, Yan K, et al. Large liver tumors: protocol for radiofrequency ablation and its clinical application in 110 patients-mathematic model, overlapping mode, and electrode placement process. Radiology. 2004;232(1):260–271.
- Liu F, Liang P, Yu X, et al. A three-dimensional visualisation preoperative treatment planning system in microwave ablation for liver cancer: a preliminary clinical application. Int J Hyperthermia. 2013;29(7):671–677.
- Li K, Su Z, Xu E, et al. Computer-Assisted hepatocellular carcinoma ablation planning based on 3-D ultrasound imaging. Ultrasound Med Biol. 2016;42(8):1951–1957.
- Zhang D, Liang W, Zhang M, et al. Multiple antenna placement in microwave ablation assisted by a three-dimensional fusion image navigation system for hepatocellular carcinoma. Int J Hyperthermia. 2019;35(1):122–132.
- Nakai M, Sato M, Sahara S, et al. Radiofrequency ablation assisted by real-time virtual sonography and CT for hepatocellular carcinoma undetectable by conventional sonography. Cardiovasc Intervent Radiol. 2009;32(1):62–69.
- Song KD, Lee MW, Rhim H, et al. Fusion imaging-guided radiofrequency ablation for hepatocellular carcinomas not visible on conventional ultrasound. AJR Am J Roentgenol. 2013;201(5):1141–1147.
- Park HJ, Lee MW, Rhim H, et al. Percutaneous ultrasonography-guided radiofrequency ablation of hepatocellular carcinomas: usefulness of image fusion with three-dimensional ultrasonography. Clin Radiol. 2015;70(4):387–394.
- Minami Y, Minami T, Chishina H, et al. US-US fusion imaging in radiofrequency ablation for liver metastases. Dig Dis. 2016;34(6):687–691.
- Xu EJ, Lv SM, Li K, et al. Immediate evaluation and guidance of liver cancer thermal ablation by three-dimensional ultrasound/contrast-enhanced ultrasound fusion imaging. Int J Hyperthermia. 2018;34(6):870–876.
- Minami Y, Minami T, Hagiwara S, et al. Ultrasound-ultrasound image overlay fusion improves real-time control of radiofrequency ablation margin in the treatment of hepatocellular carcinoma. Eur Radiol. 2018;28(5):1986–1993.
- Minami Y, Minami T, Takita M, et al. Radiofrequency ablation for hepatocellular carcinoma: Clinical value of ultrasound-ultrasound overlay fusion for optimal ablation and local controllability. Hepatol Res. 2020;50(1):67–74.
- Hirooka M, Koizumi Y, Tanaka T, et al. Efficacy of combining electric-field and coronal-plane imaging to obtain ultrasound-ultrasound fusion images in monopolar radiofrequency ablation for patients with liver cancer. Hepatol Res. 2020;50(8):985–995.
- Livraghi T, Goldberg SN, Lazzaroni S, et al. Hepatocellular carcinoma: radio-frequency ablation of medium and large lesions. Radiology. 2000;214(3):761–768.
- Poon RT, Ng KK, Lam CM, et al. Learning curve for radiofrequency ablation of liver tumors: prospective analysis of initial 100 patients in a tertiary institution. Ann Surg. 2004;239(4):441–449.
- Rieder C, Kröger T, Schumann C, et al. GPU-based real-time approximation of the ablation zone for radiofrequency ablation. IEEE Trans Vis Comput Graph. 2011;17(12):1812–1821.