
 ?Mathematical formulae have been encoded as MathML and are displayed in this HTML version using MathJax in order to improve their display. Uncheck the box to turn MathJax off. This feature requires Javascript. Click on a formula to zoom.
Abstract
Thermal dose models are metrics that quantify the thermal effect on tissues based on the temperature and the time of exposure. These models are used to predict and control the outcome of hyperthermia (up to 45°C) treatments, and of thermal coagulation treatments at higher temperatures (>45°C). The validity and accuracy of the commonly used models (CEM43) are questionable when heating above the hyperthermia temperature range occurs, leading to an over-estimation of the accumulation of thermal damage. A new CEM43 dose model based on an Arrhenius-type, Vogel-Tammann-Fulcher, equation using published data, is introduced in this work. The new dose values for the same damage threshold that was produced at different in-vivo skin experiments were in the same order of magnitude, while the current dose values varied by two orders of magnitude. In addition, the dose values obtained using the new model for the same damage threshold in 6 lesions in ex-vivo liver experiments were more consistent than the current model dose values. The contribution of this work is to provide new modeling approaches to inform more robust thermal dosimetry for improved thermal therapy modeling, monitoring, and control.
1. Introduction
Quantifying the amount of thermal damage in biological systems based on thermal exposure (time and temperature of exposure) has been an active area of research for many decades [Citation1–4]. Earlier, these studies focused mainly on skin burns [Citation1,Citation2,Citation5]. The importance of heat-induced tissue damage studies increased with the use of heat in cancer treatments. The prediction of thermal damage incurred during or after treatment is essential for treatment planning, monitoring, and post-treatment assessment. The concept of a thermal dose is used for this purpose. The thermal dose is meant not merely to be a measure of the amount of energy delivered. Instead, it is meant to be a measure of the amount of tissue damage caused by heat. Heating has been investigated as an adjuvant to other forms of therapy, including radiation therapy and chemotherapy [Citation6,Citation7]. Controlled and mediated heating [Citation8] can be used to activate drug release using thermosensitive liposomes [Citation9]. Heating has also been used to speed up healing of injuries, and act as a surgical ‘scalpel’ to coagulate or ablate tissue [Citation10]. Therefore an ideal thermal dose model would be applicable to various thermal processes and biological end-points.
Thermal damage, or heat-induced cell death, is believed to be caused by protein denaturation, for the range of temperatures used in thermal therapy [Citation11–13]. The first thermal dose model known as the Arrhenius model was introduced by Henriques in 1947 [Citation2] based on rate process analysis. In this model, thermal damage is quantified by a single parameter (denoted by Ω) which depends on the time-temperature profile and two tissue-dependent parameters that are experimentally determined for each type of tissue. Henriques found the parameters based on in vivo experiments for both porcine and human skin [Citation1]. In those experiments, time-temperature combinations to achieve the same thermal damage end-point were obtained. The Arrhenius parameters reported for other tissue types from subsequent studies are significantly different [Citation14], which is a challenge with using the Arrhenius dose model.
Sapareto and Dewey [Citation3] introduced another thermal dose model, which we refer to here as the CEM43 model, that quantified damage by the equivalent exposure time at some reference temperature. Although it was derived from empirical observations, they showed it to be a good approximation to the Arrhenius model in a limited temperature range. 43°C was chosen as the reference, where all thermal exposures are converted to an equivalent time, t43, at this temperature. The formula that converts a time-temperature profile to a t43 value was based on many experimental observations of different biological systems [Citation1,Citation15,Citation16]. In most biological systems, a 1°C increase in temperature requires half the time for the same effect above 43°C and one-fourth of the time below 43°C. This relationship is independent of the biological end-point and tissue type. Hence, the CEM43 model can be used for different tissue types without the need to obtain tissue-specific parameters; nevertheless, dose-value thresholds to achieve a certain damage endpoint need to be known for different types of tissue. This simplicity, has led to its wide adoption for dose calculations in thermal therapy applications [Citation17–21]. The current CEM43 model was originally developed for traditional hyperthermia applications (temperatures up to 45°C). The validity and accuracy of this model for high-temperature applications (above the hyperthermia temperature range) has remained uncertain.
While the CEM43 model is simpler than the Arrhenius model because its unit of thermal dose is more clinically relevant and it does not require the determination of tissue-specific parameters to calculate the dose, its applicability to higher temperature exposures is uncertain. After introducing the CEM43 model, several publications presented alternative thermal dosimetry based on modified Arrhenius models or by linking Arrhenius and CEM43 models [Citation22–25]. Nonetheless, thermal dosimetry is a challenging metric that requires further improvements. An examination of the accuracy of the CEM43 model at higher temperatures is presented here. Additionally, an alternative to the Arrhenius model, called the Arrhenius-VTF model is considered for thermal dose calculations. A mathematical relation between these Arrhenius-type models and the CEM43 model is presented, which leads to a new CEM43-type model, called the CEM43-VTF model. Finally, the performance of the new CEM43-VTF model is compared to the performance of the CEM43 and Arrhenius models for various biological applications of heat.
2. Theory
The CEM43 model and the Arrhenius model are described below followed by the Arrhenius-VTF model and a mathematically unification of the three models. This leads to a thermal dose equation for the new CEM43-VTF model. Finally a reformulation of the three models for the special case of constant temperature heating is provided, which allows them to be bench-marked against published heating results.
2.1. The CEM43 model
The most commonly used thermal dose model, CEM43, is based on the Sapareto-Dewey relationship [Citation3] that quantifies thermal dose in terms of the equivalent amount of time needed at a constant 43°C to get the same thermal effect. This is an approximation to the Arrhenius model and is given by
(1)
(1)
where T is the time-varying temperature (in °C) during a treatment of duration τ. C = 4 when
and C = 2 for
2.2. The Arrhenius model
A commonly used dose mode is based on Arrhenius analysis of reactions [Citation26], is the Arrhenius model [Citation1,Citation2]. In this model thermal damage is modeled as a first-order rate process in which tissue constituents transform from native state to damaged state with a reaction velocity (or rate constant), k [Citation2,Citation11]. The dependence of k on temperature can be described by the Arrhenius equation [Citation26]:
(2)
(2)
Using this assumption the thermal dose, is
(3)
(3)
where
is the concentration of the native tissue at a heating duration of τ (making N(0) the concentration of native tissue prior to heating), A is a frequency factor,
is the activation energy, and R is the universal gas constant.
2.3. The Vogel-Tammann-Fulcher model
Herein, we propose and investigate the use of a modified (and more general) Arrhenius-like model, known as the Vogel-Tammann-Fulcher [Citation27–29] (Arrhenius-VTF) model for thermal dose,
(4)
(4)
where where
is a frequency factor, a is a parameter related to a temperature-dependent activation energy [Citation30–32], and T0 is the temperature where the damage process can no longer be thermally activated. This means that the rate constant k = 0 for temperatures below T0; therefore, there is no dose accumulation below this temperature.
2.4 A Unified thermal dose equation
The equations in all three dose models can be generalized to a form where the amount of thermal damage, D, depends exponentially and cumulatively on temperature,
(5)
(5)
The pre-integral factor for the CEM43 model is α = 1, while it is in the Arrhenius model, and
for the Arrhenius-VTF mode. The exponent for each model is,
The dose at constant for a duration t43 can be equated to the dose for an arbitrary thermal treatment,
(7)
(7)
where
is the value of β at
This yields a generalized CEM43-type equation
(8)
(8)
Substituting (6c) in (8), yields the CEM43-type version of the Arrhenius-VTF model:
(9)
(9)
is used instead of t43 to differentiate the dose values calculated using the two CEM43-type models. EquationEquation (9)
(9)
(9) is hereafter referred to as the CEM43-VTF model.
2.5. Parameter fitting plots
The constant parameters in the dose models can be obtained using well controlled experiments that heat at various constant temperatures for various durations. This is done using special temperature-time plots, that are slightly different for CEM43 models compared to Arrhenius models.
2.5.1. CEM43 plots
For the special case of a treatment performed for a duration, τ, at some constant temperature, T, and if the amount of damage at this temperature is the same as the damage incurred at a constant 43°C after a duration of then,
(10)
(10)
This results in the relationship,
(11)
(11)
A plot of versus T can be used to fit each model to experimental data using Equations (6a), (6b), or (6c).
2.5.2. Arrhenius plots
In order to use this model for a certain tissue type, one needs to experimentally find the coefficients A and Ea for that tissue. This can be done using a series of heating experiments that produce the same amount of thermal damage (which is defined to correspond to Ω = 1 [Citation2,Citation33–35]). Since the heating is at a constant temperature, Equationequation (2)(2)
(2) can simplified to
(12)
(12)
A plot of versus
can be used to obtain the activation energy, Ea, from the slope of the plot, and A its y-intercept for the basic Arrhenius model. Similarly, for the Arrhenius-VTF one can reach an Arrhenius-VTF analogue:
(13)
(13)
From a plot of versus
one can find a and
from the slope and the y-intercept, respectively. It should be noted that the process-based temperature, T0, that replaces the absolute zero in the Arrhenius model, has to be known in order to do this fitting.
3. Methods
3.1. Fitting the models to published results
Four published data sets from four different experiments were considered. Each of them provides the exposure time, τ, at different constant temperatures, T, needed to achieve a certain isothermal effect. Three of the experiments were carried out in vitro by different groups [Citation36–38] and reported by Henle and Dethlefsen [Citation16]. The fourth was done in vivo [Citation1]. The equations to be fit to the results all require the heating time at 43°C, Since the fourth experiment starts at 44°C,
was extrapolated from the other data points. The other three experiments had measurements at 43°C heating.
3.2. Epidermal injury
In their work titled ‘Studies of thermal injury’ in 1947, Moritz and Henriques tried to find information about the rate at which skin burning occurred at any given surface temperature. They gained time-temperature thresholds resulting in different levels of skin injuries. They did their experiments in vivo for both porcine and human skin. Experiments were done at constant temperatures. The skin surface was immediately brought to and maintained at a predetermined constant temperature using an applicator by which a running stream of temperature-controlled water was brought in direct contact with the skin [Citation1]. In introducing the Arrhenius based dose calculations, Henriques used two of the epidermal injury thresholds: ‘threshold A’ and ‘threshold B’ [Citation2]. Threshold A was used to produce one of the data sets used in . This threshold represents the minimum exposure time resulting in complete transepidermal necrosis. Threshold B represents the maximum exposure time resulting in reversible epidermal injury. Threshold B was used to test the CEM43 model as shown in in the results.
Figure 1. Relative time-temperature relationship for different experimental data. The blue dotted line is the fit based on Arrhenius equation, the solid red line is a fit based on VTF equation, while the black dashed line is the relation on which the current CEM43 model is based. The numbers in the square brackets in the legend cite the publications where the respective data points were obtained from.
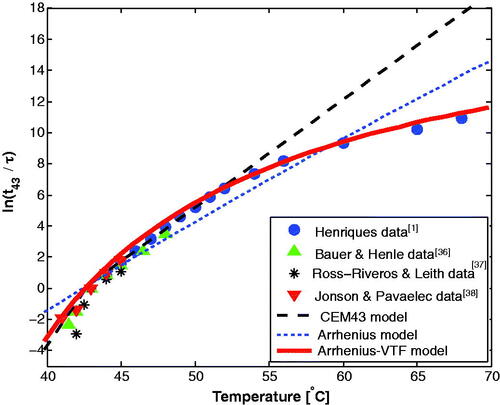
Figure 2. Time-temperature combinations resulting in an isothermal effect; maximum exposure time produces reversible epidermal injury [Citation1,Citation2]. The red numbers on the left represent the CEM43-VTF dose values () in equivalent minutes and the black ones on the right represent the CEM43 dose values (t43).
![Figure 2. Time-temperature combinations resulting in an isothermal effect; maximum exposure time produces reversible epidermal injury [Citation1,Citation2]. The red numbers on the left represent the CEM43-VTF dose values (t43′) in equivalent minutes and the black ones on the right represent the CEM43 dose values (t43).](/cms/asset/d44650e3-8628-40fb-b86f-58a95bf8dfbf/ihyt_a_2065367_f0002_c.jpg)
3.3. Optical properties and dose
Increase in tissue optical scattering due to damage accumulation can be significant [Citation39]. These changes are clear in many examples; like the change of egg white from transparent (low scattering coefficient) to opaque (high scattering coefficient) after heat exposure. Thermal damage, with its related protein denaturation, manifests as an increase in optical scattering [Citation40]. Since the scattering coefficient is correlated to thermal damage, the optical scattering is expected to be an injective function of thermal dose. We used previously published experimental results on the changes in the optical scattering due to heating of tissue at different temperatures [Citation39] to study the ability of the models to predict changes in optical scattering. The normalized reduced scattering coefficient, is used and compared to the thermal does values obtained using the CEM43 and CEM43-VTF models. Here,
is the reduced scattering coefficient at a certain time during the heating and
is the the native reduced scattering coefficient. Henceforth, we will use ‘normalized
‘ as a short form of the normalized reduced scattering coefficient.
3.4. Laser-induced heating
Thermal dose models are needed for clinical applications like cancer treatment where temperatures vary spatially and temporally during treatment. Ex-vivo liver heating experiments were performed to test the performance of the thermal dose models under such realistic conditions. In this experiment, six thermal lesions were created on the surface of an adult bovine liver sample using laser energy. The sample was originally frozen, and was brought quickly to room temperature before the start of the experiment. The tissue was allowed to cool to room temperature after the creation of each lesion. A multimode optical fiber with a 1 mm core diameter and 0.37 numerical aperture (ThorLabs, Newton, NJ, USA), coupled to a Diomed 60, 810 nm diode laser (Diomed, Cambridge, UK) was placed 13 mm away from the tissue surface. A constant laser power of 1.3 W − 1.6 W for 1 min. to 6 min. exposures was used to produce lesions of varying size and temperature histories. The surface temperature map for each lesion was collected during heating using a thermal camera (FLIR ThermaCAM SC2000, FLIR Systems, Burlington, On, Canada) with a Close-up lens (34 mm horizontal field-of-view and 80 mm focal length) at a rate of one frame per second. The thermal camera continued to collect data two minutes after the laser was turned off since damage keeps accumulating after heating has stopped. Temperatures at the end of this period were too low to accumulate more damage significantly.
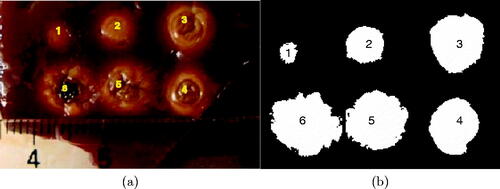
Since thermal damage in liver tissue is correlated with change in tissues optical properties, observed as tissue whitening [Citation39], an arbitrary brightness threshold was chosen in an optical colored image acquired after the experiment. This was done by converting the colored image to a grayscale image and then choosing a certain image intensity (which corresponds to choosing a certain damage threshold) to create a binary image of six white areas, wherein the image intensity is higher than the selected threshold, in the black background where the image intensity in less than that threshold. Then, the white areas inside these threshold boundaries were calculated for all six lesions (A1 to A6).
Thermal dose maps were calculated using the thermal camera temperature data using both the CEM43 and CEM43-VTF models. The two-minute cool-down period was included in the calculations. The calculated dose values were used for each lesion to find the dose threshold that encloses the same area obtained earlier from the binary image for that lesion to determine the thermal dose threshold’s consistency between lesions.
4. Results
4.1. Fitting the models to published results
shows the fit of the three existing models to four published sets of experimental results. The results support the universality of equivalent-minute calculations since data from different experiments in different biological systems can be fit using a single function. It also shows that the relationship used in the current CEM43 dose model (the black dashed line) fits the data reasonably well for hyperthermia temperatures range, but it diverges increasingly for higher temperatures. The results demonstrate that the CEM43 model over-estimates dose accumulation at higher temperatures. The results also show that the Arrhenius-VTF based relationship (the red solid line) fits the data much better than the basic Arrhenius based relationship (the blue dotted line).
The fit to EquationEquation (11)(11)
(11) , for the VTF case, resulted in
(18.5°C, 28.5°C), and
(322°C, 443°C) (the values in the parentheses represents the 95% confidence bounds). The goodness of fit was
Therefore,
and the CEM43-VTF EquationEquation (9)
(9)
(9) can be written as:
(14)
(14)
4.2. Epidermal injury
An ideal thermal dose model would predict the same dose value for each combination of the time-temperature combinations for the threshold B isothermal effect in the epidermal injury studies [Citation1,Citation2]. shows that the CEM43-VTF dose values () are of the same order of magnitude and are more consistent than the CEM43 dose values (t43), which have 2 orders of magnitude difference at higher temperatures. More specifically, the coefficient of variation of the
values is 0.312, while for the t43 dose values it is, 2.72. This shows that the new CEM43-VTF model is more consistent in predicting thermal damage than the current CEM43 model.
4.3. Optical properties and dose
Using previously published results of the changes of optical scattering due to heating [Citation39] the normalized plotted against dose is shown in . There is a more consistent relationship between the normalized
and
than there is between
and t43 as temperature is varied, which shows that the CEM43-VTF model is capable of quantifying biological end-points other than cell death. The use of the CEM43-VTF model in simulations of laser thermal therapy to include the dynamic changes of the optical scattering coefficient of tissue due to heating will result in more accurate simulation results.
Figure 3. The normalized as a function of thermal dose. In (a) the CEM43 dose model was used while the CEM43-VTF model was used in (b).
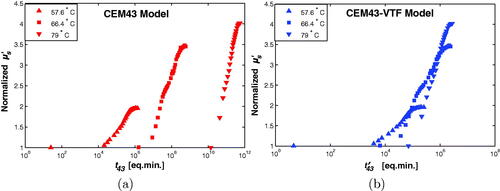
As mentioned in the methods (subsection 3.3), the optical scattering is expected to be an injective function of the thermal dose; i.e., the normalized scattering must be, ideally, a one-to-one function of the thermal dose value. The closer the relation to this ideal case, the more truthful the dose model, is in quantifying thermal-induced changes in tissues. While the results in are not perfect, they are significantly closer to a one-to-one relation than the results in (a).
4.4. Laser-induced heating
The optical image that was acquired after the experiment is shown in , along with the corresponding binary image that was produced as descried is subsection 3.4.
Figure 4. (a) Six lesions generated in bovine liver using laser with different heating time. The degree of tissue whitening is related to the severity of thermal damage and is used to produce the damage areas (A1–A6) in (b).
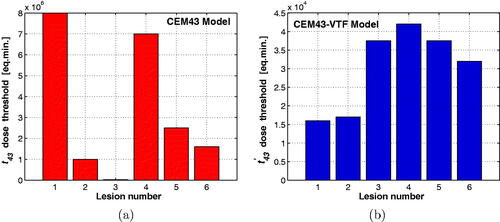
shows the CEM43 and CEM43-VTF threshold dose values such that the liver surface areas that received thermal dose higher than or equal to these thresholds match the thermal damage areas (A1–A6) for the six thermal lesions shown in . Ideally the dose threshold for all the lesions would be the same. The dose threshold values for the six lesions using the CEM43 model is shown in . They have an average of eq. min. with a standard deviation of
eq. min. The coefficient of variation was 0.99. The CEM43-VTF thresholds () have an average, of
eq. min. with a standard deviation of
eq. min. and a coefficient of variation of 0.37. Similar results were obtained when the same procedure was repeated for a second liver sample. For the second sample, the coefficient of variation for the CEM43 values (0.86) was again higher than the one for the CEM43-VTF values (0.40). These results demonstrate the consistency of the new CEM43-VTF dose model in predicting thermal damage in comparison with the current CEM43 dose model.
Figure 5. The dose thresholds that produce the same damaged areas found from the image in , (a) using the t43 the coefficient of variation was 0.99, and (b) using the coefficient of variation was 0.37.
5. Discussion
Thermal dose models are empirically derived formulae to be used in clinical applications. The models quantify thermal damage by finding relationships between exposure time, temperature, and a biological end-point. These relationships have been studied for many biological systems both in vivo and in vitro. The studies show that thermal damage rises exponentially with temperature for a given exposure time and rises linearly with exposure time for a given temperature. The current CEM43 thermal dose model assumes that the slope of the curve in a CEM43 plot (section 2.5.1), like the one in , has a break at 43°C in all biological systems. The values of the slope is which is obtained by substituting Equation (6a) into EquationEquation (11)
(11)
(11) . While the value C should vary continuously with temperature [Citation3], using only two values is a good approximation for traditional hyperthermia applications (up to 45°C). On the other hand, this approximation is not suitable for high-temperature applications, above the hyperthermia range as evident in and Citation2. The CEM43-VTF model has a continuously varying slope for all temperatures (), making it a more flexible dose model.
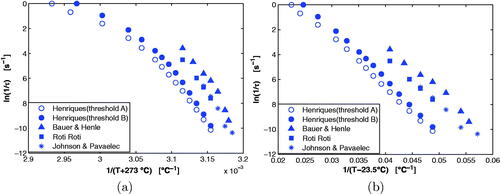
The Arrhenius-VTF model is a generalized form of the basic Arrhenius equation. In Arrhenius-VTF there is a temperature, T0, below which the reaction is not thermally activated [Citation30,Citation31,Citation41], whereas the reaction is always thermally activated above absolute zero (–273°C) in the basic Arrhenius case. The benefit of using the Arrhenius-VTF formulation for modeling thermal damage can be seen in the Arrhenius plots (section 2.5.2) shown in for various thermal damage experiments. The Arrhenius-VTF plot was generated using the activation temperature The activation energy in the Arrhenius model, Ea and the activation energy-related parameter, a, in the Arrhenius-VTF model, are obtained from the slope in a linear regression fit to the data in these plots. The Arrhenius-VTF plot () shows that the data from various experiments [Citation2,Citation36,Citation38,Citation42] are more linear than the points in the basic Arrhenius plot () for the same measurements. This implies that Ea in the basic Arrhenius model is temperature-dependent as has been observed in some studies [Citation4,Citation13,Citation14,Citation43]. Using the Arrhenius-VTF model essentially eliminates this dependence. Other publications [Citation24,Citation25] have used a modified-Arrhenius model that has a similar mathematical form as the Arrhenius-VTF equation. However, we used the established Arrhenius-VTF model based on a physical interpretation of the T0 parameter being an activation temperature (below which the process is not thermally activated). While the
47.5°C value in these works was arbitrarily chosen, the
23.5°C value was obtained by fitting to experimental results. In addition, we derived the VTF-CEM43 equation from the Arrhenius-VTF equation. A recent publication [Citation22] has linked and combined both the Arrhenius and the CEM43 models, but they used the original Arrhenius model, not the improved VTF-Arrhenius model.
Figure 6. Arrhenius plots for different biological heating experiments are shown in (a). In (b), the modified Arrhenius plots using the VTF model (with ) are shown for the same biological experiments.
The CEM43-VTF model assumes that all tissue types have the same slope in a Arrhenius-VTF plot, but this is not the case. EquationEquation (14)(14)
(14) was derived using
This is an acceptable value for various tissue types since the tissue-specific parameter ranged between
and
in . The goodness of fit to these tissues in was
for
Specific tissue can be used to fit a and
from the Arrhenius-VTF plots (assuming
in Equationequation (4)
(4)
(4) ) if a more precise, tissue-specific, is desired.
Thermal dose models use relative metrics that are positive-valued increasing functions of the thermal damage. One is the dimensionless Ω in the Arrhenius models, and others are the t43 or in the CEM43 models. These dose metrics are different in the way they quantify thermal damage. The metrics t43 or
are independent of the tissue type, but the threshold for damage is tissue specific. The Arrhenius metric, Ω, is tissue-specific, and the threshold Ω = 1 quantifies the same damage end-point, independent of tissue type. Although this study introduces two new models for thermal dose, the Arrhenius-VTF and CEM43-VTF models, we propose the adoption of the CEM43-VTF model since it is simpler and more universal. If an Arrhenius-type dose model is preferred, then the Arrhenius-VTF model should be used instead of the basic Arrhenius model. Since Arrhenius-VTF is new to thermal dosimetry studies, new parameters a and A are needed to be derived for different tissue types using the T0 value that was established in this work. Furthermore, since the relation between the CEM43 models and the Arrhenius-type models is established here, if the parameter a for a certain type of tissue is determined, it can be used for CEM43-VTF calculations as well.
One of the motivations for this work was the development of a thermal dose model that could be used for a broad range of thermal applications, including those that target cell death as the end-point, changes in the optical properties of tissues, or the amount of drug released from thermosensitive liposomes. The results from the two laser heating experiments (sections 4.3 and 4.4) show that the CE43-VTF model was able to more accurately predict the amount thermal damage, more specifically, the reduced optical scattering coefficient (directly in section 4.3 and indirectly through tissue whitening in 4.4) in compared to the CEM43 model. Another motivation was to develop a thermal dose model that was able to predict cell death when heat was used as an adjuvant to other therapies (such as chemo- and radio-sensitization). This was not investigated in this work and this goal may never be realized for the case of radio-sensitization with heat. That is because one of the mechanisms of radio-sensitization with heat is the reduction of hypoxia due to increased blood perfusion caused by heating. Unfortunately there is no functional relationship between the response of blood perfusion and temperature. For example an elevated temperature can cause an initial increase in perfusion but later produce a reduction in perfusion due to vascular shut-down [Citation44].
6. Summary and conclusion
Accurate quantification of thermal damage is critical for clinical applications of thermal therapy but the damage process in biological systems is complicated, and understanding it is not trivial. To improve thermal dosimetry, experimental results for a wide range of temperatures in different types of tissue along with thermal damage models that use these experimental results more effectively are needed. A mathematical formulation for dosimetry is provided that makes it easier to develop new models using a variety of experimental results. Using this formulation, a new model for CEM43-type dose calculations is introduced that improves on the existing CEM43 model in terms of accuracy and consistency over a wider temperature range. This consistency is evident in the epidermal injury in-vivo results (), where the coefficient of variation for the dose values calculated using the old model was 2.72, is almost an order of magnitude higher than that calculated using the new dose model (0.312). Even for the range of temperature below where the old model performs well, the coefficient of variation of 0.316 is higher than the coefficient of variation of 0.255 from the new model.
While a new dose model has been introduced and fit to various experiments, this work introduces the foundation for a new dose model. While the use of this new dose model will lead to more robust thermal dosimetry and improvements in thermal therapy modeling, monitoring, and control, further experiments in more clinically relevant scenarios are needed to better fit and tailor the model parameters. In addition, new studies are needed to find thresholds that represent the minimum dose (as equivalent time) needed to cause irreversible damage to tumor tissues that are commonly targeted by heat treatments, such as prostate, liver, and brain.The CEM43-VTF dose thresholds that correspond to the maximum dose that tissues of some vital organs can receive without getting irreversibly damaged need to be determined. The suitability of the CEM43-VTF model for predicting other end-points, such as drug release from thermosensitive liposomes, is also needed.Such work will be very important for the clinical use of thermal therapy.
Disclosure statement
No potential conflict of interest was reported by the author(s).
Additional information
Funding
References
- Moritz AR, Henriques FC. Studies of thermal injury. II. The relative importance of time and surface temperature in the causation of cutaneous burns. Am J Pathol. 1947;39(1):695–720.
- Henriques FC. Studies of thermal injury V. The predictability and the significance of thermally induced rate processes leading to irreversible epidermal injury. Arch Pathol. 1947;43:489–502.
- Sapareto SA, Dewey WC. Thermal dose determination in cancer therapy. Int J Radiat Oncol Biol Phy. 1984;10(6):787–800.
- Dewhirst MW, Viglianti BL, Lora-Michiels M, et al. Basic principles of thermal dosimetry and thermal thresholds for tissue damage from hyperthermia. Int J Hyperthermia. 2003;19(3):267–294.
- Stoll AM, Greene LC. Relationship between pain and tissue damage due to thermal radiation. J Appl Physiol. 1959;14(3):373–382.
- van der Zee J, González D, van Rhoon GC, et al. Comparison of radiotherapy alone with radiotherapy plus hyperthermia in locally advanced pelvic tumours: a prospective, randomised, multicentre trial. Lancet. 2000;355(9210):1119–1125.
- Kok HP, Crezee J, Franken NAP, et al. Quantifying the combined effect of radiation therapy and hyperthermia in terms of equivalent dose distributions. Int J Radiat Oncol Biol Phys. 2014;88(3):739–745.
- Assi H, Yang C, Shaswary E, et al. Real-time control of nanoparticle-mediated thermal therapy using photoacoustic imaging. IEEE Trans Biomed Eng. 2021;68(7):2188–2194.
- Kong G, Anyarambhatla G, Petros WP, et al. Efficacy of liposomes and hyperthermia in a human tumor xenograft model: importance of triggered drug release. Cancer Res. 2000;60(24):6950–6957.
- Mellal I, Oukaira A, Kengene E, et al. Thermal therapy modalities for cancer treatment: a review and future perspectives. Int J Res Rev Appl Sci. 2017;4:14.
- Pearce J, Thomsen S. 17. Rate process analysis of thermal damage. In: Welch AJ, van Gemert MJC, editors. Optical-thermal response of laser-irradiated tissue. New York: Plenum Press; 1995. p. 561–603.
- Bischof JC, He X. Thermal stability of proteins. Ann N Y Acad Sci. 2005;1066:12–33.
- He X, Wolkers WF, Crowe JH, et al. In situ thermal denaturation of proteins in dunning at-1 prostate cancer cells: implication for hyperthermic cell injury. Ann Biomed Eng. 2004;32(10):1384–1398.
- Chen B, Thomsen SL, Thomas RJ, et al. Histological and modeling study of skin thermal injury to 2.0 microm laser irradiation. Lasers Surg Med. 2008;40(5):358–370.
- Dewey WC, Hopwood LE, Sapareto SA, et al. Cellular responses to combinations of hyperthermia and radiation. Radiology. 1977;123(2):463–474.
- Henle KJ, Dethlefsen LA. Time-temperature relationships for heat-induced killing of mammalian cells. Ann N Y Acad Sci. 1980;335:234–253.
- Davidson SRH, Vitkin IA, Sherar MD, et al. Characterization of measurement artefacts in fluoroptic temperature sensors: implications for laser thermal therapy at 810 nm. Lasers Surg Med. 2005;36(4):297–306.
- Whelan WM, Wyman DR. Dynamic modeling of interstitial laser photocoagulation: Implications for lesion formation in liver in vivo. Lasers Surg Med. 1999;24(3):202–208.
- Graham SJ, Chen L, Leitch M, et al. Quantifying tissue damage due to focused ultrasound heating observed by MRI. Magn Reson Med. 1999;41(2):321–328.
- Daum DR, Hynynen K. Thermal dose optimization via temporal switching in ultrasound surgery. IEEE Trans Ultrason Ferroelectr Freq Control. 1998;45(1):208–215.
- Nau WH, Diederich CJ, Ross AB, et al. MRI-guided interstitial ultrasound thermal therapy of the prostate: a feasibility study in the canine model. Med Phys. 2005;32(3):733–743.
- Babbar A, Jain V, Gupta D, et al. Finite element simulation and integration of CEM43 °C and Arrhenius Models for ultrasonic-assisted skull bone grinding: a thermal dose. Med Eng Phys. 2021;90:9–22.
- Pearce JA. Comparative analysis of mathematical models of cell death and thermal damage processes. Int J Hyperthermia. 2013;29(4):262–280.
- Ramadhyani S, Abraham JP, Sparrow EM. A mathematical model to predict tissue temperatures and necrosis during microwave thermal ablation of the prostate. In: Advances in numerical heat transfer. Vol. 3. Boca Raton: CRC Press; 2009. p. 357–384.
- Abraham JP, Sparrow EM, Ramadhyani S. Numerical simulation of a BPH thermal therapy-a case study involving TUMT. J Biomech Eng. 2007;129(4):548–557.
- Arrhenius S. Über die Reaktionsgeschwindigkeit bei der Inversion von Rohrzucker durch Säuren (on the reaction rate in the inversion of cane sugar by acids). Z Phys Chem. 1889;4U(1):226–248.
- Vogel H. The temperature dependence law of the viscosity of fluids. Phys Z. 1921;22:645–646.
- Tammann G, Hesse W. The dependancy of viscosity on temperature in hypothermic liquids. Z Anorg Allg Chem. 1926;156(1):245–257.
- Fulcher GS. Analysis of recent measurements of the viscosity of glasses. J Am Ceramic Soc. 1925;8(6):339–355.
- Cann DP, Randall CA, Shrout TR. Investigation of the dielectric properties of bismuth pyrochlores. Solid State Commun. 1996;100(7):529–534.
- Cherif E, Bouanz M. Evidence of Vogel-Tamman-Fulcher bahavior in ionic binary fluids. Phys Chemistry Liq. 2007;45(6):649–661.
- Adam G, Gibbs JH. On the temperature dependence of cooperative relaxation properties in glass-forming liquids. J Chem Phys. 1965;43(1):139–146.
- Dewhirst MW, Abraham J, Viglianti B. Evolution of thermal dosimetry for application of hyperthermia to treat cancer. In: Advances in heat transfer. Vol. 47. Amsterdam, Netherlands: Elsevier; 2015. p. 397–421.
- Johnson NN, Abraham JP, Helgeson ZI, et al. An archive of skin-layer thicknesses and properties and calculations of scald burns with comparisons to experimental observations. J Thermal Sci Eng Appl. 2011;3(1):011003.
- Abraham JP, Hennessey MP, Minkowycz WJ. A simple algebraic model to predict burn depth and injury. Int Commun Heat Mass Transfer. 2011;38(9):1169–1171.
- Bauer KD, Henle KJ. Arrhenius analysis of heat survival curves from normal and thermotolerant CHO cells. Radiat Res. 1979;78(2):251–263.
- Ross-Riveros P, Leith JT. Response of 9L tumor cells to hyperthermia and X irradiation. Radiat Res. 1979;78(2):296–311.
- Johnson HA, Pavelec M. Thermal injury due to normal body temperature. Am J Pathol. 1972;66(3):557–564.
- Skinner MG, Everts S, Reid AD, et al. Changes in optical properties of ex vivo rat prostate due to heating. Phys Med Biol. 2000;45(5):1375–1386.
- Nau WH, Roselli RJ, Milam DF. Measurement of thermal effects on the optical properties of prostate tissue at wavelengths of 1,064 and 633 nm. Lasers Surg Med. 1999;24(1):38–47.
- Civan F. Applicability of the Vogel-Tammann-Fulcher type asymptotic exponential functions for ice, hydrates, and polystyrene latex. J Colloid Interface Sci. 2005;285(1):429–432.
- Roti JLR, Henle KJ, Winward RT. The kinetics of increase in chromatin protein content in heated cells: a possible role in cell killing. Radiat Res. 1979;78(3):522–531.
- Wu YC. A modified criterion for predicting thermal injury. Washington (DC): National Bureau of Standards; 1982.
- Song CW. Effect of local hyperthermia on blood flow and microenvironment: a review. Cancer Res. 1984;44(10 Suppl):4721s–4730s.