
 ?Mathematical formulae have been encoded as MathML and are displayed in this HTML version using MathJax in order to improve their display. Uncheck the box to turn MathJax off. This feature requires Javascript. Click on a formula to zoom.
Abstract
Purpose
Tumor perfusion is considered to be the principal factor determining the build-up of therapeutically effective thermal fields. This assumes that malignancies have lower perfusions than their homologous tissues. This assumption, however, ignores the fact that several tumor types have higher perfusions than their healthy counterparts. Additionally, flow changes upon hyperthermia (39–43 °C) are non-predictable and extremely heterogeneous. Therefore, modeling temperature distribution further requires a more robust parameter, different in malignancies and healthy tissues, i.e., water content (Cw), which highly determines thermal properties upon electromagnetic irradiation.
Method
Systematic literature reviews of Cw and specific heat capacities (cp) were conducted up to 28 February 2022, providing an updated, comprehensive data overview based on original manuscripts, reviews and databases.
Results
Cw- and cp-values of cancers and their corresponding healthy tissues are presented. Strong correlations between these two parameters are described. In general, malignant tumors have distinctly higher Cw values than their homologous tissues. With increasing Cw in low-water-content normal tissues (<70 wt.%), cp rises exponentially from 1.5 to 3.3 J·g–1·K–1. In high-water-content normal tissues (≥70 wt.%), cp increases linearly from 3.5 to 3.8 J·g–1·K–1. In malignant tumors (>80 wt.%), cp rises linearly from 3.6 to 3.9 J·g–1·K–1. Cancers contain up to 27% more water than their tissues of origin and must be considered as ‘high-capacitance-tissues’.
Conclusions
Hyperhydration of cancers result in higher cp-values, causing cancers to be better heat reservoirs than corresponding normal tissues upon electromagnetic irradiation. Reliable, tissue-/cancer-specific cp values must be considered when modeling temperature distributions in hyperthermic treatment.
1. Introduction
Adjuvant mild hyperthermia (HT), i.e., heat treatment of malignant tumors in the range 39–43 °C which is applied within a close timeframe with radiation (RT) and/or chemotherapy (CT), has unequivocally shown distinct beneficial effects in numerous clinical studies [Citation1–5]. HT is a proven radio- and chemo-sensitizer and can facilitate a series of anti-tumor immune responses. As a common mediating factor, HT-induced temporary increases in tumor blood flow (BF) have been considered to improve the delivery of oxygen (O2), of anti-cancer drugs, and of components of the anti-tumor immune system to tumors. For the latter two mechanisms, a further increase in the vascular permeability of the immature, chaotic microvasculature upon HT has additionally been taken into consideration.
Since the late 1970s, quasi-selective heating of targeted tumors has been discussed because blood perfusion of cancers relative to the surrounding healthy tissues has been reported to be lower, thereby providing an effective ‘heat-trap’ [Citation6–9]. This generalizing statement is often based on an uncritical translation of data obtained in preclinical animal experiments using fast-growing, ‘bulky’ rodent tumors [Citation10]. In the clinical setting, BF in human tumors (e.g., breast cancers, cancers of the head and neck region, prostate and cervix cancers) can be slightly [Citation11] or even markedly higher than in the surrounding tissues or tissues of origin.
Considering relevant clinical data, BF values in squamous cell carcinomas of the head and neck (SCCHN) are 0.30–2.40 mL g–1 min–1 vs. BF≈0.05 mL g–1 min–1 in the surrounding normal tissues [Citation12,Citation13]. In a clinical case study, preheat BF in a SCCHN was 1.7 mL·g–1·min–1 and approx. 2.3 mL·g–1·min–1 post heating [Citation14]. Average BF values in breast cancers are ≈0.45 mL g–1 min–1 vs. ≈0.05 mL g–1 min–1 in the postmenopausal breast [Citation15], and mean perfusion rates in T3 prostate cancers are often elevated up to 0.7 mL g–1 min–1 vs. 0.2 mL g–1 min–1 in normal prostate [Citation16,Citation17]. Flow rates in these cancers and in cervix cancers [Citation18] are, at least, 3-times higher than in their normal counterparts (‘homologous normal tissues’). These latter tumor BF (TBF) data substantially deviate from those presented by Wust [Citation19]. For reasons of simplification, Wust presented the following ‘generalized’ TBF data for basal, hyperthermic and maximum flow: 0.05 vs. 0.10 vs. 0.15 mL g–1 min–1 for ‘tumor’ (without any tumor type specification). In addition to these latter ‘estimated’ data, inappropriate blood flow and cp- data presented by Lang et al. [Citation20] (e.g., identical cp-values for all soft tissues, inappropriate model of temperature-dependent blood perfusion for tumor) are a main source in perfusion modeling and confusion in selective heating of tumors.
For the concept that ‘the treatment of malignancy by HT, the main determinant of selectivity is tumor changes upon heating blood flow’ [Citation21], tumor BF is believed to play the principal role in hyperthermic oncology since it critically determines convective heat dissipation and thus the ability to heat the tissue. However, tumor BF before and upon clinically relevant mild HT exhibits pronounced intratumor (spatial and temporal) and tumor-to-tumor variability which are not predictable, especially during a longer treatment period. In individual tumors even divergent BF changes during treatment sessions have been observed (for further details see [Citation10]).
TBF changes in patients with cancer treated with adjuvant mild HT may be quite different from those seen in fast-growing, low-flow rodent tumors upon heat treatment [Citation10]. TBF changes in patient tumors will depend on the tumor size, tumor type, location, the basal flow rate compared to the flow rate in the surrounding tissue(s), the heating-up rate and steady-state HT level achieved, the duration and number of HT sessions, and whether primaries, metastatic tumors or recurrent lesions are treated. When clinically relevant HT is applied as an adjuvant to established treatment modalities, TBF may change in non-predictable directions, and to different extents and durations. Due to these imponderables, restrictions in tumor BF cannot be the (and only) decisive parameter for a quasi-selective heating of cancerous tissues.
In this review article, we suggest another basic, possibly more robust parameter which is distinctly different in normal tissues and cancers, and which substantially impacts heat deposition: free water content. In general, water content (‘hydration state’) of normal tissues is typically ≤80 wt.% (except for cerebral gray matter, testes, fast-growing placental and fetal tissues [Citation22]), whereas water contents in malignancies are distinctly above 80 wt.%. High water contents in neoplastic tissues were first recognized in the late 1940s [Citation23], and confirmed by gravimetric methods, NMR, Raman and terahertz (THz) spectroscopy (for a recent review see [Citation24]). This biophysical or physicochemical ‘hallmark’ of cancer (mostly coinciding with an increase in the volume of the extracellular space; see Chapter 3.1), has been widely under-rated or even neglected. Due to intensified microvascular leakages during therapeutic HT, the accumulation of free water further increases [Citation10,Citation25,Citation26]. As a consequence of a higher water content (mainly extracellular), the specific heat capacity (cp), a key parameter for thermal therapies, is significantly higher than in normal tissues. It is defined as the quantity of energy (heat) to be supplied to (or taken off) per unit mass of a substance (or a biological medium or tissue) in order to increase (or decrease) its temperature by 1 K (or 1 °C) in a thermodynamic process. The SI unit of cp is [J·g–1·K–1]. Water has the highest cp value of all biological media. Therefore, hyperhydrated cancers are distinctly better heat reservoirs than their corresponding healthy tissues.
Assuming insignificant heat dissipation via superficial perfusion, specific absorption rate (SAR) should be adequately increased in cancer tissue with its higher specific heat capacity according to
(1)
(1)
in order to achieve similar heating rate (HR) as measured in normal tissue of smaller cp [Citation11,Citation19,Citation27,Citation28]. This emphasizes the importance to consider tissue-specific values of cp for predicting tissue heating by absorption of RT, both in kinetics and in extent, and to solve the Pennes' bioheat equation as well [Citation27,Citation28].
Water is ‘omnipresent’ and has the highest specific heat capacity of any liquid and tissue. In pure water, cp ≈ 4.18 J g–1 K–1 for temperatures between 33 °C and 43 °C [Citation29–31]. cp values decrease about linearly with an increase in salinity of sea water [Citation32,Citation33], reaching about cp ≈ 4.13 J g–1 K–1 for isotonic NaCl solution [Citation31].
In addition, the generally higher water content in malignancies leads to a higher thermal conductivity [Citation34–37], a higher diffusivity [Citation38,Citation39] and an increase in electrical conductance [Citation40,Citation41].
2. Interactions of electromagnetic waves with water and aqueous solutions
2.1. Relevant properties of pure water and aqueous solutions
Each water molecule (H2O) consists of a double-electronegative oxygen ion (O2–) which is elastically bonded with two protons (H+). It forms an electric dipole of 104.5° in angle, of ≈275 pm in diameter, and of O-H bond lengths of 95.84 ± 0.06 pm. The mass balance center is located on the symmetry axis of the molecule at ≈6.5 pm distance from the center of the oxygen ion. In the liquid state of aggregation, water molecules are interlinked among each other by hydrogen bonds and by forming of clusters [Citation42,Citation43].
In aqueous solutions, water dipoles are electrostatically interlinked with cations and anions of dissociated substances by hydrogen bonds (hydration) forming hydration spheres of ions. Dielectric properties of aqueous solutions, therefore, depend on the concentration of dissociated substances [Citation44].
These properties are fundamental to the key role of water for tissue heating upon absorption of electromagnetic RT of different wavelength (λ) ranges, e.g., infrared RT (IR, 0.78 µm ≤ λ ≤ 1.0 mm), microwaves (MW, 1.0 mm ≤ λ ≤ 1.0 m), and radiofrequencies (RFs) within the sub-ranges of very high frequencies (VHF, 1.0 m ≤ λ ≤ 10 m) and of high frequencies (HF, 10 m ≤ λ ≤ 100 m) up to wavelengths of about 37.5 m. These wavelengths correspond to the following frequencies (ν): 384 THz ≥ ν ≥ 300 GHz (IR), 300 GHz ≥ ν ≥ 300 MHz (MW), 300 MHz ≥ ν ≥ 30 MHz (VHF) and 30 MHz ≥ ν ≥ 3 MHz (HF) [Citation45–50].
2.2. Heating by absorption of infrared radiation (IR)
The spectral range of IR is divided into the sub-ranges of IR-A (0.78 µm ≤ λ ≤ 1.40 µm), of IR-B (1.4 µm ≤ λ ≤ 3.0 µm) and of IR-C (3.0 µm ≤ λ ≤ 1 mm) [Citation46,Citation47].
As depicted in , the absorption coefficient of water increases with wavelengths up to about five magnitudes within the sub-ranges of IR-A and IR-B, and remains at high levels within the sub-range of IR-C [Citation51–54]. Peaks at characteristic wavelengths result from three fundamental vibrations of single water molecules induced by absorption of RT within the IR-A and IR-B sub-ranges: (a) O-H symmetric stretching (v1, at 0.94, 1.39 and 2.73 µm), (b) O-H asymmetric stretching (v3, at 0.91, 1.34 and 2.56 µm) and (c) H-O-H bending (v2, at 2.14, 3.17 and 6.08 µm). Cooperative combinations of v1, v2 and v3 cause superposition of peaks and overtones [Citation43,Citation51–53].
Figure 1. Spectral absorption coefficient of liquid water as a function of wavelengths within the spectral range of infrared radiation with sub-ranges infrared-A (IR-A), infrared-B (IR-B) and infrared-C (IR-C) [Citation51–53]. Spectral peaks and their extents are caused by basic vibrations of water molecules (v1: symmetric O-H stretching, v2: H-O-H bending, v3: asymmetric O-H stretching, L1: minor libration, L2: major libration) and by their superposition and overtones (IR-A and IR-B), as well as by cluster/collective vibrations due to H-O ··· O stretching/bending (IR-C) [Citation54–57]. Extents of horizontal boxes mark wavelength ranges of respective vibration types (Dashed line supplements data of the spectral absorption coefficient within 0.5 μm and 0.78 μm of the spectral range of visible radiation (VIS) for additional information).
![Figure 1. Spectral absorption coefficient of liquid water as a function of wavelengths within the spectral range of infrared radiation with sub-ranges infrared-A (IR-A), infrared-B (IR-B) and infrared-C (IR-C) [Citation51–53]. Spectral peaks and their extents are caused by basic vibrations of water molecules (v1: symmetric O-H stretching, v2: H-O-H bending, v3: asymmetric O-H stretching, L1: minor libration, L2: major libration) and by their superposition and overtones (IR-A and IR-B), as well as by cluster/collective vibrations due to H-O ··· O stretching/bending (IR-C) [Citation54–57]. Extents of horizontal boxes mark wavelength ranges of respective vibration types (Dashed line supplements data of the spectral absorption coefficient within 0.5 μm and 0.78 μm of the spectral range of visible radiation (VIS) for additional information).](/cms/asset/e41637b9-9572-4498-81ae-d3de5deffbe8/ihyt_a_2067596_f0001_c.jpg)
In the sub-range of IR-C, the absorption spectrum includes 4 prominent maxima which are due to the induction of vibrations of single water molecules by bending alone at 6.08 µm, by both, bending (v2) and libration at 4.65 µm (L2), and by libration alone at 15 µm (L2) and at 25 µm (L1) [Citation51–53].
In addition, two types of collective vibration occur in liquid water due to hydrogen bonds (H – O ··· O) between water molecules and formed clusters. Both types of collective vibration, the hydrogen bond stretching (maximum at about 55 µm) and the hydrogen bond bending (maximum at about 200 µm), result in broad absorption bands which are responsible for high values of the spectral absorption coefficient between wavelengths of about 30 µm and 1.0 mm [Citation51–54].
2.3. Dielectric heating by absorption of microwaves (MW)
Dielectric heating of tissues results from frictional heat generated through enforced rotations of the water-dipoles by absorption of MW-RT (frequencies: 300 MHz ≤ ν ≤ 300 GHz). These motions aim to adjust the orientation of each dipole with the polarization of the electric field altering according to the frequency of applied microwave RT. However, adjustment of dipoles is increasingly delayed (in relation to phase angle of the electric field) with rising frequency applied, and extends into the range of relaxation time of water molecules. As a consequence, complex relative permittivity (εr) of tissue changes with angular frequency (ω = 2πν) according to
(2)
(2)
where i2 = –1, εr'(ω) = εr∞ + (εrs – εr∞)/(1 + ω2τ2), and εr''(ω) = (εrs – εr∞) · ωτ/(1 + ω2τ2)
(εrs – the static permittivity, εr∞ – the electronic part of relative permittivity extrapolated for ‘infinite’ high frequencies and τ – the Debye relaxation time) [Citation45,Citation58].
The real part εr'(ω) quantifies the storage of external electric field energy as a function of frequency. The imaginary part iεr''(ω) characterizes the dielectric loss of tissues due to frequency-dependent energy absorption and generation of frictional heat. It is proportional to the electric conductivity (σ) according to
(3)
(3)
where ε0 ≈ 8.86 · 10–12 F m–1 (permittivity of the vacuum) [Citation45].
Here, the quantity εr''(ω) is used to define ‘dielectric loss’ which is in agreement with cited data [Citation44,Citation59–61]. {Please note that this is in contrast to definitions by other authors, such as the ratio εr''(ω)/εr'(ω) [Citation6] and the ‘loss tangent’ tan εr''(ω)/εr'(ω) [Citation59] which additionally consider frequency-dependence of the real part εr'(ω)}.
τ is determined by inertia of water molecules (due to own weights and interlinks with other molecules via hydrogen bonds), and declines with rising water temperature T (due to a related increase of thermal molecular vibrations) according to Debye [Citation58]:
(4)
(4)
where k ≈ 1.380 · 10–23 Ns m–1 is the Boltzmann constant, r ≈ 137.5 pm is the molecular radius of water, and η is the dynamic viscosity of water [Citation42,Citation45].
Using η ≈ 0.7 mNs m–1 at T = 310 K (37 °C) and η≈0.58 mNs m–1 at T = 320 K (47 °C) [Citation62] calculated values for water are: τ ≈ 5.4 ps at T = 310 K (37 °C), and τ ≈ 4.3 ps at T = 320 K (47 °C). More precise data have been provided by Lunkenheimer et al. on the basis of several techniques for measuring broadband dielectric spectra: τ ≈ 6.0 ps at T =310 K (37 °C), and τ ≈ 5.3 ps at T = 320 K (47 °C) [Citation59].
Maximum values of εr'' are shown at Debye peak frequency ωp = τ–1 (or equivalently: νp = (2π τ)–1). This means that the time-delay of dipoles reaches its maximum at this frequency, and this is equivalent to the maximum of both, the dielectric loss in the water and the spectral maximum of microwave absorption. Moreover, as relaxation time declines with temperature increments (see EquationEquation (4)(4)
(4) ), the Debye Peak frequency increases equivalently. In the same way, the extent of the maxima of dielectric loss declines with the increase in water temperature. For experimental data, see , curves 2 and 3 [Citation59].
Figure 2. Dielectric loss ε" of pure liquid water at temperatures of 2 °C (curve 1), 37 °C (curve 2) and 47 °C (curve 3), and of intracellular water at 1 °C (curve 4, open circles) as a function of frequency between 300 MHz and 20 THz [Citation59,Citation63]. Relaxation times decreased in pure water from τ ≈ 18 ps at 2 °C to τ ≈ 6 ps at 37 °C, and to τ ≈ 5.3 ps at T = 47 °C [Citation59]. Debye Peak frequencies at νp ≈ 9 GHz (2 °C), at νp ≈ 26 GHz (37 °C) and at νp ≈ 30 GHz (47 °C), and extents of peak maxima of dielectric loss at ε'' ≈ 40% (2 °C), at ε'' ≈ 36% (37 °C) and at ε'' ≈ 34 (47 °C) [Citation59]. Respective data for intracellular water at 1 °C: τ ≈ 20 ps, νp ≈ 8 GHz, and ε'' ≈ 27 (at maximum) [Citation63].
![Figure 2. Dielectric loss ε" of pure liquid water at temperatures of 2 °C (curve 1), 37 °C (curve 2) and 47 °C (curve 3), and of intracellular water at 1 °C (curve 4, open circles) as a function of frequency between 300 MHz and 20 THz [Citation59,Citation63]. Relaxation times decreased in pure water from τ ≈ 18 ps at 2 °C to τ ≈ 6 ps at 37 °C, and to τ ≈ 5.3 ps at T = 47 °C [Citation59]. Debye Peak frequencies at νp ≈ 9 GHz (2 °C), at νp ≈ 26 GHz (37 °C) and at νp ≈ 30 GHz (47 °C), and extents of peak maxima of dielectric loss at ε'' ≈ 40% (2 °C), at ε'' ≈ 36% (37 °C) and at ε'' ≈ 34 (47 °C) [Citation59]. Respective data for intracellular water at 1 °C: τ ≈ 20 ps, νp ≈ 8 GHz, and ε'' ≈ 27 (at maximum) [Citation63].](/cms/asset/823fe841-0a14-4c71-80ce-43dc9928d072/ihyt_a_2067596_f0002_c.jpg)
For frequencies above that of the Debye Peak frequency, inertia of water molecules becomes more and more noticeable, and thus dielectric loss decreases with increasing frequency to insignificant values within the sub-range of IR-C (). Therefore, heating due to enforced rotations of water dipoles becomes more and more ineffective, whereas cluster vibrations effectively contribute to water heating, as described above.
Dielectric loss of intracellular water shows a similar spectral distribution as measured in pure liquid water of comparable temperature. However, its maximum is significantly smaller. For experimental data, see , curves 1 and 4 [Citation59,Citation63].
2.4. Dielectric heating by absorption of radiofrequencies (RF): very high frequencies (VHF) and high frequencies (HF)
Mechanisms of dielectric heating of aqueous solutions, biological media and of tissues using VHF and HF are the same as described above for microwaves. Heating results from oscillations of ions interlinked with water dipoles and of free electrons caused by applied RFs [Citation6,Citation48]. Due to inertia of the hydration spheres, the phase difference between the alternating electric field and oscillations increases with frequency. This results in a dielectric loss and in the generation of frictional heat. As depicted in , dielectric loss in different tissues and in NaCl solutions (salinity between 0.5% and 0.9% w/v) increases to a similar extent with decreasing frequency [Citation60,Citation64]. In addition, data in show that dielectric loss caused by microwaves and by RFs also increases with (increasing) water content of tissues [Citation61,Citation65].
Figure 3. Dielectric loss ε" in splenic hematoma (curve 1, squares), intestinal leiomyosarcoma (curve 2, dots), hemangiopericytoma (curve 3, stars)) and in NaCl solution of different salinity: 0.9% w/v (curve 4, open triangles), 0.5% w/v (curve 5, solid triangles) as a function of frequency between 10 MHz and 20 GHz. Data for NaCl solutions were measured by Gadani DH et al. [Citation60]. Data for splenic hematoma and for both tumor tissues were calculated using data of conductivity measurements performed by Schepps and Foster [Citation64] according to EquationEquation (3)(3)
(3) .
![Figure 3. Dielectric loss ε" in splenic hematoma (curve 1, squares), intestinal leiomyosarcoma (curve 2, dots), hemangiopericytoma (curve 3, stars)) and in NaCl solution of different salinity: 0.9% w/v (curve 4, open triangles), 0.5% w/v (curve 5, solid triangles) as a function of frequency between 10 MHz and 20 GHz. Data for NaCl solutions were measured by Gadani DH et al. [Citation60]. Data for splenic hematoma and for both tumor tissues were calculated using data of conductivity measurements performed by Schepps and Foster [Citation64] according to EquationEquation (3)(3) σ(ω)=ωε0εr″(ω),(3) .](/cms/asset/b3c2cf98-03c1-4068-a9fe-18b505ed9f03/ihyt_a_2067596_f0003_c.jpg)
Figure 4. Dielectric loss ε" in normal tissues (blue symbols: fat (triangles, upward), bone (triangles (downward), lung (dots), muscle (stars)) and in NaCl solution (salinity = 0.4% w/v, black hexagon) at frequencies of 13.56 MHz (curve 1, solid symbols) and of 434 MHz (curve 2, open symbols) as a function of water content of tissues. Data for dielectric loss were calculated using data of conductivity measurements by Kok and Crezee [Citation65] according to EquationEq. 3(3)
(3) . Data for water content according to Pethig and Kell [Citation61].
![Figure 4. Dielectric loss ε" in normal tissues (blue symbols: fat (triangles, upward), bone (triangles (downward), lung (dots), muscle (stars)) and in NaCl solution (salinity = 0.4% w/v, black hexagon) at frequencies of 13.56 MHz (curve 1, solid symbols) and of 434 MHz (curve 2, open symbols) as a function of water content of tissues. Data for dielectric loss were calculated using data of conductivity measurements by Kok and Crezee [Citation65] according to EquationEq. 3(3) σ(ω)=ωε0εr″(ω),(3) . Data for water content according to Pethig and Kell [Citation61].](/cms/asset/8c28501b-34b4-4f4e-8efc-2fc0c0624109/ihyt_a_2067596_f0004_c.jpg)
3. Water content and specific heat capacities of malignant tumors vs. corresponding normal tissues
3.1. Methodology of data collection
For this updated review, systematic literature reviews of tissue water contents and specific heat capacities were conducted (published before 28 February 2022) to provide a comprehensive data overview based on original manuscripts, reviews and databases. We searched PubMed, Medline, Web of Science, Embase databases, Scopus, ScienceDirect and ResearchGate. The search terms included: water content, human tissues and body fluids, specific heat capacity, HT treatment modeling, tumor/cancer hyperhydration and thermophysical properties.
3.2. Differential water content of normal and cancerous tissues
As already indicated in the Introduction section, cancer tissues generally have a distinctly higher water content compared to their corresponding/homologous tissues (mean water content of body fluids, selected normal tissues and biological media are listed in and ; for data collections of water contents of healthy tissues see [Citation35,Citation99,Citation100,Citation112,Citation113]). Increased water content of malignant tumors has been proposed as a ‘marker’ for noninvasive tumor detection, providing precise localization of the lesion and information on the adequacy of surgical margins [Citation114]. In addition, tissue water percentage has been suggested to be a prognostic biomarker of early cancer recurrence [Citation101].
Table 1. Mean water content (Cw) and specific heat capacity (cp) of liquid water, body fluids, normal human tissues (selection) and biological media*.
Table 2. Mean water content (Cw) and specific heat capacity (cp) of normal human tissues vs. corresponding tumor tissues (selection).
The generally higher water content in cancer tissues is mostly due to plasma leakage from the immature, hyperpermeable tumor microvessels arising during tumor angiogenesis and the absence of an adequate lymphatic drainage, both of which result in an expansion of the interstitial space [Citation115,Citation116]. Another pathogenetic factor leading to hyper-hydration of malignant tumors is passive hyperemia (vasocongestion, i.e., an increase in microvascular blood volume) such as is seen in inflammatory breast cancer, high-grade gliomas [Citation117], non-small cell lung cancer, and various types of non-melanoma cutaneous malignancies.
Increased water content of experimental cancers has consistently been reported (usually in the context of detection methods initially involving tissue desiccation and gravimetry, then magnetic resonance techniques, and more recently Raman and terahertz spectroscopy and imaging. The generally higher water content of primary and metastatic cancers, highly proliferative embryonic and fetal tissues is mostly due to an expansion of the extracellular space and passive hyperemia [Citation22,Citation101,Citation117–119]. In highly proliferative placental, embryonic, fetal and testicle tissues, intracellular hyperhydration greatly contributes to increased water contents.
Differential water contents have been extensively described for normal tissues () and malignancies ():
normal breast (whole pre- and post-menopausal breast, fibro-glandular and breast adipose tissues) and breast cancers [Citation69–81];
healthy brain (with specific data for gray and white matter structures), and primary and metastatic brain tumors [Citation84–89];
normal skin and malignant skin tumors [Citation68,Citation90–98];
normal tissues and cancers of the alimentary tract, liver and pancreas (e.g., oral cancer vs. normal mucosa [Citation120], gastric cancer [Citation121], colorectal cancer [Citation122], normal liver and liver metastases [Citation102], hepatocellular carcinomas (HCCs, hepatomas) [Citation101,Citation105], pancreatic cancer [Citation106]. Note: In HCCs, percentual water content increases with histological grades and thus can be used as a potential biomarker for the diagnosis and prognosis of HCCs [Citation101];
adipose tissue [Citation98,Citation123,Citation124];
musculo-skeletal system (e.g., skeletal muscle [Citation98,Citation125,Citation126], tendon [Citation127], cartilage [Citation128], bone [Citation98]);
in prostate cancers, the interstitial volume is enlarged compared to the peripheral zone of normal prostate [Citation107,Citation108]. Controversially, the water content (derived from T1 and T2 measurements in prostate cancers of Gleason grades 2–5) is reported to be less than in peripheral and transition zones of normal prostate tissues [Citation109–111]. In a recent article, Agafonkina et al. [Citation103] have communicated a mean water (moisture) content for healthy prostate of 82% (range: 79.2%–85.5%) and for prostate cancer 84% (range: 79.4–86.3%).
3.3. Differential specific heat capacity of malignant tumors and corresponding normal tissues
As a consequence of generally higher water contents, malignant tumors have a higher specific heat capacity (see and ; for comprehensive databases and literature surveys see [Citation34,Citation35,Citation66,Citation67,Citation82,Citation99,Citation104,Citation129–131]).
Note: (a) During HT treatment of breast cancers, one is often confronted with an increased BF in the tumor compared to normal, surrounding tissue [Citation15,Citation83]. Furthermore, in the treatment field, different tissue types and tissue layers are exposed, to varying degrees, to electromagnetic heating (see ). This complex situation must be considered when quantifying temperature distributions using computational modeling due to different specific heat capacities, water contents, BF rates (and microregional changes thereof during treatment), and thermal conductivities of the tissue layers exposed. (b) The average specific heat capacity for prostate cancers listed in does not consider the generally lower water contents in high-grade prostate cancers, as discussed above. In addition, specific heat capacities have been reported to vary considerably with the extent of cancerous involvement [Citation132].
Table 3. Water contents (Cw) and specific heat capacities (cp) of the multilayer tissue structures exposed in hyperthermia treatment of breast cancers.
3.4. Correlation between specific heat capacity and water content in normal tissues and corresponding malignancies
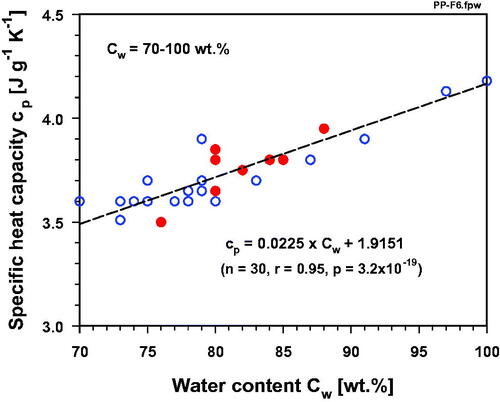
In order to demonstrate the stringent correlation between water content and specific heat capacity (cp) in normal tissues (see ), cp -values are plotted over a large range of water contents (Cw = 10–100 wt.%, values taken from ). In a log-log graph, the correlation can best be described by a linear function. When this correlation is separately presented for high-water-content tissues (Cw ≥ 70 wt.%) and low-water-content tissues (Cw < 70 wt.%), a clear linear relationship is evident only for the higher water contents (), whereas an exponential drop of cp with decreasing water content can be demonstrated in the tissues having lower-range water contents (). For normal tissues an approximately linear correlation between cp and water content (71–84%) was also described by Cooper and Trezek [Citation133]. A close linear relationship was also discussed by Duck [Citation134] for tissues with a water content higher than that of fat. A linear relationship was also suggested by Takata et al. [Citation135] for calculation of the specific heat capacity of pig skin with known water contents. All malignant tissues listed in have water contents > 75 wt.%. These data (red dots in ) fit into the range of the high-water-content normal tissues, i.e., cp-values also exponentially rise with increasing water content of malignant tumors. Breast cancers, skin cancers and malignant brain tumors usually contain 10–27% more water than their surrounding tissues, and thus must be considered as ‘high-heat capacitance tissues’ [Citation83]. Neglecting these clinically relevant differences and using simplified assumptions is, therefore, not justified if, for example, SAR values have to be assessed or temperature distributions have to be modeled for optimizing HT treatment sessions. In this context, we have to remember a quotation of Albert Einstein: ‘Everything should be made as simple as possible, but not one bit simpler’, especially in times of precision medicine.
Figure 5. Specific heat capacity cp of liquid pure water, body fluids, normal human tissues (selection), and biological media as a function of mean water content within the ranges Cw = 10–100 wt.% (5A), Cw = 70–100 wt.% (5 B), and Cw < 70 wt.% (5C) according to data listed in .
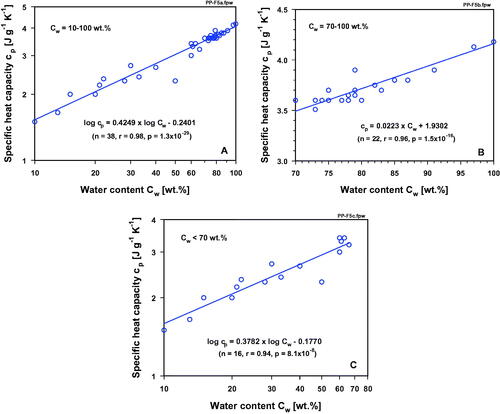
Figure 6. Specific heat capacity cp of liquid pure water, body fluids, normal human tissues (selection), biological media (blue circles), and of tumor tissues (selection, red dots) as a function of mean water content within the range Cw = 70–100 wt.% according to data listed in and .
4. Conclusion
In general, malignant tumors are ‘high-heat capacitance tissues’ compared to their normal surroundings or corresponding, homologous tissues. This pathophysiological characteristic is due to their higher water content and should be considered as another principal factor in modeling temperature distributions, as higher specific heat capacities preferentially facilitate heat deposition in cancerous tissues. One should therefore not primarily, or even exclusively, focus on unknown, non-predictable and/or heterogeneous BF conditions before, during and changes upon fractionated heating sessions [Citation136,Citation137], as BF cannot be the only predictive and overall dominating factor. High water content, which leads to distinctly higher specific heat capacities, may be a more robust pathophysiological factor, particularly due to the additional hydration of tumor tissues which results from intensified microvascular leakages induced by clinically relevant HT. These considerations are of great practical relevance in the clinical setting.
Acknowledgments
The authors thank Professor A. Graham Pockley, Nottingham Trent University (UK), for linguistic support.
Disclosure statement
The authors declare that this review was conducted in the absence of any commercial of financial relationship that could be constructed as a potential conflict of interest.
References
- Peeken JC, Vaupel P, Combs SE. Integrating hyperthermia into modern radiation oncology: What evidence is necessary? Front Oncol. 2017;7:132.
- Elming PB, Sorensen BS, Oei AL, et al. Hyperthermia: the optimal treatment to overcome radiation resistant hypoxia. Cancers. 2019;11(1):60.
- Notter M, Thomsen AR, Nitsche M, et al. Combined wIRA-hyperthermia and hypofractionated re-irradiation in the treatment of locally recurrent breast cancer: evaluation of therapeutic outcome based on a novel size classification. Cancers. 2020;12(3):606.
- Datta NR, Kok HP, Crezee H, et al. Integrating loco-regional hyperthermia into the current oncology practice: SWOT and TOWS analyses. Front Oncol. 2020;10:819.
- Datta NR, Jain BNM, Mathi Z, et al. Hyperthermia: a potential came-changer in the management of cancers in low-middle-income group countries. Cancers. 2022;14(2):315.
- Lee SY, Fiorentini G, Szasz AM, et al. Quo vadis oncological hyperthermia. Front Oncol. 2020;10:1690.
- Schildkopf P, Ott OJ, Frey B, et al. Biological rationales and clinical applications of temperature controlled hyperthermia-implications for multimodal cancer treatments. Curr Med Chem. 2010;17(27):3045–3057.
- Storm FK, Harrison WH, Elliot RS, et al. Normal tissue and solid tumor effects of hyperthermia in animal models and clinical trials. Cancer Res. 1979;39(6 Pt 2):2245–2251.
- Song CW. Effect of local hyperthermia on blood flow and microenvironment: a review. Cancer Res. 1984;44(10):4721s–4730s.
- Vaupel PW, Kelleher DK. Pathophysiological and vascular characteristics of tumours and their importance for hyperthermia: heterogeneity is the key issue. Int J Hyperthermia. 2010;26(3):211–223.
- Wust P, Stahl H, Löffel J, et al. Clinical, physiological and anatomical determinants for radiofrequency hyperthermia. Int J Hyperthermia. 1995;11(2):151–167.
- Vaupel P. Blood flow and oxygenation status of head and neck carcinomas. Adv Exp Med Biol. 1997;428:89–95.
- Hermans R, Lambin P, van der Goten A, et al. Tumoural perfusion as measured by dynamic computed tomography in head and neck carcinoma. Radiother Oncol. 1999;53(2):105–111.
- Rich LJ, Winslow TB, Alberico RA, et al. Enhanced tumour perfusion following treatment with water-filtered IR-a radiation to the thorax in a patient with head and neck cancer. Int J Hyperthermia. 2016;32(5):539–542.
- Vaupel P. Vascularization, blood flow, oxygenation, tissue pH, and bioenergetic status of human breast cancer. Adv Exp Med Biol. 1997;411:243–254.
- van den Berg CAT, van de Kamer JB, de Leeuw AAC, et al. Towards patient specific thermal modelling of the prostate. Phys Med Biol. 2006;51(4):809–825.
- Vaupel P, Kelleher DK. Blood flow and oxygenation status of prostate cancers. Adv Exp Med Biol. 2013;765:299–305.
- Vaupel PW, Kelleher DK. Blood flow and associated pathophysiology of uterine cervix cancers: characterisation and relevance for localised hyperthermia. Int J Hyperthermia. 2012;28(6):518–527.
- Wust P. Thermotherapy in oncology. Boston (MA): Uni-Med Science Publisher; 2016.
- Lang J, Erdmann B, Seebass M. Impact of nonlinear heat transfer on temperature control in regional hyperthermia. IEEE Trans Biomed Eng. 1999;46(9):1129–1138.
- Christophi C, Winkworth A, Muralihdaran V, et al. The treatment of malignancy by hyperthermia. Surg Oncol. 1998;7(1–2):83–90.
- Kiricuta IC, Simplăceanu V. Tissue water content and nuclear magnetic resonance in normal and tumor tissues. Cancer Res. 1975;35(5):1164–1167.
- Greenstein JP. Biochemistry of cancer. New York (NY): Academic Press; 1947.
- Dick JM. Water as a reactant in the differential expression of proteins in cancer. Comput Syst Oncol. 2020;1:e1007.
- Gersing G. Monitoring temperature-induced changes in tissue during hyperthermia by impedance methods. Ann NY Acad Sci. 1999;873:13–20.
- Kelleher DK, Vaupel P. Vascular effects of localized hyperthermia. In: Baronzio GF, Hager ED, editor. Hyperthermia in cancer treatment: a primer. New York (NY): Springer Science; 2006. p. 99–109.
- Pennes HH. Analysis of tissue and arterial blood temperatures in the resting human forearm. J Appl Physiol. 1948;1(2):93–122.
- Giordano MA, Gutierrez G, Rinaldi C. Fundamental solutions to the bioheat equation and their application to magnetic fluid hyperthermia. Int J Hyperthermia. 2010;26(5):475–484.
- Wärmekapazitäten. Available from: https://de.wikibooks.org/wiki/Tabellensammlung_Chemie/_spezifischeWärmekapazitäten
- Available from: https://www.chemie.de/lexikon/Wasser_%28Stoffdaten%29.html
- Brewer PG, Peltzer ET. The molecular basis for the heat capacity and thermal expansion of natural waters. Geophys Res Lett. 2019;46(22):13227–13213.
- Sun H, Feistel R, Koch M, et al. New equations for density, entropy, heat capacity, and potential temperature of a saline thermal fluid. Deep-Sea Res I. 2008;55(10):1304–1310.
- Grunberg L. Properties of sea water concentrates. International symposium on fresh water from the sea (3rd: 1970: Dubrovnik, Yugoslavia). Proceedings of the International Symposium on Fresh Water from the Sea. Athens [s.n.]. Vol. 1. 1970. p. 31–39.
- Giering K, Lamprecht I, Minet O. Specific heat capacities of human and animal tissues. Proc SPIE. 1996;2624:188–197.
- McIntosh RL, Anderson V. A comprehensive tissue properties database provided for the thermal assessment of a human at rest. Biophys Rev Lett. 2010;05(03):129–151.
- Thermal conductivity. In Tissue properties. ITIS Foundation. Database. [cited 2021 Dec 15]. Available from: https://itis.swiss/vitrual-population/tissue properties/database/thermal-conductivity/
- Ahuja AS, Prasad KN, Hendee WR, et al. Thermal conductivity and diffusivity of neuroblastoma tumor cells. Med Phys. 1978;5(5):418–421.
- Vaupel P. Effect of percentual water content in tissues and liquids on the diffusion coefficients of O2, CO2, N2, and H2. Pflugers Arch. 1976;361(2):201–204.
- Grote J, Süsskind R, Vaupel P. Oxygen diffusivity in tumor tissue (DS-Carcinosarcoma) under temperature conditions within the range of 20–40 °C. Pflugers Arch. 1977;372(1):37–42.
- Krüger W, Gersing E, Vaupel P. Electrical impedance spectroscopy for in vivo detection of structural changes in experimental tumors during local hyperthermia. In: Gersing E, editor. Proceedings of IXth international conference electrical bio-impedance, 225–228. Göttingen, Germany: Goltze-Verlag; 1995.
- Gersing E, Kelleher DK, Vaupel P. Tumour tissue monitoring during photodynamic and hyperthermic treatment using bioimpedance spectroscopy. Physiol Meas. 2003;24(2):625–637.
- Britannica Online Encyclopedia. Water. Structure of water. Liquid water. 2021. Available from: https://www.britannica.com/print/article/636754
- Müller W, Piazena H, Vaupel P. From sun to wIRA. In: Vaupel P, editor. Water-filtered infrared-A (wIRA) irradiation: from research to clinical settings. Cham, Switzerland: Springer Nature; 2022. p. 17–32.
- Kaatze U, Behrends R, Pottel R. Hydrogen network fluctuations and dielectric spectrometry of liquids. J Non-Crystalline Solids. 2002;305:9–28.
- Lenk R. Dielektrische Verluste. In: Lenk R, editor. Brockhaus ABC Physik. Vol. 1. Leipzig, Germany: Brockhaus Verlag; 1989. ISBN 3-325-00191-2.
- Schulze R. Strahlenklima der Erde. In: Brügel W, Jäger R, editors. Wissenschaftliche Fortschrittsberichte. Bd 73. Darmstadt, Germany: Dr. Dietrich Steinkopf-Verlag; 1970.
- ISO 20473. Optics and photonics – spectral bands. 2007.
- Stauffer PR. Evolving technology for thermal therapy of cancer. Int J Hyperthermia. 2005;21(8):731–744.
- Trefná HD, Crezee H, Schmidt M, et al. Quality assurance guidelines for superficial hyperthermia clinical trials: I. Clinical requirements. Int J Hyperthermia. 2017;33(4):471–482.
- Dobsicek Trefná HD, Crezee J, Schmidt M, et al. Quality assurance guidelines for superficial hyperthermia clinical trials: II. Technical requirements for heating devices. Strahlenther Onkol. 2017;193(5):351–366.
- Hale GM, Querry MR. Optical constants of water in the 200 nm to 200 micron wavelength region. Appl Opt. 1973;12(3):555–563.
- Downing HD, Williams D. Optical constants of water in the infrared. J Geophys Res. 1975;80(12):1656–1661.
- Palmer KF, Williams D. Optical properties of water in the near infrared. J Opt Soc Am. 1974;64(8):1107–1110.
- Water absorption spectrum. [cited 2021 Dec 10]. Available from: http://www1.lsbu.ac.uk./water/water_vibrational_spectrum.html#blue
- Chaplin M. 2021. Water absorption spectrum. Water, structure and science. Available from: http://www.acamedia.info/sciences/J_G/envrad/microwaves/index.htm
- Warren SG. Optical properties of ice and snow. Philos Trans A Math Phys Eng Sci. 2019;377(2146):20180161.
- Chaplin MF. A proposal for the structuring of water. Biophys Chem. 2000;83(3):211–221.
- Debye P. Polare Molekeln. Leipzig: S. Hirzel-Verlag/polar molecules. New York (NY): The Chemical Catalogue Company; 1929.
- Lunkenheimer P, Emmert S, Gulich R, et al. Electromagnetic-radiation absorption of water. Phys Rev E. 2017;96:1–10.
- Gadani DH, Rana VA, Bhatnagar SP, et al. Effect of salinity on the dielectric properties of water. Indian J Pure Appl Phys. 2012;50:405–410.
- Pethig R, Kell DB. The passive electrical properties of biological systems: their significance in physiology, biophysics and biotechnology. Phys Med Biol. 1987;32(8):933–970.
- Ebert H. Physikalisches Taschenbuch, 5. In: Ebert H, editor. Auflage. Braunschweig: Vieweg-Verlag; 1978.
- Foster KR, Schepps JL, Schwan HP. Microwave dielectric relaxation in muscle. A second look. Biophys J. 1980;29(2):271–282.
- Schepps JL, Foster KR. The UHF and microwave dielectric properties of normal and tumour tissues: variation in dielectric properties with tissue water content. Phys Med Biol. 1980;25(6):1149–1159.
- Kok HP, Crezee J. A comparison of the heating characteristics of capacitive and radiative superficial hyperthermia. Int J Hyperthermia. 2017;33(4):378–386.
- IT’IS Foundation. Tissue properties. [cited 2021 Dec 15]. Available from: https://itis.swiss/virtual-population/tissueproperties/database/heat-capacity/
- Hasgall PA, Di Gennaro F, Baumgartner C, et al. IT'IS database for thermal and electromagnetic parameters of biological tissues. Version 4.1, February 22, 2022. DOI:10.13099/VIP21000-04-1. https://itis.swiss/virtual-population/tissue-properties/overview/
- Warner RR, Myers MC, Taylor DA. Electron probe analysis of human skin: determination of the water concentration profile. J Invest Dermatol. 1988;90(2):218–224.
- Chu DZJ, Yamanashi WS, Frazer J, et al. Proton NMR of human breast tumors: correlation with clinical prognostic parameters. J Surg Oncol. 1987;36(1):1–4.
- Tromberg BJ, Shah N, Lanning R, et al. Non-invasive in vivo characterization of breast tumors using photon migration spectroscopy. Neoplasia. 2000;2(1–2):26–40.
- Spinelli L, Torricelli A, Pifferi A, et al. Bulk optical properties and tissue components in the female breast from multiwavelength time-resolved optical mammography. J Biomed Opt. 2004;9:1137–1142.
- Cerussi A, Shah N, Hsiang D, et al. In vivo absorption, scattering, and physiologic properties of 58 malignant breast tumors determined by broadband diffuse optical spectroscopy. J Biomed Opt. 2006;11(4):044005.
- Brooksby B, Pogue BW, Jiang S, et al. Imaging breast adipose and fibroglandular tissue molecular signatures by using hybrid MRI-guided near-infrared spectral tomography. Proc Natl Acad Sci USA. 2006;103(23):8828–8833.
- Chung SH, Cerussi AE, Klifa C, et al. In vivo water state measurements in breast cancer using broadband diffuse optical spectroscopy. Phys Med Biol. 2008;53(23):6713–6727.
- Boyd N, Martin L, Chavez S, et al. Breast-tissue composition and other risk factors for breast cancer in young women: a cross-sectional study. Lancet Oncol. 2009;10(6):569–580.
- Wang J, Pogue BW, Jiang S, et al. Near-infrared tomography of breast cancer hemoglobin, water, lipid, and scattering using combined frequency domain and CW measurement. Opt Lett. 2010;35(1):82–84.
- Quarto G, Spinelli L, Pifferi A, et al. Estimate of tissue composition in malignant and benign breast lesions by time-domain optical mammography. Biomed Opt Express. 2014;5(10):3684–3698.
- Hennessey S, Huszti E, Gunasekura A, et al. Bilateral symmetry of breast tissue composition by magnetic resonance in young women and adults. Cancer Causes Control. 2014;25(4):491–497.
- Martellosio A, Pasian M, Bozzi M, et al. 0.5-50 GHz dielectric characterization of breast cancer tissues. Electron Lett. 2015;51(13):974–975.
- Taroni P, Paganoni AM, Ieva F, et al. Non-invasive optical estimate of tissue composition to differentiate malignant from benign breast lesions: a pilot study. Sci Rep. 2017;7:40683.
- Ohmae E, Yoshizawa N, Yoshimoto K, et al. Comparison of lipid and water contents by time-domain diffuse optical spectroscopy and dual-energy computed tomography in breast cancer patients. Appl Sci. 2019;9(7):1482.
- Giering K, Lamprecht I, Minet O, et al. Determination of the specific heat capacity of healthy and tumorous human tissue. Thermochim Acta. 1995;251:199–205.
- Chanmugam A, Hatwar R, Herman C. Thermal analysis of cancerous breast model. Int Mech Eng Congress Expo. 2012;2012:134–143.
- Andersen C. In vivo estimation of water content in cerebral white matter of brain tumour patients and normal individuals: towards a quantitative brain oedema definition. Acta Neurochir (Wien). 1997;139(3):249–256.
- Whittall KP, MacKay AL, Graeb DA, et al. In vivo measurement of T2 distributions and water contents in normal human brain. Magn Reson Med. 1997;37(1):34–43.
- Fatouros PP, Marmarou A. Use of magnetic resonance imaging for in vivo measurements of water content in human brain: method and normal values. J Neurosurg. 1999;90(1):109–115.
- Tong Z, Yamaki T, Harada K, et al. In vivo quantification of the metabolites in normal brain and brain tumors by proton MR spectroscopy using water as an internal standard. Magn Reson Imaging. 2004;22(5):735–742.
- Streitberger KJ, Lilaj L, Schrank F, et al. How tissue fluidity influences brain tumor progression. Proc Natl Acad Sci USA. 2020;117(1):128–134.
- Sano F, Washio T, Matsumae M. Measurements of specific heat capacities required to build computer simulation models for laser thermotherapy of brain lesions. Tokai J Exp Clin Med. 2019;44(4):80–84.
- Tronnier H. Der Hydratationszustand der Haut. J Soc Cosmet Chem. 1981;32:175–192.
- Blank IH, Moloney J, Emslie AG, et al. The diffusion of water across the stratum corneum as a function of its water content. J Invest Dermatol. 1984;82(2):188–194.
- Woodward RM, Cole BE, Wallace VP, et al. Terahertz pulse imaging in reflection geometry of human skin cancer and skin tissue. Phys Med Biol. 2002;47(21):3853–3863.
- Nakagawa N, Matsumoto M, Sakai S. In vivo measurement of the water content in the dermis by confocal Raman spectroscopy. Skin Res Technol. 2010;16(2):137–141.
- Gniadecka M, Nielsen OF, Wulf HC. Water content and structure in malignant and benign skin tumours. J Mol Struct. 2003;661–662(2):405–410.
- Mehta P, Chand K, Narayanswamy D, et al. Microwave reflectometry as a novel diagnostic tool for detection of skin cancers. IEEE Trans Instrum Meas. 2006;55(4):1309–1316.
- Taeb A, Gigoyan S, Safavi‐Naeini S. Millimetre-wave waveguide reflectometers for early detection of skin cancer. IET Microw Antennas Propagat. 2013;7(14):1182–1186.
- Mohammed BJ, Naqvi SAR, Manoufali M, et al. Changes in epidermal dielectric properties due to skin cancer across the band 1 to 50 GHz. In: Conference Australian Microwave Symposium. Piscataway (NJ): IEEE; 2018.
- Provyn S, Clarys JP, Wallace J, et al. Quality control, accuracy, and prediction capacity of dual energy X-ray absorptiometry variables and data acquisition. J Physiol Anthropol. 2008;27(6):317–323.
- Popovic ME, Minceva M. Thermodynamic properties of human tissues. Therm Sci. 2020;24(6 Part B):4115–4133.
- Lentner C. Geigy scientific tables. 8th ed., Vol. 1. Basle, Switzerland: Ciba Geigy; 1981.
- Wang M, Yuan F, Wei Y, et al. Hepatocellular carcinoma: in vivo evaluation of water percentage as a prognostic biomarker using magnetic resonance imaging 3D-VIBE multiecho Dixon. Cancer Biother Radiopharm. 2018;33(7):300–306.
- Ueda J, Kobayashi Y, Kenko Y, et al. Distribution of water, fat, and metals in normal liver and in liver metastases influencing attenuation on computed tomography. Acta Radiol. 1988;29(1):33–39.
- Agafonkina IV, Belozerov AG, Vasilyev AO, et al. Thermal properties of human soft tissue and its equivalents in a wide low temperature range. J Eng Phys Thermophy. 2021;94(1):233–246.
- Bianchi L, Cavarzan F, Ciampitti L, et al. Thermophysical and mechanical properties of biological tissues as a function of temperature: a systematic literature review. Int J Hyperthermia. 2022;39(1):297–340.
- Ross KFA, Gordon RE. Water in malignant tissue, measured by cell refractometry and nuclear magnetic resonance. J Microsc. 1982;128(Pt 1):7–21.
- Penet MF, Kakkad S, Wildes F, et al. Water and collagen content are high in pancreatic cancer: implications for quantitative metabolic imaging. Front Oncol. 2020;10(599204):599204.
- Buckley DL, Roberts C, Parker GJM, et al. Prostate cancer: evaluation of vascular characteristics with dynamic contrast-enhanced T1-weighted MR imaging – initial experience. Radiology. 2004;233(3):709–715.
- Padhani AR, Gapinski CJ, Macvicar DA, et al. Dynamic contrast enhanced MRI of prostate cancer. Correlation with morphology and tumour stage, histological grade and PSA. Clin Radiol. 2000;55(2):99–109.
- Ali JH, Wang WB, Zevallos M, et al. Near infrared spectroscopy and imaging to probe differences in water content in normal and cancer human prostate tissues. Technol Cancer Res Treat. 2004;3(5):491–497.
- Han D, Choi MH, Lee YJ, et al. Feasibility of novel tree-dimensional magnetic resonance fingerprinting of the prostate gland: Phantom and clinical studies. Korean J Radiol. 2021;22(8):1332–1340.
- Lee CH, Hung LC. Quantitative T2-mapping using MRI for detection of prostate malignancy: a systematic review of the literature. Acta Radiol. 2019;60(9):1181–1189.
- Woodard HQ, White DR. The composition of body tissues. Br J Radiol. 1986;59(708):1209–1219.
- Rauen HM. Biochemisches Taschenbuch (E-Book). Berlin, Heidelberg, Germany: Springer; 2013.
- Ghita A, Hubbard T, Matousek P, et al. Noninvasive detection of differential water content inside biological samples using deep Raman spectroscopy. Anal Chem. 2020;92(14):9449–9453.
- Gullino PM, Grantham FH, Smith SH. The interstitial water space of tumors. Cancer Res. 1965;25:727–731.
- Vaupel P, Müller-Klieser W. Interstitieller Raum und Mikromilieu in malignen Tumoren. Progr Appl Microcirc. 1983;2:78–90.
- Aronen HJ, Pardo FS, Kennedy DN, et al. High microvascular blood volume is associated with high glucose uptake and tumor angiogenesis in human gliomas. Clin Cancer Res. 2000;6(6):2189–2200.
- Gullino PM. Extracellular compartments of solid tumors. In Becker FF, editor. Cancer. Vol. 3. New York (NY): Plenum Press; 1975. p. 327–354.
- Vaupel P. Pathophysiology of solid tumors. In: Molls M, Vaupel P, Nieder C, Anscher MS, editors. The impact of tumor biology on cancer treatment and multidisciplinary strategies. Berlin, Heidelberg, Germany: Springer; 2009. p. 51–92.
- Barroso EM, Smits RWH, Bakker Schut TC, et al. Discrimination between oral cancer and healthy tissue based on water content determined by Raman spectroscopy. Anal Chem. 2015;87(4):2419–2426.
- Wahaia F, Kasalynas I, Minkevicius L, et al. Terahertz spectroscopy and imaging for gastric cancer diagnosis. J Spectr Imaging. 2020;9:a2.
- Ganeshan B, Miles K, Afaq A, et al. Texture analysis of fractional water content images acquired during PET/MRI: initial evidence for an association with total lesion glycolysis, survival and gene mutation profile in primary colorectal cancer. Cancers. 2021;13(11):2715.
- Buengner M. Untersuchungen über die Zusammensetzung des menschlichen Fettgewebes. Z Ges Exp Med. 1929;67(1):147–165.
- Thomas LW. The chemical composition of adipose tissue of man and mice. Q J Exp Physiol Cogn Med Sci. 1962;47:179–188.
- Heymsfield SB, Stevens V, Noel R, et al. Biochemical composition of muscle in normal and semistarved human subjects: relevance to anthropometric measurements. Am J Clin Nutr. 1982;36(1):131–142.
- Talso PJ, Spafford N, Blaw M. The metabolism of water and electrolytes on congestive heart failure. 1. The electrolyte and water content of normal human skeletal muscle. Translat Res. 1953;41(2):P281–286.
- Lozano PF, Scholze M, Babian C, et al. Water-content related alterations in macro and micro scale tendon biomechanics. Sci Rep. 2019;9(1):7887.
- Shiguetomi-Medina JM, Ramirez JL, Stodkilde-Jorgensen H, et al. Systematized water content calculation in cartilage using T1-mapping MR estimations: design and validation of a mathematical model. J Orthopaed Traumatol. 2016;18:217–220.
- Giering K, Minet O, Lamprecht I, et al. Review of thermal properties of biological tissues. SPIE Proc PM. 1995;25:45–65.
- Gabriel C, Gabriel S, Corthout E. The dielectric properties of biological tissues: I. Literature survey. Phys Med Biol. 1996;41(11):2231–2249.
- Mohammadi A, Bianchi L, Asadi S, et al. Measurements of ex vivo liver, brain and pancreas thermal properties as function of temperature. Sensors. 2021;21(12):4236.
- Patch SK, Rao N, Kelly H, et al. Specific heat capacity of freshly excised prostate specimens. Physiol Meas. 2011;32(11):N55–N64.
- Cooper TE, Trezek GJ. Correlation of thermal properties of some human tissue with water content. Aerosp Med. 1971;42(1):24–27.
- Duck FA. Physical properties of tissues – a comprehensive reference book. San Diego (CA): Academic Press; 1990.
- Takata AN, Zanevald L, Richter W. 1977. Laser-induced thermal damage in skin. USAF School of Aerospace Med., Brooks AFB, TX Rep. SAM-TR-77-38.
- Vaupel P, Horsman MR. Tumour perfusion and associated physiology: characterization and significance for hyperthermia. Int J Hyperthermia. 2010;26(3):209–210.
- Dewhirst MW. 2021. The inextricable and exasperating link between hyperthermia and tumor hypoxia. (Lecture) 13th International Congress of Hyperthermic Oncology, Rotterdam (NL). Book of Abstract.