
Article title: ESHO benchmarks for computational modeling and optimization in hyperthermia therapy
Authors: Paulides MM, Rodrigues DB, Bellizzi GG, Sumser K, Curto S, Neufeld E, Montanaro H, Kok HP, Trefna HD
Journal: International Journal of Hyperthermia
Bibliometrics: Volume 38, Number 1, pages 1425–1442
DOI: http://dx.doi.org/10.1080/02656736.2021.1979254
When the above article was first published online an error were found in Table 3 and Table A1.
In Table 3, the baseline and under stress values are given in single row, which looks like perfusion value is negative. 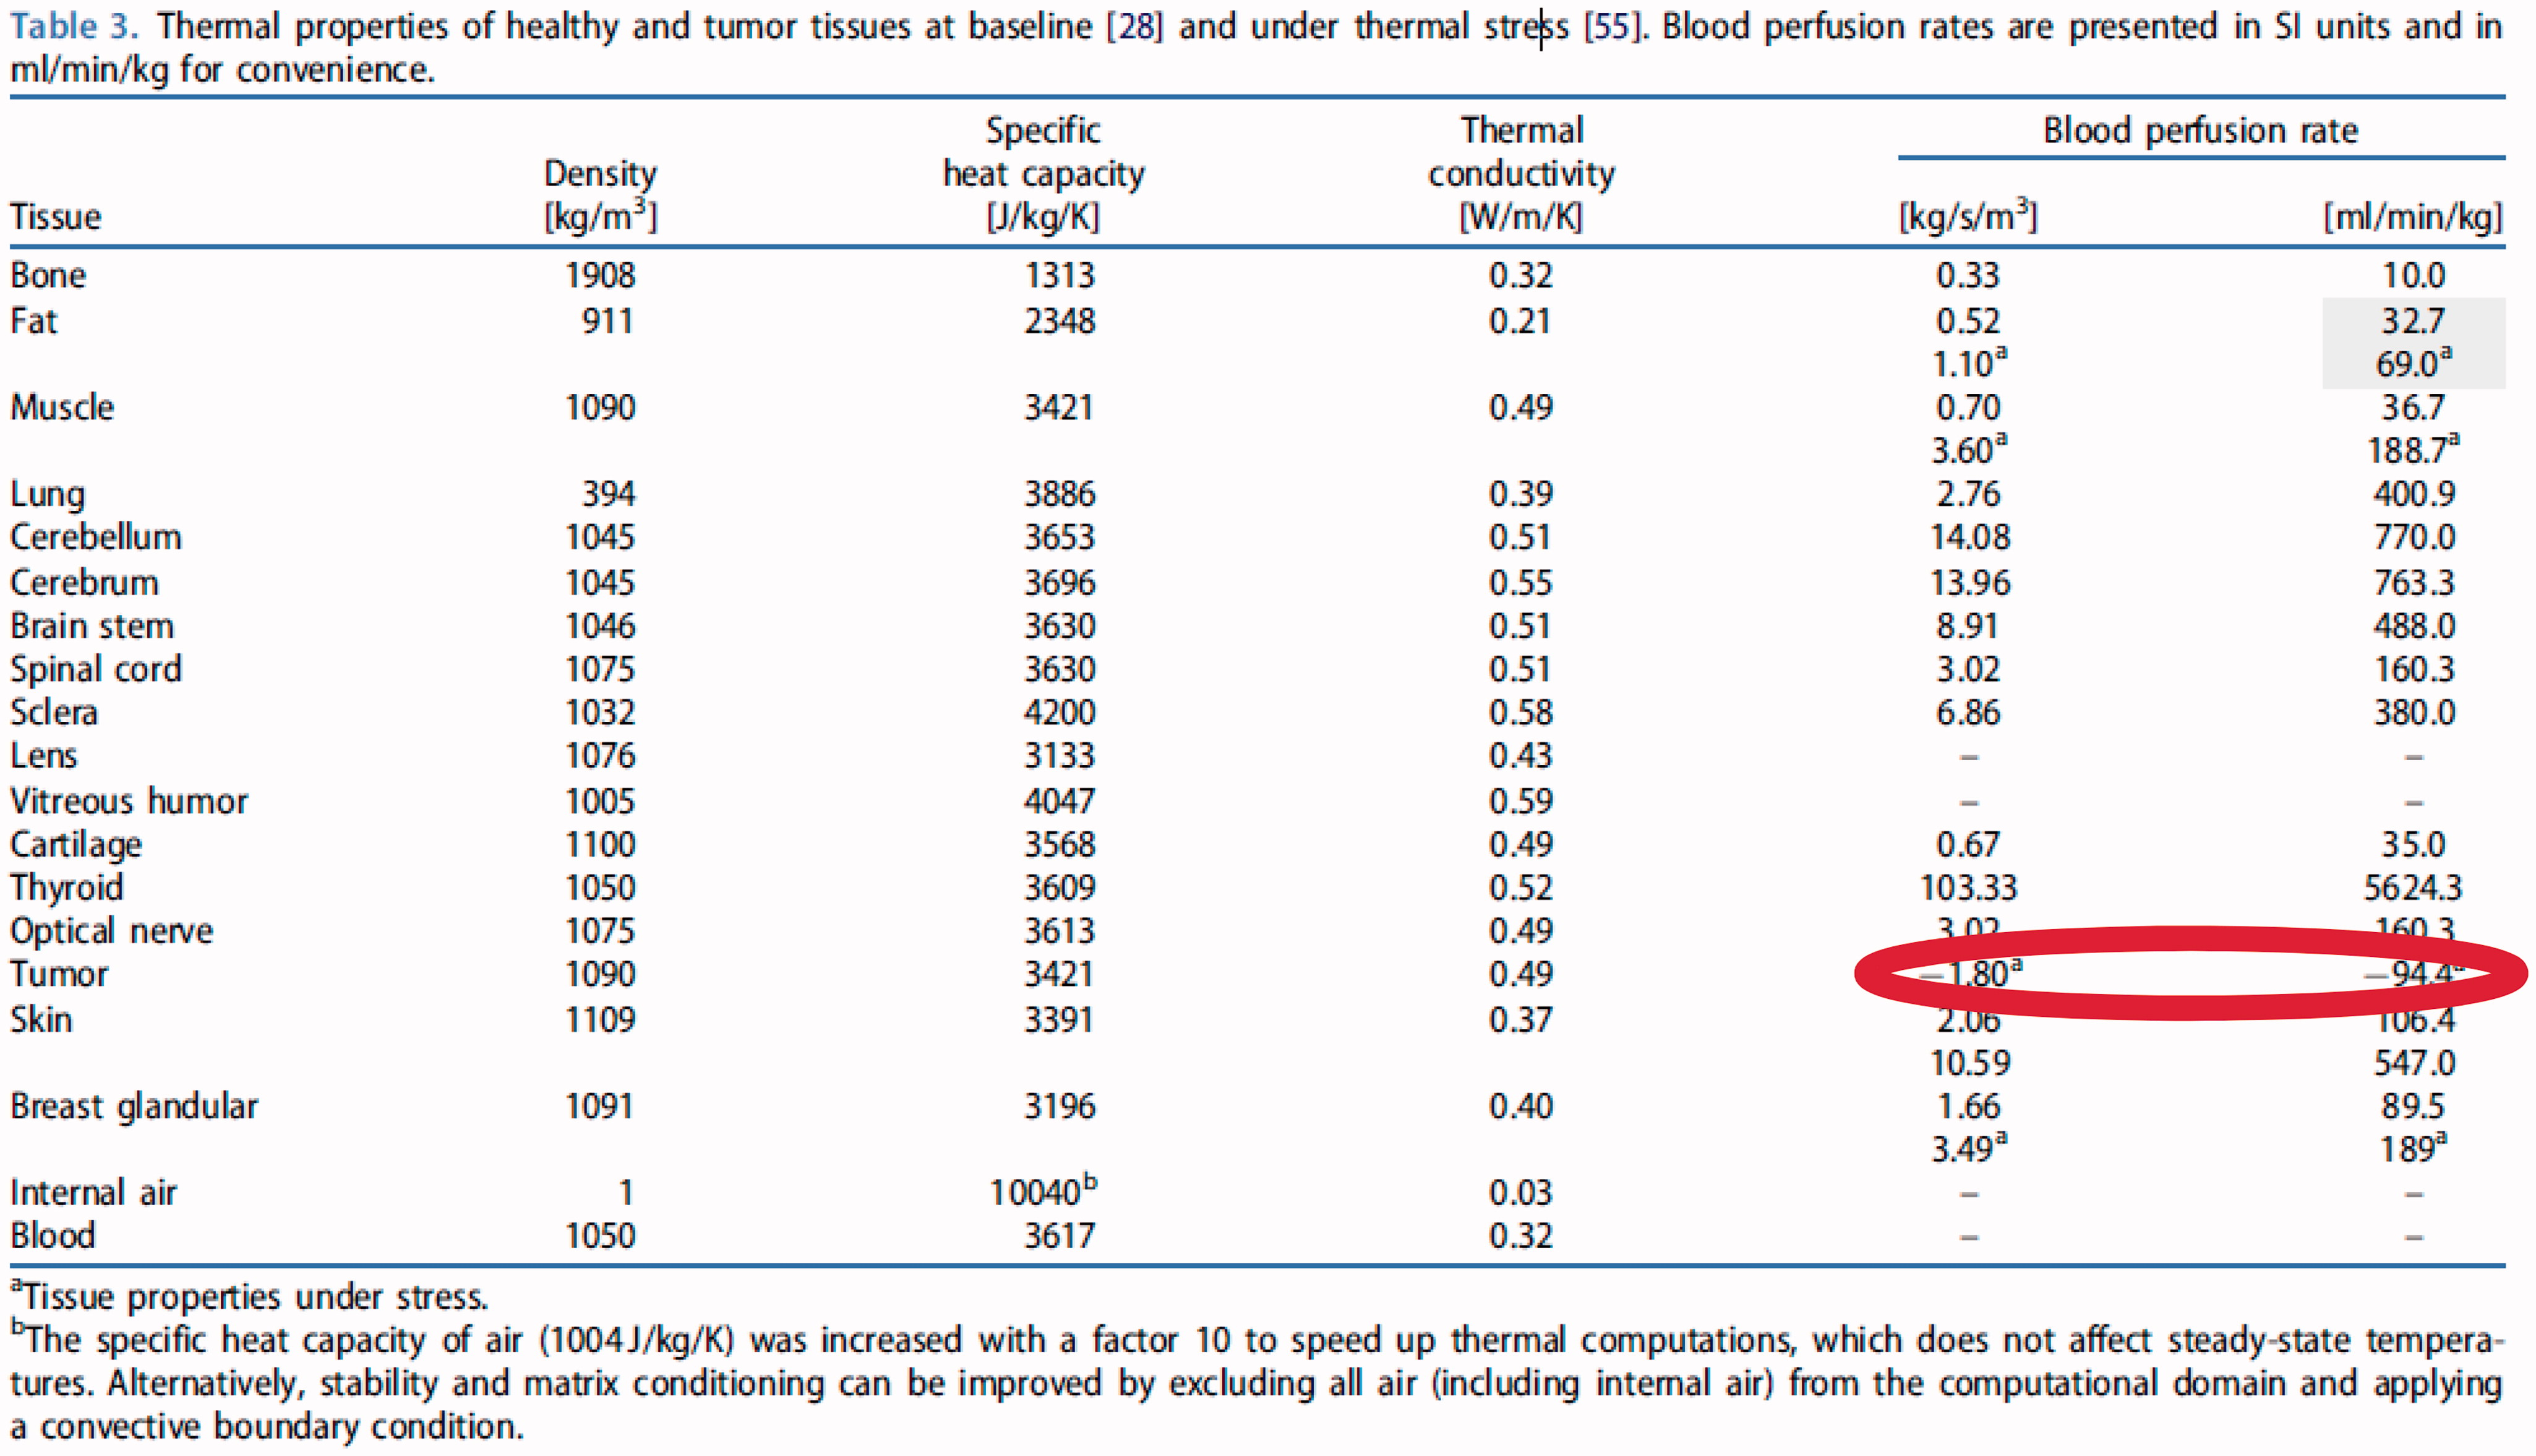
The correct table should look like below. Tumor blood perfusion line should have two rows, similar to “Muscle” and “Fat” tissue where baseline and under stress values shown separately. For clarification, “–” sign in the table should best be changed with “N/A” also for tissues “Lens, Vitreous humor, Internal Air, Blood”. The correct table should be:
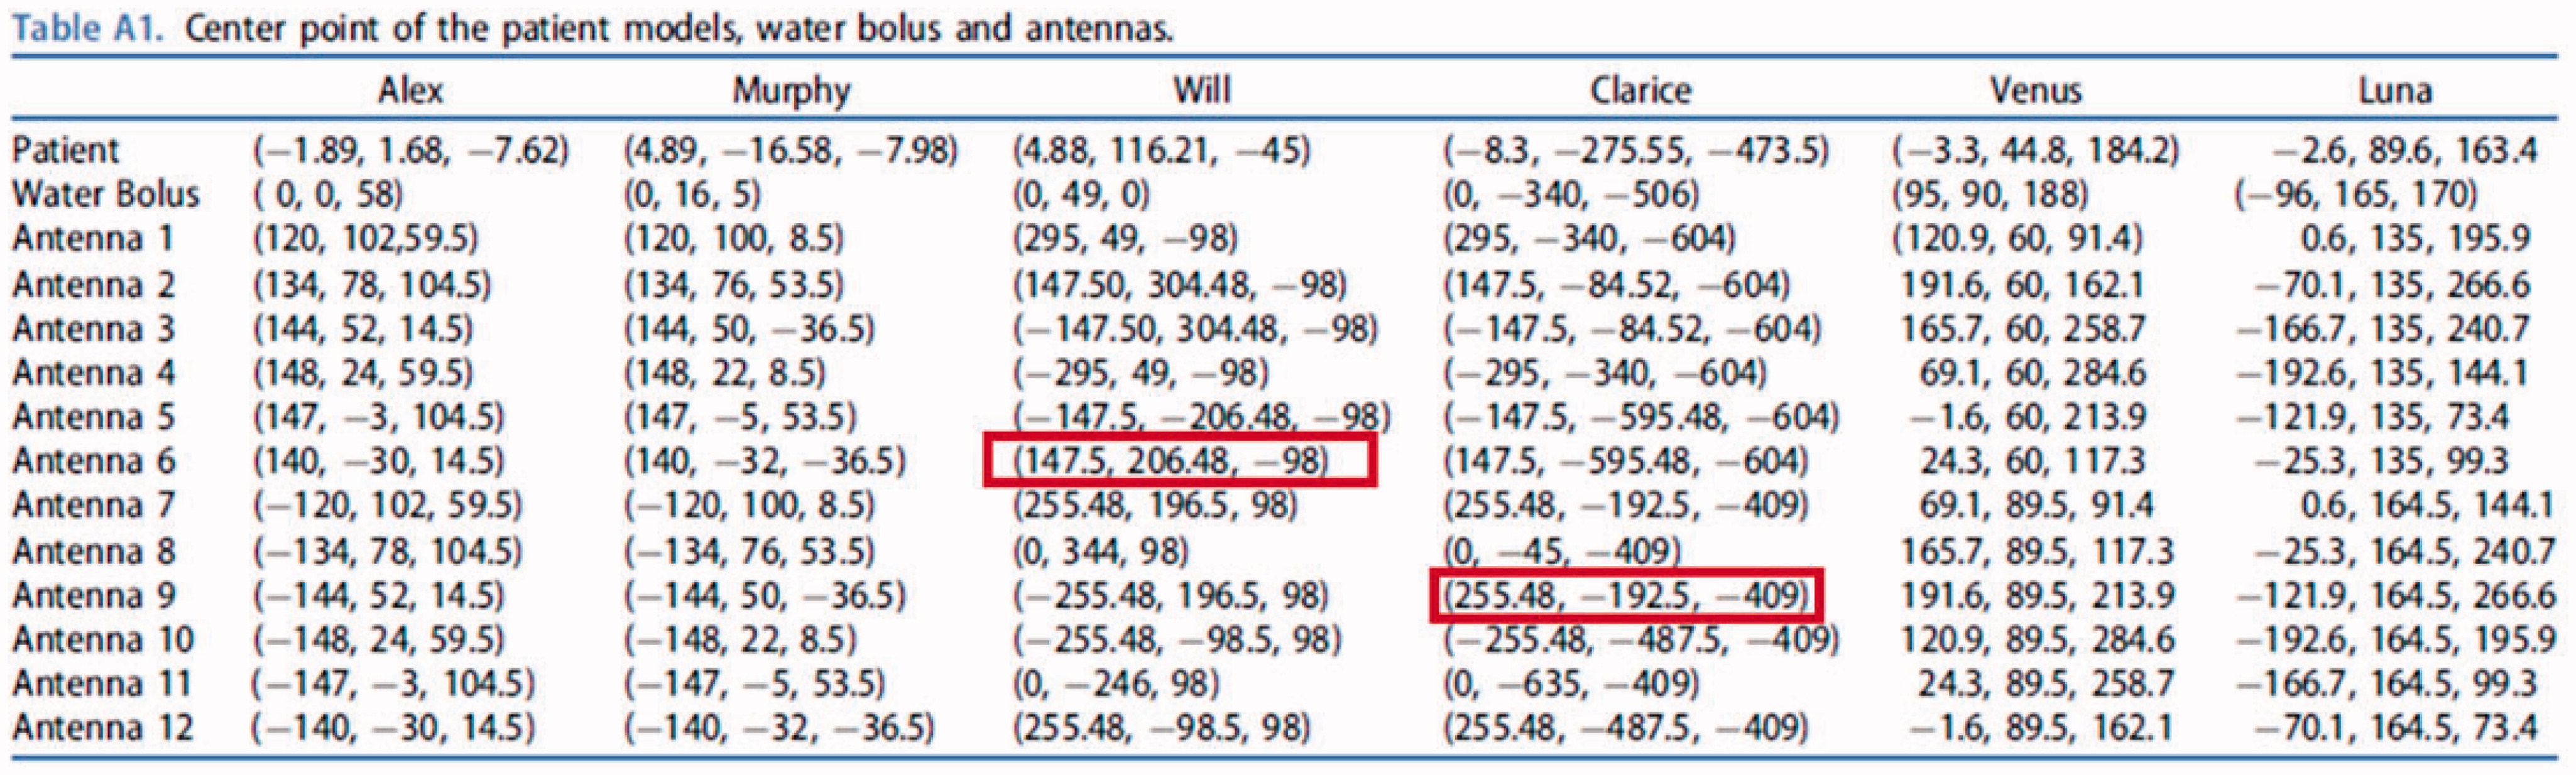
In Table A1, the antenna locations for Will Antenna 6 and Clarice Antenna 7 and 9 are given incorrectly. The correct values are updated.
“Row:Will, Column:Antenna 6 should be (147.5, –206.48, –98)” currently given as (147.5, 206.48, –98)
“Row:Clarice, Column:Antenna 9 should be (–255.48, –192.5, –409)” currently given as (255.48, –192.5, –409)
Also please add parenthesis for Venus and Luna rows and update the caption as: “Table A1. Center point of the patient models, water bolus and antennas. All values are given in millimeters.”
The complete correct table is given below:
The online version of this article has been corrected.
Table 3. Thermal properties of healthy and tumor tissues at baseline [28] and under thermal stress [56].
Table A1. Center point of the patient models, water bolus and antennas. All values are given in millimeters.