
Abstract
Objectives: To develop and apply magnetic resonance imaging (MRI) parameter-based machine learning (ML) models to predict non-perfused volume (NPV) reduction and residual regrowth of uterine fibroids after high-intensity focused ultrasound (HIFU) ablation.
Methods: MRI data of 573 uterine fibroids in 410 women who underwent HIFU ablation from the Chongqing Haifu Hospital (training set, N = 405) and the First Affiliated Hospital of Chongqing Medical University (testing set, N = 168) were retrospectively analyzed. Fourteen MRI parameters were screened for important predictors using the Boruta algorithm. Multiple ML models were constructed to predict NPV reduction and residual fibroid regrowth in a median of 203.0 (interquartile range: 122.5–367.5) days. Furthermore, optimal models were used to plot prognostic prediction curves.
Results: Fourteen features, including postoperative NPV, indicated predictive ability for NPV reduction. Based on the 10-fold cross-validation, the best average performance of multilayer perceptron achieved with R2 was 0.907. In the testing set, the best model was linear regression (R2 =0.851). Ten features, including the maximum thickness of residual fibroids, revealed predictive power for residual fibroid regrowth. Random forest model achieved the best performance with an average area under the curve (AUC) of 0.904 (95% confidence interval (CI), 0.869–0.939), which was maintained in the testing set with an AUC of 0.891 (95% CI, 0.850–0.929).
Conclusions: ML models based on MRI parameters can be used for prognostic prediction of uterine fibroids after HIFU ablation. They can potentially serve as a new method for learning more about ablated fibroids.
Introduction
Uterine fibroids are the most common benign gynecological tumors causing significant morbidity; it has been postulated that they occur in over 70% of women by the onset of menopause. They may be asymptomatic or cause symptoms, including menorrhagia, pelvic pain, bladder dysfunction, constipation, and infertility [Citation1–3]. Over the past decade, the treatment of uterine fibroids has gradually progressed from traditional surgery to minimally invasive or noninvasive procedures [Citation4]. As the only noninvasive treatment for uterine fibroids, high-intensity focused ultrasound (HIFU) has been widely used [Citation5]. Previous studies have demonstrated that HIFU ablation is safe and effective [Citation6,Citation7]. The re-intervention rate of uterine fibroids after HIFU ablation was reported as 20.7% in a long-term follow-up, mainly due to the symptomatic recurrence caused by tumor regrowth [Citation8]. Uterine fibroids are composed of the ablated part and the residual part after HIFU ablation; hence, the tumor regrowth is the comprehensive result of the changes in these two parts. Therefore, studying the two parts simultaneously is the key to a better understanding of the prognosis of uterine fibroids after HIFU ablation.
Magnetic resonance imaging (MRI) does not cause radiation exposure and offers the best soft-tissue resolution, making it an ideal tool to evaluate the non-perfused volume (NPV), which best reflects the coagulation necrosis volume [Citation7,Citation9], and residual fibroid volume (RFV) after HIFU ablation. Documented factors influencing tumor prognosis include patients age, uterine fibroids size and location, the degree of contrast enhancement of uterine fibroids on contrast-enhanced magnetic resonance imaging (CE-MRI), the signal intensity of uterine fibroids on T2 weighted image (T2WI), and the post-HIFU non-perfused volume ratio (NPVR) [Citation10–12]. For the prognosis of uterine fibroids treated with HIFU ablation, most studies focused on the overall volume changes in uterine fibroids [Citation13]. There is no research on NPV and RFV and an objective model that has been published to predict the prognosis after HIFU.
With the advent of the medical big data era, machine learning (ML), which is advantageous for analyzing and processing massive data, has gradually become a powerful auxiliary tool for predicting prognosis and making clinical decisions [Citation14]. In our study, NPV reduction is defined as subtracting the follow-up NPV from post-HIFU NPV, and residual fibroid regrowth is defined as an increase >10% in RFV [Citation11]. These are employed as the index for post-HIFU prognosis. This study aimed to apply ML models to predict the NPV reduction and residual fibroid regrowth of uterine fibroids after HIFU ablation.
Materials and methods
Patients
This retrospective study was conducted with the approval of the Ethics Committees of the Chongqing Haifu Hospital (IRB-2022002) and the First Affiliated Hospital of Chongqing Medical University (IRB-2006016). The requirement for informed consent was waived due to the retrospective nature of the study. Data from patients with uterine fibroids who underwent HIFU ablation at the Chongqing Haifu Hospital from June 2011 to July 2020 and the First Affiliated Hospital of Chongqing Medical University from February 2008 to July 2019 were retrospectively evaluated. All single and multiple uterine fibroids were treated with Model-JC Focused Ultrasound Tumor Therapeutic System (Chongqing Haifu Medical Technology Co., Ltd., Chongqing, China). The detailed information regarding treated uterine fibroids are presented in . The system was monitored in real-time using a color Doppler ultrasound scanner (Mylab 70, Esaote, Italy) during treatment. The procedure of HIFU ablation was similar to previous studies [Citation12,Citation15,Citation16]. Patients with MRI data obtained at the following time points were included: before treatment, one day post-HIFU, and during follow-up. Finally, 405 eligible cases from the Chongqing Haifu Hospital were selected as the training set, and 168 eligible cases from the First Affiliated Hospital of Chongqing Medical University were used as the testing set for model validation. All patients underwent follow-up medical record reviews and telephone interviews to assess the occurrence of re-intervention.
MRI examinations
CE-MRI pelvic scans were performed for each patient prior to treatment, one day post-HIFU, and follow-up examination to evaluate the feasibility and efficacy of HIFU in the treatment of uterine fibroids. MRI examinations were performed using a 3 T MRI (GE Medical System, Milwaukee, WI, USA) and a Magnetom 1.5 T MRI system (Umr570, United Imaging Company, Shanghai, China). T1-weighted imaging, T2-weighted imaging (T2WI), and CE-MRI sequences were scanned, and sagittal, transverse, and coronal planes were obtained. Specific scan parameters are presented in .
Table 1. MRI scan parameters.
MRI assessment and measurement
MicroSea 3D Image Processing Software (Chongqing MicroSea Software Development Co., Ltd., Chongqing, China) was used to measure the abdominal fat layer thickness and the maximum anteroposterior distance from the surface to the center of the fibroid before treatment. According to the International Federation of Gynecology and Obstetrics (FIGO) uterine fibroid classification criteria [Citation17], each fibroid was classified into types 0–8; fibroids were classified into four types according to signal intensity on pretreatment T2WI as follows: type I: hypointense, signal intensity equal to that of the skeletal muscle; type II: isointense, signal intensity lower than that of the uterine myometrium but higher than that of the skeletal muscle; type III: heterogeneous hyperintense; and type IV: homogeneous hyperintense. Based on the degree of enhancement on CE-MRI, uterine fibroids were divided into three types: lack of blood supply (lower degree of enhancement than the myometrium), moderate blood supply (equal degree of enhancement as the myometrium), and rich blood supply (higher degree of enhancement than the myometrium) [Citation18]. The number of uterine fibroids in each patient was counted.
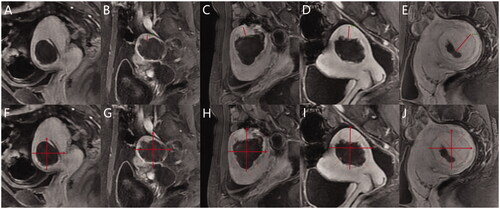
In the MRI performed one day post-HIFU, the uterine fibroid volume and NPV were sketched layer by layer using MicroSea 3D Image Processing Software (). The NPVR was defined as NPV/Vfibroid×100%, and the postoperative RFV was calculated as VRFV = Vfibroid - VNPV. The layer with the most obvious residual fibroids was selected on the sagittal plane of the CE-MRI, and the maximum thickness of the residual fibroids was measured on this layer (). On the same layer, the fibroid was divided into four quadrants vertically and horizontally; each quadrant was equally divided into two parts using two dotted lines. If the basal distribution of residual fibroids in a single quadrant exceeded half of this quadrant, residual fibroids were present in this quadrant. The number of quadrants with fibroids was interpreted as follows: 0 indicated no residual fibroid, 1 quadrant indicated limited distribution, 2 quadrants indicated small distribution, 3 quadrants indicated obvious distribution, and 4 quadrants indicated extensive distribution (). The maximum thickness of the residual fibroids and their basal distribution were consistent with the criteria for identifying residual fibroids. The number of treated uterine fibroids in each patient was counted as well. In follow-up MRI images, NPV and RFV were measured and calculated using the same methods.
Figure 1. MicroSea 3D Image Processing Software was used to sketch the non-perfused volume layer by layer on contrast-enhanced magnetic resonance imaging.
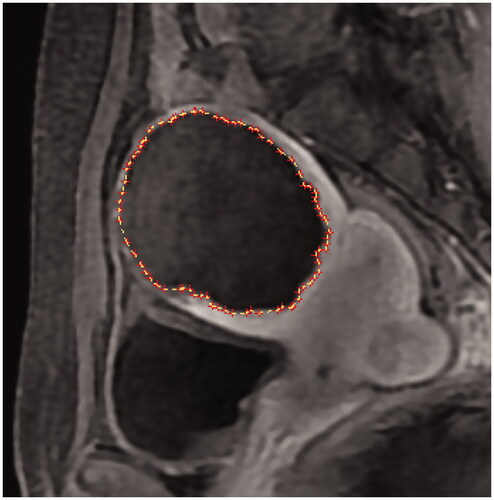
Figure 2. (A–E) Method for measuring the maximum thickness of residual fibroids. (F–J) Method for counting the basal distribution of residual fibroids. (F) No residual fibroid, 0; (G) limited distribution, 1 quadrant; (H) small distribution, 2 quadrants; (I) obvious distribution, 3 quadrants; (J) extensive distribution, 4 quadrants.
The MRI follow-up time was the interval between MRI examination one day post-HIFU and follow-up MRI. NPV reduction was calculated by subtracting the follow-up NPV from postoperative NPV, and residual fibroid regrowth was defined as an increase of >10% in RFV [Citation11]. Specific details of MRI assessment and measurement are presented in Supplementary Table 1.
ML Algorithms
In the training set of 405 cases from the Chongqing Haifu Hospital, the important features for predicting NPV reduction (continuous outcome index) and residual fibroid regrowth (classification outcome index) were selected using the R package ‘Boruta’. Furthermore, based on the scikit-learn (version 0.18.1) ML library, linear regression (LiR), random forest (RF) and multilayer perceptron (MLP) were used for predicting NPV reduction; and logistic regression (LoR), RF, and MLP were used for predicting residual fibroid regrowth.
The optimal hyperparameters were selected according to the best coefficient of determination (R2) in the grid search process by using repeated 10-fold cross-validation [Citation19]. The models were finally trained using the training set with the following key hyperparameters: LiR: fit_intercept = True; LoR: fit_intercept = False; RF: n_estimators = 141, max_features = n_features, and random_stat = 22 for predicting the NPV reduction value; n_estimators = 61, max_features = n_features and random_stat = 22 for predicting residual fibroid regrowth; MLP: the number of hidden layers was based on the sum of input and output layers*2/3; hidden_layer_sizes = 96 and random_stat = 22 for the NPV reduction value; and hidden_layer_sizes = 96 and random_stat = 22 for residual fibroid regrowth. All other hyperparameters were used with their default values.
The 168 cases from the First Affiliated Hospital of Chongqing Medical University were used as the testing set to evaluate model validity. The model score (score), mean absolute error (MAE), mean square error (MSE), median absolute error (MedAE), and explained variance (EV) were used to evaluate the models’ predictive ability for NPV reduction, and the receiver operating characteristic curve was used to evaluate the models’ predictive ability for residual fibroid regrowth. The optimal models were used to predict the prognosis at 30, 60, 90, 180, 270, and 360 days after treatment. The prognosis prediction curve was plotted using Graph pad Prism (version 7.0). All data were analyzed using R (version 4.0.2, R Foundation for Statistical Computing, Vienna, Austria, https://www.R-project.org/) and Python (version 3.8.10). Python’s scikit-learn ML library was the core library for model development; other common libraries such as ‘pandas’ and ‘NumPy’ were used as well.
Statistical analyses
Continuous data were reported as the mean ± standard deviation or the median and interquartile range depending on the normality of the data. Spearman correlation analysis was used to analyze correlations between continuous variables, and the Chi-square test or Mann–Whitney U-test to compare pairs. Classification variables were described by frequency and rate. A two-tailed p < 0.05 indicated statistical significance.
Results
Patient characteristics
The baseline characteristics of all patients are described in .
Table 2. Baseline characteristics of all uterine fibroids.
Important features for constructing ML models
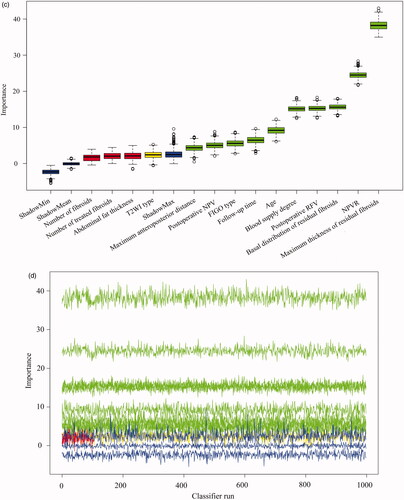
A total of 14 parameters were included in the Boruta algorithm analysis, all showing varying degrees of predictive importance for NPV reduction (); 10 items had predictive importance for residual fibroid regrowth (). Supplementary Tables 2 and 3 indicate the univariate explanations for the feature screening of Boruta.
Figure 3. The Boruta algorithm was used for feature screening and ranking. (A), (C) Box plots of all features attribute plus minimum, average, and maximum shadow scores; green variables were of predictive importance, yellow variables were tentative and red variables were eliminated. (B), (D) The decision process of the Boruta algorithm to accept and reject features. FIGO: International Federation of Gynecology and Obstetrics; T2WI: T2-weighted imaging; NPV: non-perfused volume; RFV: residual fibroid volume.
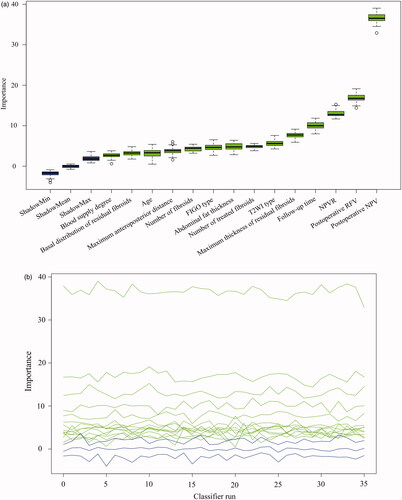
Figure 3. Continued
The most important feature influencing NPV reduction was postoperative NPV. The increase in necrosis volume caused by HIFU increased necrotic tissue absorption during follow-up (correlation coefficient 0.958, p < 0.001). The second most important feature for predicting NPV reduction was postoperative RFV. A high number of fibroids not ablated by HIFU increased necrotic tissue absorption during follow-up (correlation coefficient 0.551, p < 0.001). The higher the NPVR, the better the ablation effect and the more obvious the reduction in NPV at follow-up (correlation coefficient 0.272, p < 0.001), and the longer the follow-up observation time, the more obvious the reduction in NPV (correlation coefficient 0.262, p < 0.001). We discovered that an increase in the number of fibroids or treated fibroids in patients with multiple fibroids decreased the NPV reduction of single fibroids (number of fibroids: correlation coefficient −0.298, p < 0.001; the number of treated fibroids: correlation coefficient −0.336, p < 0.001). The lower the FIGO type number, the greater the NPV reduction value (correlation coefficient −0.199, p < 0.001).
The maximum residual fibroid thickness and basal distribution of residual fibroids, which ranked first and third in the prediction of residual fibroid regrowth, revealed that the more obvious morphological features of residual fibroids in CE-MRI appeared as regrowth (maximum residual fibroids thickness: 1.1 vs. 0.5 cm, p < 0.001; basal distribution of residual fibroids: 3 vs. 1, p < 0.001). Patients with a relatively low NPVR were more likely to exhibit residual fibroid regrowth (61.2% vs. 81.2%, p < 0.001). The importance of postoperative RFV in the prediction of residual fibroid regrowth ranked fourth; postoperative RFV in the regrowth group was significantly larger than that in the non-regrowth group (31.3 vs. 11.2 cm3, p < 0.001). Blood supply degree ranked fifth; the proportion of rich blood supply in the regrowth group was significantly higher than that in the non-regrowth group, while the proportion of lack blood supply in the non-regrowth group was significantly higher than that in the regrowth group. Younger women were more likely to develop residual fibroid regrowth (39 vs. 42 years old, p < 0.001). The longer the follow-up duration, the higher the residual fibroid regrowth (245.0 vs. 213.5 days, p = 0.008).
Prediction of NPV reduction and residual fibroid regrowth
summarizes the models’ performance to predict the NPV reduction with the training set quantitatively. The scores of LiR, RF, and MLP were 0.836, 0.982, and 0.926, respectively. Based on the 10-fold cross-validation, the average MLP performance was best with an R2, MAE, MSE, MedAE, and EV of 0.907, 7.506, 191.089, 4.015, and 0.910, respectively, whereas the R2 of LiR and RF were 0.809 and 0.879, respectively. In the testing set, LiR showed the best comprehensive performance () with an R2, MAE, MSE, MedAE, and EV of 0.851, 13.375, 526.454, 7.711, and 0.858, respectively. The R2 of RF and MLP were 0.828 and 0.792, respectively ().
Figure 4. Comparison of the real and predicted values of NPV reduction in the testing set. (A) LiR. (B) RF. (C) MLP. LiR: linear regression; RF: random forest; MLP: multilayer perceptron; NPV: non-perfused volume.
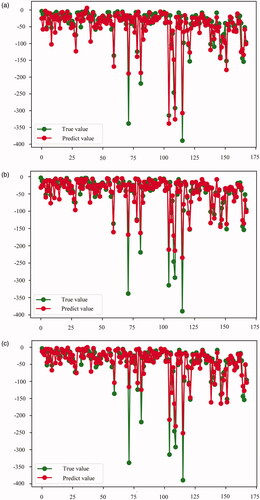
Table 3. Performance of the three machine learning models for predicting NPV reduction.
and compare the models’ ability to predict residual fibroid regrowth. In the training set, the area under the curve (AUC) of LoR, RF, and MLP were 0.904 (95% confidence interval (CI), 0.877–0.923), 1.000 (95% CI, 1.000–1.000), and 0.847 (95% CI, 0.814–0.877), respectively. Based on the 10-fold cross-validation, RF achieved the best performance with an average AUC of 0.904 (95% CI, 0.869–0.939). LoR and MLP showed an average AUC of 0.883 (95% CI, 0.836–0.930) and 0.870 (95% CI, 0.819–0.922), respectively. RF maintained the best performance in the testing set, with an AUC, sensitivity, specificity, and accuracy of 0.891 (95% CI, 0.850–0.929), 0.833, 0.813, and 0.821, respectively.
Figure 5. Area under the receiver operating characteristic curves of LoR, RF, and MLP to predict residual fibroid regrowth. (A) Training set results. (B) Testing set results. LoR: logistic regression; RF: random forest; MLP: multilayer perceptron.
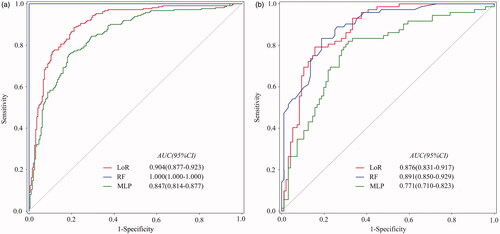
Table 4. Performance of three machine learning models for predicting residual fibroid regrowth.
Follow-up survey
Three hundred and eighty-nine patients completed the follow-up survey while 21 patients were lost to follow-up. Following HIFU ablation, 363 (363/389, 93.32%) patients reported a symptomatic relief after three months. During a median of 45 (interquartile range: 24–72) months of survey duration, 53 (53/389, 13.62%) patients reported a symptomatic recurrence. Residual fibroid regrowth in treated uterine fibroids was observed in 174 (174/389, 44.73%) patients, and 49 (49/174, 28.16%) patients with residual fibroid regrowth reported a symptomatic recurrence. Seventy-four (74/389, 19.02%) patients received re-intervention, including 24 (24/74, 32.43%) HIFU ablations, 41 (41/74, 55.41%) myomectomies, 4 (4/74, 5.41%) hysterectomies, 3 (3/74, 4.05%) drug therapies, and 2 (2/74, 2.70%) others. The interval for re-intervention after HIFU ablation was 18 (interquartile range: 12–36) months. Among the patients with re-intervention, 77.03% (57/74) had residual fibroid regrowth and 52.70% (39/74) had a symptomatic recurrence.
Practical clinical application
We plotted the prognosis prediction curve of uterine fibroids using the optimal models after HIFU ablation. The prognostic prediction curve shows the continuous absorption of necrotic fibroid tissues over time and the status of residual fibroid at each time point. shows the prognosis of two cases on MRI, and shows their prognostic prediction curves.
Figure 6. (A–D) A 29-year-old woman with a single uterine fibroid in the testing set. T2WI type: IV; FIGO type: 3; CE-MRI showed rich blood supply. The patient returned for MRI review 100 days after postoperative MRI evaluation. Maximum thickness of residual fibroids: 0.85 cm. Basal distribution of residual fibroids: two quadrants. Postoperative NPV: 37.3 cm3; postoperative RFV: 27.0 cm3; NPVR: 58.01%. NPV reduction value: 26.7 cm3. RFV increased by 19.63%. Predictive result of the NPV reduction value: 25.7 cm3; predictive result of residual fibroids: regrowth. (E–H) A 32-year-old woman with a single uterine fibroid in the testing set. T2WI type: III; FIGO type: 4; CE-MRI showed a lack of blood supply. The patient returned for MRI review 105 days after postoperative MRI evaluation. Maximum thickness of residual fibroids: 0.65 cm. The basal distribution of residual fibroids: two quadrants. Postoperative NPV: 332.7 cm3; postoperative RFV: 26.1 cm3; NPVR: 92.73%. NPV reduction value: 135.9 cm3. RFV decreased by 18.77%. Predictive result of NPV reduction was 103.8 cm3; predictive result of residual fibroid: non-regrowth. CE-MRI: contrast-enhanced magnetic resonance imaging; FIGO: International Federation of Gynecology and Obstetrics; T2WI: T2-weighted imaging; NPV: non-perfused volume; RFV: residual fibroid volume.
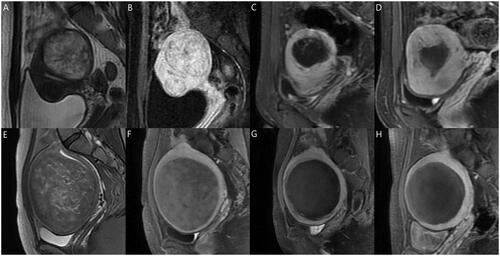
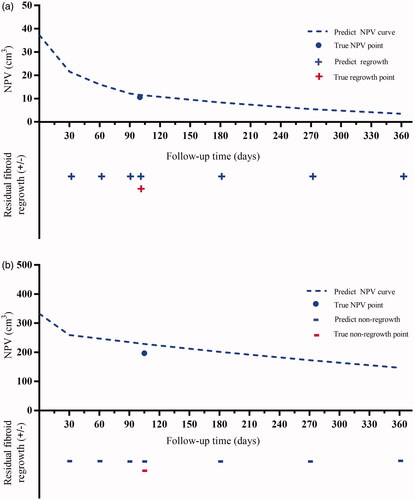
Figure 7. Prognostic prediction curves of the two cases in . The dotted lines predict NPV values over time. The ‘•’ shows the true NPV values. The ‘+’ and ‘-’ mean regrowth and non-regrowth, respectively. (A) Residual fibroid regrowth was observed at 30, 60, 90,100, 180, 270, and 360 days after treatment, indicating continuous growth of residual fibroids; (B) The residual fibroids remained non-regrowth at 30, 60, 90, 105, 180, 270, and 360 days after treatment, showing no trend for fibroid recurrence; therefore, frequent MRI examination and excessive worry are unnecessary. NPV: nonperfused volume; MRI: magnetic resonance imaging.
Discussion
This study screened for useful MRI parameters of uterine fibroids to predict NPV reduction and residual fibroid regrowth after HIFU ablation using multiple ML models. The post-HIFU changes of each uterine fibroid were plotted as prognostic prediction curves, which would provide physicians with a better understanding of the prognosis of treated fibroids by HIFU ablation, and more conducive for postoperative management. The absorption of necrotic fibroid tissues can be quantitatively observed at various time points after HIFU ablation. Moreover, physicians can reasonably arrange the reexamination of MRI scans according to the time points on the curve, which indicate residual fibroid regrowth. Subsequently, patients should be advised to continue follow-up or choose appropriate re-intervention methods such as drug, physical, and mental health treatments [Citation20], or additional HIFU treatment according to the actual examination results, to maintain the improvement of uterine fibroid-related symptoms.
For a long time, hysterectomy was the only curative solution for uterine fibroids [Citation21]. All uterine fibroid treatments with uterus preservation, including HIFU, have varying degrees of risk of recurrence and re-intervention [Citation22]. Recently, Li et al. reported the long-term follow-up (mean time: 70.0 ± 9.0 months) results of 381 women with uterine fibroids treated by HIFU: the overall re-intervention rate was 20.7%, of which a symptomatic recurrence accounted for 13.1% [Citation8]. In another study, Liu et al. followed up 536 patients with uterine fibroids treated by HIFU over a median follow-up time of 69 (interquartile range: 48–89) months and detected 110 residual fibroid regrowth cases, of which re-intervention was performed in 77 (70%) cases [Citation11]. Based on these results, residual fibroid regrowth is the most important risk factor for re-intervention. In our study, the re-intervention rate was 19.02%. In addition, 12 patients reported continuing growth of treated fibroids and were considering re-intervention. If these cases were included, the proportion of residual fibroid regrowth in re-intervention cases would increase from 77.03% to 93.24%.
We discovered that postoperative RFV positively correlated with NPV reduction and might be because the changes in NPV and RFV after HIFU ablation are dependent and influence each other. Additionally, residual fibroids are difficult to ablate as they are usually rich in blood supply or smooth muscle cells [Citation23,Citation24]. Moreover, a rich blood supply is crucial for immune activation, inflammatory infiltration, and essential for edema regression and phagocytosis of necrotic tissues by neutrophils and macrophages [Citation25]. In contrast, rich blood supply and smooth muscle cells are the histopathological basis for residual fibroid regrowth [Citation26,Citation27], and internal coagulative necrotic tissue compression caused by peripheral residual fibroid regrowth makes the NPV reduction more obvious. Additionally, we noted that the postoperative RFV in the regrowth group was significantly higher than in the non-regrowth group and that patients with a relatively low NPVR were more likely to exhibit residual fibroid regrowth. NPVR is the most effective parameter for evaluating the ablation effect of HIFU in the treatment of uterine fibroids. Additionally, it is positively related to improving fibroid-related symptoms at follow-up [Citation28–30]. Our study observed the regrowth of some uterine fibroids with high NPVR. The regrowth usually occurred on the dorsal side of the fibroids (insufficient focal length or unclear imaging), where the blood supply was rich (blood flow dissipates some heat) [Citation23,Citation31], or where the fibroids’ serosa layer was close to the intestinal canal (safety concerns) [Citation32]. NPV, RFV, and NPVR only describe the macroscopic effect of ablation, for NPVR >90%; therefore, the details of the remaining 10% are unknown. We should also consider the morphological characteristics of non-ablated fibroids. Even a few irregular residual fibroids may affect the prognosis. Therefore, we measured the maximum thickness and basal distribution of residual fibroids and determined the three-dimensional volume. We discovered that an increase in the number of fibroids or treated fibroids in patients with multiple fibroids decreased the NPV reduction of single fibroids, which may be related to the effect of the uterine environment on the absorption of necrotic tissues when several ablated fibroids coexisted or when ablated and non-ablated fibroids coexisted. The lower the FIGO type number, the greater the NPV reduction value; a low FIGO type number indicates the close location of uterine fibroids to the uterine cavity and natural exclusion from the body after HIFU ablation [Citation33].
The models we chose are representative classical models, including mathematical, statistical, ensemble learning, and artificial neural network. Traditional risk factors or prediction studies typically performed univariate regression followed by multivariate logistic/linear regression. Previous studies have shown that ML methods were more accurate and efficient than traditional logistic regression analysis, especially with limited sample size [Citation34]. The Boruta algorithm can screen out all strongly or weakly correlated features with outcome variables [Citation35]. Compared to the traditional feature selection methods, the Boruta algorithm help to comprehensively understand the factors influencing uterine fibroids' prognosis after HIFU ablation to carry out feature selection better and more efficiently. As an artificial neural network model, MLP showed better stability and robustness in predicting NPV reduction in our study. RF, a classical ML algorithm [Citation36], improved prediction accuracy without significantly increasing the computation amount. In contrast to logistic regression, RF is unaffected by multicollinearity and has strong robustness to missing data [Citation37]. However, we could not achieve a quantitative prediction of residual fibroid change. Initially, we attempted to predict the change in residual fibroids quantitatively, but all our study’s ML models failed to obtain acceptable results. This may be because residual fibroids are bioactive tumor tissues and considerably more complicated than fibroid tissues ablated for inactivation. Next, we hope to improve the ML prediction models and develop an online tool to monitor postoperative fibroids for physicians and patients.
This study had limitations. First, we constructed ML models with a modest sample size from two centers. Therefore, larger sample sizes and multicenter data improve prediction accuracy. Second, we examined single-fibroid prognosis and multiple fibroids cases, we did not further analyze the correlation between fibroid-related clinical symptoms and residual fibroid regrowth. Third, the validity of using maximum thickness and basal distribution to describe the morphological characteristics of residual fibroids in this study requires further clinical verification. Finally, the addition of some laboratory biochemical indicators reflecting the endocrine level and high-dimensional characterization data based on radiomics [Citation38] may be an effective method to further improve the accuracy of our prognostic predictors after HIFU ablation of uterine fibroids.
Conclusions
ML models based on MRI parameters can accurately predict NPV reduction and residual fibroid regrowth of uterine fibroids after HIFU ablation and plot prognostic prediction curves. This can serve as a prediction tool for patients and a new reference method of postoperative management for physicians.
Supplemental Material
Download PDF (178.4 KB)Disclosure statement
The authors report no conflict of interest.
Additional information
Funding
Related Research Data
References
- Stewart EA. Uterine fibroids. The Lancet. 2001;357(9252):293–298.
- Boosz AS, Reimer P, Matzko M, et al. The conservative and interventional treatment of fibroids. Dtsch Arztebl Int. 2014;111(51-52):877–883.
- Flake GP, Andersen J, Dixon D. Etiology and pathogenesis of uterine leiomyomas: a review. Environ Health Perspect. 2003;111(8):1037–1054.
- Cun JP, Fan HJ, Zhao W, et al. Factors influencing MR changes associated with sacral injury after high-intensity focused ultrasound ablation of uterine fibroids. Int J Hyperthermia. 2019;36(1):21–28.
- Rueff LE, Raman SS. Clinical and technical aspects of MR-Guided high intensity focused ultrasound for treatment of symptomatic uterine fibroids. Semin Intervent Radiol. 2013;30(4):347–353.
- Zhang L, Chen WZ, Liu YJ, et al. Feasibility of magnetic resonance imaging-guided high intensity focused ultrasound therapy for ablating uterine fibroids in patients with bowel lies anterior to uterus. Eur J Radiol. 2010;73(2):396–403.
- Tempany CM, Stewart EA, Mcdannold N, et al. MR imaging-guided focused ultrasound surgery of uterine leiomyomas: a feasibility study. Radiology. 2003;226(3):897–905.
- Li W, Jiang Z, Deng X, et al. Long-term follow-up outcome and reintervention analysis of ultrasound-guided high intensity focused ultrasound treatment for uterine fibroids. International journal of hyperthermia: the official journal of European society for hyperthermic oncology. Int J Hyperthermia. 2020;37(1):1046–1051.
- Stewart EA, Gedroyc WMW, Tempany CMC, et al. Focused ultrasound treatment of uterine fibroid tumors: safety and feasibility of a noninvasive thermoablative technique. Am J Obstet Gynecol. 2003;189(1):48–54.
- Gorny KR, Borah BJ, Brown DL, et al. Incidence of additional treatments in women treated with MR-Guided focused US for symptomatic uterine fibroids: review of 138 patients with an average follow-up of 2.8 years. J Vasc Interv Radiol. 2014;25(10):1506–1512.
- Liu Y, Wu X, Wu A, et al. Ultrasound-guided high intensity focused ultrasound ablation for uterine fibroids: long-term outcomes and factors affecting local recurrence. International journal of hyperthermia: the official journal of european society for hyperthermic oncology. Int J Hyperthermia. 2021;38(1):1341–1348.
- Zhao WP, Zhang J, Han ZY, et al. A clinical investigation treating different types of fibroids identified by MRI-T2WI imaging with ultrasound guided high intensity focused ultrasound. Sci Rep. 2017;7(1):10812.
- Verpalen IM, Anneveldt KJ, Nijholt IM, et al. Magnetic resonance-high intensity focused ultrasound (MR-HIFU) therapy of symptomatic uterine fibroids with unrestrictive treatment protocols: a systematic review and meta-analysis. Eur J Radiol. 2019;120:108700.
- Karhade AV, Thio Q, Ogink PT, et al. Development of machine learning algorithms for prediction of 30-Day mortality after surgery for spinal metastasis. Neurosurg. 2019;85(1):E83–E91.
- Gong C, Lin Z, Lv F, et al. Magnetic resonance imaging parameters in predicting the ablative efficiency of high-intensity focused ultrasound for uterine fibroids. Int J Hyperthermia. 2021;38(1):523–531.
- Chen J, Li Y, Wang Z, Committee of the Clinical Trial of HIFU versus Surgical Treatment for Fibroids, et al. Evaluation of high-intensity focused ultrasound ablation for uterine fibroids: an IDEAL prospective exploration study. BJOG: Int J Obstet Gy. 2018;125(3):354–364.
- Munro MG, Critchley HOD, Broder MS, FIGO Working Group on Menstrual Disorders, et al. FIGO classification system (PALM-COEIN) for causes of abnormal uterine bleeding in nongravid women of reproductive age. Int J Gynaecol Obstet. 2011;113(1):3–13.
- Keserci B, Duc NM. The role of T1 perfusion-based classification in magnetic resonance-guided high-intensity focused ultrasound ablation of uterine fibroids. Eur Radiol. 2017;27(12):5299–5308.
- Chang Y, Lafata K, Sun W, et al. An investigation of machine learning methods in Delta-radiomics feature analysis. PLoS One. 2019;14(12):e0226348.
- Huang X, Yu D, Zou M, et al. The effect of exercise on high-intensity focused ultrasound treatment efficacy in uterine fibroids and adenomyosis: a retrospective study. BJOG: Int J Obstet Gy. 2017;124:46–52.
- Sohn GS, Cho S, Kim YM, Working Group of Society of Uterine Leiomyoma, et al. Current medical treatment of uterine fibroids. Obstet Gynecol Sci. 2018;61(2):192–201.
- Manyonda IT, Bratby M, Horst JS, et al. Uterine artery embolization versus myomectomy: Impact on quality of life—results of the FUME (fibroids of the uterus: myomectomy versus embolization) trial. Cardiovasc Intervent Radiol. 2012;35(3):530–536.
- Kennedy JE. High-Intensity focused ultrasound in the treatment of solid tumours. Nat Rev Cancer. 2005;5(4):321–327.
- Kim YS. Clinical application of high-intensity focused ultrasound ablation for uterine fibroids. Biomed Eng Lett. 2017;7(2):99–105.
- Chu KF, Dupuy DE. Thermal ablation of tumours: biological mechanisms and advances in therapy. Nat Rev Cancer. 2014;14(3):199–208.
- Nieuwenhuis L, Keizer A, Stoelinga B, et al. Fibroid vascularisation assessed with three-dimensional power doppler ultrasound is a predictor for uterine fibroid growth: a prospective cohort study. BJOG. 2018;125(5):577–584.
- Huang H, Ran J, Xiao Z, et al. Reasons for different therapeutic effects of high-intensity focused ultrasound ablation on excised uterine fibroids with different signal intensities on T2-weighted MRI: a study of histopathological characteristics. Int J Hyperther. 2019;36(1):476–483.
- Zhao WP, Chen JY, Chen WZ. Effect of biological characteristics of different types of uterine fibroids, as assessed with T2-Weighted magnetic resonance imaging, on Ultrasound-Guided High-Intensity focused ultrasound ablation. Ultrasound Med Biol. 2015;41(2):423–431.
- LeBlang SD, Hoctor K, Steinberg FL. Leiomyoma shrinkage after MRI-Guided focused ultrasound treatment: Report of 80 patients. Am J Roentgenol. 2010;194(1):274–280.
- Lénárd ZM, McDannold NJ, Fennessy FM, et al. Uterine leiomyomas: MR imaging–guided focused ultrasound surgery—imaging predictors of success. Radiology. 2008;249(1):187–194.
- Goldberg SN, Grassi CJ, Cardella JF, Society of Interventional Radiology Technology Assessment Committee, et al. Image-guided tumor ablation: standardization of terminology and reporting criteria. J Vasc Interv Radiol. 2005;16(6):765–778.
- Morita Y, Takeuchi S, Hikida H, et al. Decreasing margins to the uterine serosa as a method for increasing the volume of fibroids ablated with magnetic resonance-guided focused ultrasound surgery. Eur J Obstet Gynecol Reprod Biol. 2009;146(1):92–95.
- Wang W, Wang Y, Wang T, et al. Safety and efficacy of US-guided high-intensity focused ultrasound for treatment of submucosal fibroids. Eur Radiol. 2012;22(11):2553–2558.
- Fernandez-Delgado M, Cernadas E, Barro S, et al. Do we need hundreds of classifiers to solve real world classification problems? J Machine Learn Res. 2014;15:3133–3181.
- Lin J, Jiang A, Ling M, et al. Prediction of neurologic deterioration based on support vector machine algorithms and serum osmolarity equations. Brain Behav. 2018;8(7):e01023.
- Genuer R, Poggi J-M, Tuleau-Malot C. Variable selection using random forests. Pattern Recognition Letters. 2010;31(14):2225–2236.
- Wu J, Qiu J, Xie E, et al. Predicting in-hospital rupture of type a aortic dissection using random Forest. J Thorac Dis. 2019;11(11):4634–4646.
- Lambin P, Leijenaar RTH, Deist TM, et al. Radiomics: the bridge between medical imaging and personalized medicine. Nat Rev Clin Oncol. 2017;14(12):749–762.