
 ?Mathematical formulae have been encoded as MathML and are displayed in this HTML version using MathJax in order to improve their display. Uncheck the box to turn MathJax off. This feature requires Javascript. Click on a formula to zoom.
Abstract
Background
Capacitive devices are used for hyperthermia delivery, initially mainly in Asia, but nowadays also increasingly in Europe. Treatment planning can be very useful to determine the most effective patient-specific treatment set-up. This paper provides a validation of GPU-based simulations using Plan2Heat for capacitive hyperthermia devices.
Methods
Validation was first performed by comparing simulations with an analytical solution for a spherical object placed inside a uniform electric field. Resolution was 5, 2.5 or 1 mm. Next, simulations for homogeneous and inhomogeneous phantom setups were performed for Thermotron RF8 and Celsius TCS capacitive heating devices at 2.5 mm resolution. Also different combinations of electrode sizes were evaluated. Normalized SAR profiles were compared to phantom measurements from the literature. Possible clinical use of treatment planning was demonstrated for an anal cancer patient, evaluating different treatment set-ups in prone and supine position.
Results
Numerical and analytical solutions showed excellent agreement. At the center of the sphere, the error was 5.1%, 2.9% and 0.2% for a resolution of 5, 2.5 and 1 mm, respectively. Comparison of measurements and simulations for both Thermotron RF8 and Celsius TCS showed very good agreement within 5% for all phantom set-ups. Simulations were capable of accurately predicting the penetration depth; a very relevant parameter for clinical application. The patient case illustrated that planning can provide insight by comparing effectiveness of different treatment strategies.
Conclusion
Plan2Heat can rapidly and accurately predict heating patterns generated by capacitive devices. Thus, Plan2Heat is suitable for patient-specific treatment planning for capacitive hyperthermia.
1. Introduction
Clinical hyperthermia to realize radiosensitization or chemosensitization can be applied using various different heating devices [Citation1]. Most commonly applied external heating methods can be subdivided into two categories, that is, radiative and capacitive heating. Capacitive heating was initially mainly used in Asian countries, using the 8 MHz Thermotron RF8 system (Yamamoto Vinita Co, Osaka, Japan). Capacitive heating devices are increasingly applied in the Western world, mainly because these devices are affordable and easy to use. Although radiative heating generally allows to achieve higher temperatures and a better controlled heating quality [Citation2–4], positive results can be achieved with capacitive heating for selected patient categories. Several positive clinical studies have been performed using the Thermotron RF8 device, for example for head and neck and cervical cancer [Citation5,Citation6]. Nowadays, a large number of capacitive heating devices is commercially available. Examples include Celsius TCS (Celsius42+ GmbH, Cologne, Germany), HY-DEEP 600WM (Andromedic srl, Velletri, Italy), Oncotherm (Oncotherm Kft, Budapest, Hungary) and Synchrotherm (Synchrotherm, Vigevano, Italy), all operating at 13.56 MHz.
These capacitive devices typically consist of two electrodes. During treatment, the patient is lying on a treatment table. An electrode with integrated water bolus is embedded in the table. Another electrode (also with integrated water bolus) is positioned on the opposite side on the patient and the resulting currents produced by capacitive coupling with the human body cause heating. Since the large power absorption in subcutaneous fat layers can be treatment limiting, some institutes use additional overlay boluses for extra skin cooling [Citation7]. Usually multiple electrode sizes are available. When two equally sized electrodes are used, the absorbed power is directed toward the center of the distance between the electrodes [Citation8]. When different sizes of electrodes are combined, the power distribution is directed to the side of the smallest electrode [Citation8]. Thus, for eccentric and more superficially located tumors the diameters are usually different, with the smallest electrode closest to the tumor location.
Temperatures and thermal dose are known to be predictive for clinical outcome of hyperthermia treatments [Citation9–14]. Monitoring tumor temperatures during treatment is thus important to ensure treatment quality. Furthermore, since the achieved temperature distribution depends on the treatment set-up, i.e., the positioning of the electrodes and the electrode sizes selected, optimization of the treatment set-up is an important basis of a treatment. Treatment planning can predict specific absorption rate (SAR [W kg−1]) and temperature distributions for a specific treatment set-up and compare different treatment strategies [Citation15]. Pretreatment planning can thus be very useful for capacitive heating in the treatment preparation phase, to optimize the treatment strategy. Hyperthermia treatment planning is increasingly used for radiative hyperthermia [Citation16], but clinical application of treatment planning for capacitive heating is lagging behind.
Some studies applied treatment planning simulations to improve the heating quality that can be achieved with capacitive devices in a clinical setting. Ohguri et al. optimized the salt concentration in the overlay bolus to improve heating of obese patients using Thermotron RF8, with the help of treatment planning [Citation17]. Another study applied treatment planning to evaluate the use of insulator sheets inserted between the electrode water bolus and the overlay bolus, aiming to reduce the subcutaneous fat/target SAR ratio, and thereby improving central target heating [Citation18]. An important prerequisite for the clinical use of treatment planning is validation of the simulation results, by comparing these with measurements in tissue-equivalent phantoms.
This study aims to validate treatment planning for capacitive heating devices, using Plan2Heat; our in-house developed finite difference-based hyperthermia treatment planning system. First, simulations are performed for a spherical object placed inside a uniform electric field, which mimics capacitive heating without using water boluses. Simulation results are compared with an analytical solution. Next, two different and frequently used capacitive systems are evaluated: Thermotron RF8 and Celsius TCS. Simulation results for various homogeneous and inhomogeneous phantom set-ups are compared to measurements reported in the literature. Finally, a patient example illustrates how treatment planning can be applied clinically to optimize treatment quality when using capacitive heating devices.
2. Methods
All simulations were performed using our in-house developed hyperthermia treatment planning software Plan2Heat, which uses voxel-based finite difference calculations [Citation19]. The resolution applied for all cases was 2.5 × 2.5 × 2.5 mm3. Geometrical objects were generated and combined to simulate capacitive devices and various phantom set-ups. For example, electrode boluses were considered cylindrical objects, with the same diameter as the electrode, and slightly protruding at the edges.
Because of the low frequency applied for capacitive heating, power distributions were calculated by solving the quasi-static formulation of Maxwell’s equations, enabling much faster simulations compared to solving the full Maxwell’s equations using the Finite Difference Time Domain method. The metal electrodes at the top and bottom were kept at a constant potential of 1 V and −1 V, respectively. The boundaries of the simulation domain were fixed at zero potential. The electric field vector can be written as This quasi-static formulation yields an elliptic partial differential equation to be solved for the potential V [Citation20]. Plan2Heat uses CUDA GPU accelerated calculations. The power density (PD) is then calculated using:
(1)
(1)
with σ (S m−1) the electrical conductivity. For SAR evaluation 1 cc averaged values were considered. Dielectric and thermal tissue properties used in the phantom and patient simulations were based on literature and are listed in .
Table 1. Values of the dielectric properties at 13.56 MHz (unless otherwise specified) and the densities and thermal properties used in the simulations [Citation21,Citation22]; conductivity (σ [S m−1] and relative permittivity (εr [-]), density (ρ [kg m−3]), specific heat capacity (c [J kg−1°C−1]), thermal conductivity (k [W m−1°C−1]) and perfusion (Wb [kg m−3 s−1]).
2.1. Validation using an analytical model
When a spherical object with radius R is placed in another medium to which a uniform electric field is applied, an analytical solution of the potential distribution can be derived. The analytical solution of the potential V(x,y,z) inside the sphere is given by:
(2)
(2)
with Ez the uniform electric field oriented in the z-direction and κi and κo the complex admittance (κ = σ+jωε0εr) of the medium inside and outside the sphere, respectively. Inside the sphere,
then becomes
(3)
(3)
Outside the sphere we have:
(4)
(4)
with
the distance to the origin, which is located at the center of the sphere. Outside the sphere,
works out to:
(5)
(5)
The analytical PD is then calculated according to EquationEquation (1)(1)
(1) .
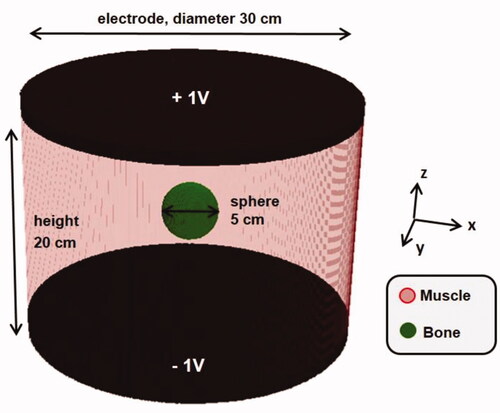
Without loss of generality, a bony sphere (σ = 0.046 S m−1, εr = 31) with radius R = 2.5 cm was considered inside a homogeneous muscle cylinder (diameter 30 cm and height 20 cm; σ = 0.63 S m−1, εr = 138.4). A frequency of 13.56 MHz was assumed. In the simulation model cylindrical capacitor plates at the top and the bottom of the muscle cylinder were set at a constant potential of 1 V and −1 V, respectively, defining Ez. Simulations were performed at a resolution of 5, 2.5 and 1 mm. The geometry is depicted in . Note that this situation represents capacitive heating without boluses.
Figure 1. A bony sphere (diameter 5 cm) is placed inside a homogeneous muscle cylinder (diameter 30 cm and height 20 cm). A constant electric field oriented in the z-direction is applied.
2.2. Validation using phantom measurements
Next, treatment planning predictions for capacitive heating systems were validated using measurements for various homogeneous and inhomogeneous phantom set-ups reported in the literature for both the Thermotron RF8 system [Citation24] and the Celsius TCS system [Citation25].
2.2.1. Thermotron RF8
The Thermotron RF8 system operates at 8 MHz and the device initially included 4 different electrode sizes, with a diameter of 10, 14, 21 and 25 cm. Nowadays, also electrodes with a diameter of 4 and 30 cm are available. Song et al have performed measurements using a homogenous cylindrical agar phantom with a diameter of 25 cm and a height of 24 cm, containing 0.2% NaCl [Citation24]. The water boluses were filled with a 0.4% NaCl solution. A pair of electrodes of various sizes was positioned concentrically to both bases of the phantom. The effect of the electrode size on the heating patterns was evaluated first for two equally sized electrodes, considering 25 cm and 10 cm diameter electrodes. Next, different combinations were evaluated; the bottom electrode was fixed to 25 cm, and the top electrode varied between 25 and 10 cm. The different phantom set-ups are shown in . Temperature rise measurements were performed to evaluate thermal distributions inside the phantom. Song et al showed a linear time-temperature relation along the central axis, indicating that the temperature rise is proportional to the SAR [Citation24].
Figure 2. Different phantom set-ups evaluated for the Thermotron RF8 capacitive hyperthermia device. Measurements for these set-ups have been reported by Song et al. [Citation24], which were used here to validate treatment planning predictions by Plan2Heat.
![Figure 2. Different phantom set-ups evaluated for the Thermotron RF8 capacitive hyperthermia device. Measurements for these set-ups have been reported by Song et al. [Citation24], which were used here to validate treatment planning predictions by Plan2Heat.](/cms/asset/33e62576-bbc2-4fcb-8139-47e5c60f2731/ihyt_a_2093996_f0002_c.jpg)
To validate Plan2Heat for Thermotron RF8, simulations were performed for all these phantom set-ups, with dielectric properties as specified in . Normalized SAR profiles along the phantom’s central axis were determined by normalizing the SAR value at 1 cm depth to 100%. Normalized SAR profiles were reconstructed from the SAR/temperature rise measurements, by scaling the profile such that the normalized SAR value at the first measurement location (i.e., at 3 cm depth) corresponded with the simulation. Simulated and measured axial profiles were compared. Radial profiles were not evaluated, since thermal conduction affects temperature rise measurements in radial direction; consequently, the local temperature rise will not be proportional to SAR.
2.2.2. Celsius TCS
The Celsius TCS system operates at 13.56 MHz and comes with two different sizes of electrodes: 15 and 25 cm diameter. In contrast to the Thermotron RF8, the electrode boluses of the Celsius TCS system are not filled with saline, but with distilled water. Beck et al have performed several measurements using homogeneous and inhomogeneous phantoms [Citation25]. To determine the basic heating characteristics and the penetration depth, a rectangular homogeneous agarose 2/3 muscle phantom l × w×h = 30 × 30 × 16 cm was used. Both a symmetrical electrode set-up with two 15 cm electrodes, and an asymmetrical set-up with a 25 cm top electrode and a 15 cm bottom electrode were evaluated. Furthermore, more clinically relevant inhomogeneous situations were evaluated to determine the influence of fatty and bony structures on the generated SAR distribution. Measurements with a symmetrical 15 cm electrode configuration were performed for a 30 × 30 × 14 cm phantom with a 20 × 20 layer of porcine skin fat of 1.3 cm thickness embedded on top. Finally, of a bovine thigh bone of 10 cm length and 5.5 cm diameter was integrated in a similar homogeneous phantom. The center of the bone was at 4.5 cm depth. Also here a symmetrical 15 cm electrode configuration was used. The four different phantom set-ups are depicted in . Temperature rise measurements along the central axis of the phantom were converted into SAR values, from which normalized SAR profiles were derived for each set-up.
Figure 3. Different phantom set-ups evaluated for the Celsius TCS capacitive hyperthermia device. Measurements for these set-ups have been reported by Beck et al. [Citation25], which were used here to validate treatment planning predictions by Plan2Heat.
![Figure 3. Different phantom set-ups evaluated for the Celsius TCS capacitive hyperthermia device. Measurements for these set-ups have been reported by Beck et al. [Citation25], which were used here to validate treatment planning predictions by Plan2Heat.](/cms/asset/44035fb8-fbee-481b-96cb-487d2e5280f3/ihyt_a_2093996_f0003_c.jpg)
To validate Plan2Heat for Celsius TCS, simulations were performed for all these phantom set-ups, with dielectric properties as listed in . The 15 cm bottom electrode was modeled as 17 cm, to account for the coupling effect of the electrode to the treatment table, as indicated by Beck et al. [Citation25]. Normalized axial SAR profiles were compared to the measurements.
2.3. Clinical treatment planning example
Treatment planning simulations can be particularly helpful in clinical decision making [Citation15]. To demonstrate how treatment planning for capacitive hyperthermia could be used in clinical practice, we evaluate the heating quality for different treatment configurations for a patient with an anal carcinoma to be treated with the Celsius TCS device. Next, we evaluate the possible improvement in treatment quality when additional saline overlay boluses would be used.
2.3.1. Optimizing the treatment set-up
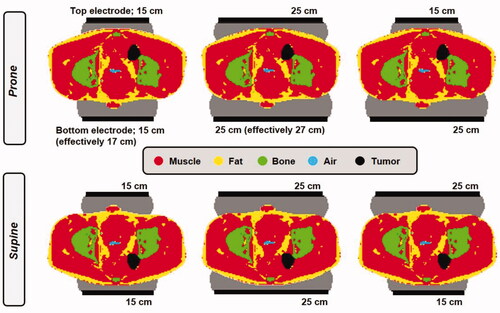
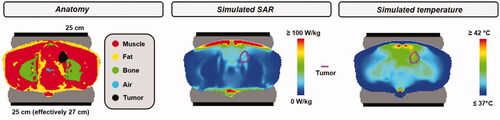
The patient model was derived from a CT data set. The tumor/target volume was delineated manually by a physician. Tissue segmentation was performed using Hounsfield unit thresholds [Citation26], distinguishing muscle, fat, bone and air. Then the anatomy was combined with the electrodes and boluses. Dielectric and thermal tissue properties were assigned based on the literature, as specified in . Since the bottom electrode is effectively slightly larger, due to the coupling effect of the electrode to the treatment table, both prone and supine position were evaluated for electrode combinations top + bottom = 25 + 25 cm and 15 + 15 cm. Additionally, for prone and supine position 15 + 25 cm and 25 + 15 cm, respectively, were also evaluated ().
Figure 4. Different electrode combinations and treatment positioning (prone or supine) evaluated for an anal carcinoma patient to determine the most favorable treatment set-up.
The 1 cc average SAR distributions were calculated for all evaluated treatment set-ups and to determine the set-up yielding the most effective heating, the hot spot target quotient (HTQ) was evaluated, which is defined as [Citation27]:
(6)
(6)
where <SARhotspot> is represented by SARx (i.e., the x% of the patient volume exposed to the highest SAR) and <SARtarget> is the average SAR in the target region. We have chosen x = 0.1%, since the volume V0.1 where SAR > SAR0.1 yields a good correlation with hot spot complaints during locoregional hyperthermia treatment [Citation28].
SAR hot spots are often located close to the skin, where the bolus cooling has a large impact on whether a hot spot will be treatment limiting or not. Bolus temperatures during treatment with the Celsius TCS system usually vary between 10 °C and 18 °C [Citation29]. In clinical practice, typically, the first treatment session starts with a relatively high bolus temperature of 18 °C, which is then gradually reduced to 10 °C during subsequent sessions [Citation29]. Treatment starts with a relatively low output power, which is gradually increased depending on patient tolerance.
To evaluate the risk of treatment limiting hot spots, predicted temperature distributions were also evaluated. Thermal simulations were based on Pennes’ bioheat equation, which describes the temperature as a function of thermal conductivity, perfusion and deposited SAR (W kg−1) [Citation30].
(7)
(7)
with c the specific heat capacity (J kg−1 °C−1), k (W m−1 °C−1) the thermal conductivity, cb the specific heat capacity of blood, Wb (kg m−3 s−1) the volumetric perfusion rate and Tart the local arterial or body core temperature (37 °C). To ensure a robust conclusion about the preferred treatment set-up, predicted temperature distributions were evaluated for bolus temperatures at both ends of the clinically applied bolus temperature range for Celsius TCS (i.e., 18 °C and 10 °C). For each simulated treatment set-up, the amount of power was scaled such that the maximum predicted tissue temperature reached the pain sensation threshold (45 °C) [Citation31]. This mimics the steady state power and temperature distribution when in a clinical setting the applied power was increased until patient tolerance is reached.
2.3.2. The effect of additional saline overlay boluses
Treatment planning can also be very supportive to explore strategies to further improve treatment quality. Several studies mentioned the use of overlay boluses in combination with the Thermotron RF8 device [Citation7,Citation32]. Extensive research explored the optimal combination of electrode and overlay bolus salinity for the Thermotron RF8 to reduce superficial treatment limiting hot spots [Citation17,Citation33]. An additional overlay bolus filled with saline will absorb power near the skin, where the power gradient is largest. Thus, in combination with skin cooling, this will reduce superficial hot spots.
We evaluated the effect of an overlay bolus for the anal carcinoma patient to be treated with the Celsius TCS system. The optimized treatment set-up was considered and the Celsius TCS system specifications remain unchanged, that is, the electrode bolus is still filled with distilled water. For the overlay bolus a thickness of 2.5 cm was assumed and various salinities were evaluated with electrical conductivities σ = 1.0, 2.0 and 3.0 S m−1. An overlay bolus temperature of 10 °C was assumed. For each case, simulated power distributions were again scaled such that the maximum predicted tissue temperature reached 45 °C. Predicted tumor temperatures were compared to the standard situation without using overlay boluses.
3. Results
3.1. Analytical model
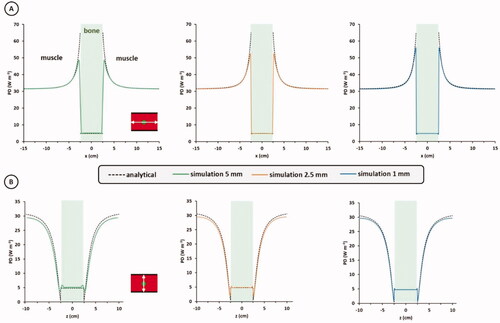
shows numerical and analytical profiles of the power density along the x-direction (A) and z-direction (B) for the spherical bone placed inside a homogeneous muscle cylinder, with a constant electric field applied in z-direction, as shown in . Numerical results for resolutions of 5, 2.5 and 1 mm are shown. It can be observed that the numerical simulations correspond very well to the analytical solution and, as expected, the simulation error decreases with increasing resolution. The rectangular discretization of the sphere causes stair-casing errors, which explains the difficulty to predict the high peak value at the bone-muscle interface (), even at high resolution. This is inherent to finite difference simulations [Citation34]. However, human tissue interfaces are less geometrically perfect and in hyperthermia treatment planning applications usually 1 cc averaged SAR distributions are evaluated, or temperature distributions, which smoothens extreme peak values. Therefore, such stair-casing errors will be less pronounced in practical clinical use. Overall, excellent agreement between the numerical and analytical solutions can be observed. At the center of the sphere, the error was 5.1%, 2.9% and 0.2% for a resolution of 5, 2.5 and 1 mm, respectively. These results indicate that 2.5 mm resolution is adequate for capacitive hyperthermia treatment planning.
Figure 5. Analytical solution for a spherical object (bone) placed inside a homogeneous electric field, as illustrated in , together with numerical solutions for this problem achieved with the quasi-static solver of Plan2Heat. Profiles of the power density (PD) along the x-direction (A), and z-direction (B) are shown. The simulation resolution was 5, 2.5 and 1 mm.
3.2. Thermotron RF8
shows simulated normalized SAR distributions, as well as measured and simulated profiles for set-ups with two equally sized electrodes of either 25 cm or 10 cm of the Thermotron RF8 system. Since the diameter of the phantom is also 25 cm, a homogeneous SAR distribution is observed for this set-up; there is no SAR gradient along the axis of the phantom. A strong decay is observed when the diameter of the electrodes is smaller than the diameter of the phantom. The SAR drops to about 25–30% at the center of the phantom. These phenomena are very well predicted by the simulations and measurements and simulations match within 5%. The simulated penetration depth for the 10 cm electrode set-up, defined as the depth where the SAR has dropped to 50% of the value at 1 cm depth, is about 4 cm. Although there were insufficient measurement points available to accurately determine the penetration depth directly from the measurements, the correspondence between measured and simulated SAR profiles indicates that this simulated 4 cm penetration depth likely represents reality.
Figure 6. Simulated normalized SAR distributions (left), and measured and simulated profiles (right) for the Thermotron RF8 system using two equally sized electrodes of either 25 cm or 10 cm diameter on a cylindrical phantom (). Measurements were taken from Song et al. [Citation24].
![Figure 6. Simulated normalized SAR distributions (left), and measured and simulated profiles (right) for the Thermotron RF8 system using two equally sized electrodes of either 25 cm or 10 cm diameter on a cylindrical phantom (Figure 2). Measurements were taken from Song et al. [Citation24].](/cms/asset/6e88f376-7b15-42a0-99d6-ce06fb0408ea/ihyt_a_2093996_f0006_c.jpg)
shows simulated normalized SAR distributions, together with measured and simulated profiles for set-ups with two electrodes with a different diameter. The bottom electrode was always 25 cm and the top electrode varied in diameter. Again, a very good match between measurement and simulation is observed. Measurements show a decrease in minimum SAR value in the lower half of the phantom when the top electrode decreases in diameter. The minimum measured value was ∼40% and ∼15–20% for a top electrode of 14 and 10 cm diameter, respectively. Simulations predicted very similar values and again deviations were within 5%. The penetration depth also decreased with decreasing diameter of the top electrode. Simulations predicted a penetration depth of about 8 and 4 cm, for a top electrode of 14 and 10 cm diameter, respectively. Again, given the very good correspondence between measured and simulated SAR profiles, these simulated penetration depths can be considered to represent reality.
Figure 7. Simulated normalized SAR distributions (left), and measured and simulated profiles (right) for the Thermotron RF8 system using two electrodes with different diameters on a cylindrical phantom (). Measurements were taken from Song et al. [Citation24].
![Figure 7. Simulated normalized SAR distributions (left), and measured and simulated profiles (right) for the Thermotron RF8 system using two electrodes with different diameters on a cylindrical phantom (Figure 2). Measurements were taken from Song et al. [Citation24].](/cms/asset/9011dd52-b98d-4b58-b48c-2ed7518f36db/ihyt_a_2093996_f0007_c.jpg)
3.3. Celsius TCS
3.3.1. Homogeneous phantom
shows simulated normalized SAR distributions, as well as measured and simulated profiles for a homogenous 2/3 fat-muscle phantom set-up with two 15 cm diameter electrodes for the Celsius TCS device. Profiles were normalized to 100% at 1 cm depth. Both measured and predicted penetration depth are about 4 cm. The measurements show a decay toward a minimum SAR value of ∼30%, which is accurately reproduced by the simulation. Since the bottom electrode is effectively slightly larger than 15 cm due to the coupling effect of the electrode to the treatment table, the resulting profile is slightly asymmetrical. The SAR value near the bottom electrode (at 15 cm depth) is about 70%. Measured and simulated profiles show an excellent agreement, with a correspondence within 5%.
Figure 8. Simulated normalized SAR distribution and measured and simulated profiles for the Celsius TCS system using two 15 cm diameter electrodes on a rectangular homogeneous 2/3 muscle phantom (). Measurements were taken from Beck et al. [Citation25].
![Figure 8. Simulated normalized SAR distribution and measured and simulated profiles for the Celsius TCS system using two 15 cm diameter electrodes on a rectangular homogeneous 2/3 muscle phantom (Figure 3). Measurements were taken from Beck et al. [Citation25].](/cms/asset/36c80ede-cbc8-4c68-8784-6e5cd2866878/ihyt_a_2093996_f0008_c.jpg)
shows results for an asymmetrical set-up with a 25 cm top electrode and a 15 cm bottom electrode. Profiles were normalized to 100% at 15 cm depth. Again, the measured and predicted penetration depth are both ∼4 cm, but toward the top electrode measured and simulated profiles start to deviate, with a maximum deviation at 1 cm depth of ∼15%. This can be explained by the fact that the contact between the top electrode bolus and the phantom was probably not optimal during the measurements. Beck et al used a thin water bolus (heat-sealed plastic foil of 17 cm × 17 cm, filled with demineralized water) for optimal coupling of the electrodes to the phantom [Citation25]. This way, full contact over the whole bolus area is indeed ensured when using a 15 cm diameter electrode, but not for the 25 cm diameter electrode. The agreement improves when we assume that the contact area is smaller than 25 cm diameter. Again a very good agreement between measured and simulated profiles is observed when assuming that the bolus is in perfect contact with the phantom over an area with a diameter of 21 cm (; red curve). The SAR value at 1 cm depth is ∼45%, for both measurement and simulation. The minimum measured SAR value was about 20%, where simulation predicted ∼35%. Since the simulation shows a very good agreement with all other 10 out of 11 measurement points (< 5% deviation), and the sudden sharp decay does not look very realistic, we can conclude that the disagreement between measurement and simulation at this specific point at 8 cm depth is explained by a local measurement inaccuracy.
Figure 9. Simulated normalized SAR distribution and measured and simulated profiles for the Celsius TCS system using a top and bottom electrode with a diameter of 25 cm and 15 cm, respectively on a rectangular homogeneous 2/3 muscle phantom (). Measurements were taken from Beck et al. [Citation25].
![Figure 9. Simulated normalized SAR distribution and measured and simulated profiles for the Celsius TCS system using a top and bottom electrode with a diameter of 25 cm and 15 cm, respectively on a rectangular homogeneous 2/3 muscle phantom (Figure 3). Measurements were taken from Beck et al. [Citation25].](/cms/asset/80a93d2f-039a-4f3d-82d1-45f395c02e94/ihyt_a_2093996_f0009_c.jpg)
3.3.2. Inhomogeneous phantoms
Results of the simulated normalized SAR distribution and comparison of measured and simulated profiles for an inhomogeneous 2/3 fat-muscle phantom set-up with two 15 cm diameter electrodes are shown in . Profiles were normalized to 100% at the first measurement point below the fat layer, i.e., at ∼1.5 cm depth. This yields SAR values inside the fat layer exceeding 300%, confirming the generally known clinical challenge that hot spots in superficial fat layers can limit adequate heating at depth with capacitive devices. The SAR rapidly drops to the minimum value of ∼15% halfway the phantom, after which it slightly increases again to ∼30% toward the bottom electrode. This behavior is very well predicted by the simulations and again the overall agreement is within 5%.
Figure 10. Simulated normalized SAR distribution and measured and simulated profiles for the Celsius TCS system using a top and bottom electrode with a diameter of 15 cm and 15 cm, respectively on a rectangular fat-muscle phantom (). Measurements were taken from Beck et al. [Citation25].
![Figure 10. Simulated normalized SAR distribution and measured and simulated profiles for the Celsius TCS system using a top and bottom electrode with a diameter of 15 cm and 15 cm, respectively on a rectangular fat-muscle phantom (Figure 3). Measurements were taken from Beck et al. [Citation25].](/cms/asset/d021984a-32e6-4fcd-943c-e8bf93b0b35c/ihyt_a_2093996_f0010_c.jpg)
shows results of the simulated normalized SAR distribution and comparison of measured and simulated profiles for a homogenous 2/3 muscle phantom with an integrated bony structure, again applying two 15 cm diameter electrodes. Simulations were normalized such that measured and simulated SAR values at 13.5 cm depth were equal. The SAR decays toward the bony structure, which shows a clear shielding effect. Inside the bone cylinder, the SAR is only ∼5–10%, which is correctly predicted by the simulation. Again, a very good agreement between measurements and simulations is observed, with deviations <5%. The only exception here is the first measurement point at 1 cm depth, where the measured SAR is 100% and the simulation predicts ∼45%. The very good correspondence between measurement and simulation for the rest of the curve indicates that this first point suffers from a measurement inaccuracy, likely explained by the relatively large local SAR/thermal gradient.
Figure 11. Simulated normalized SAR distribution and measured and simulated profiles for the Celsius TCS system using a top and bottom electrode with a diameter of 15 cm and 15 cm, respectively on a rectangular 2/3 muscle phantom with a cylindrical bone structure inside (). Measurements were taken from Beck et al. [Citation25].
![Figure 11. Simulated normalized SAR distribution and measured and simulated profiles for the Celsius TCS system using a top and bottom electrode with a diameter of 15 cm and 15 cm, respectively on a rectangular 2/3 muscle phantom with a cylindrical bone structure inside (Figure 3). Measurements were taken from Beck et al. [Citation25].](/cms/asset/1109fde0-8d0f-4584-b825-0242a68810c4/ihyt_a_2093996_f0011_c.jpg)
3.4. Clinical treatment planning example
3.4.1. Optimizing the treatment set-up
To determine the most effective treatment strategy for an anal carcinoma patient who is assumed to be treated with the Celsius TCS device, all treatment set-ups as shown in were simulated. Simulation times varied between ∼15 and ∼30 min using an NVIDIA GeForce GTX 760 GPU, depending on the treatment set-up. shows the hot spot and average target SAR values, as well as the HTQ (EquationEquation (6)(6)
(6) ) for different electrode combinations and treatment positioning (prone or supine) simulated for this patient. To allow a direct and fair comparison, the total absorbed power in the patient was normalized to 100 W for all situations. As expected based on the location of the tumor, an asymmetrical electrode set-up yields the highest average SAR in the target region for both prone and supine positioning, but also the risk of overheating normal tissue is highest because of the relatively high hot spot SAR. The ratio between hot spot and target SAR (HTQ) seems to be most favorable when two equally sized electrodes of 25 cm diameter would be used. The HTQ is predicted to be even slightly better for supine position, but the difference is quite small (HTQ is 6.8 vs. 7.3 for supine and prone position, respectively).
Table 2. Predicted SAR values and HTQ for different electrode combinations and treatment positioning (prone or supine) when heating an anal cancer patient with the Celsius TCS device.
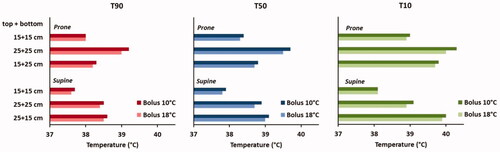
Since the maximum SAR is usually located quite close to the skin, bolus cooling has a large influence in whether these hot spots actually become treatment limiting or not. Therefore, in addition, we performed also thermal simulations for all different treatment set-ups, with bolus temperatures of 10 °C and 18 °C, reflecting the clinically used range of bolus temperatures. For all cases, total power was scaled such that the maximum temperature does not exceed 45 °C; i.e., the threshold for a pain sensation [Citation31]. shows the predicted indexed temperatures T90, T50 and T10 and it is observed that the treatment configuration has indeed a large impact on the expected treatment result. Considering a 10 °C water bolus, the overall variation in predicted T90 is 1.5 °C, with the lowest value predicted for supine position and two 15 cm electrodes (T90 = 37.7 °C) and the highest predicted T90 for prone position with two 25 cm electrodes (T90 = 39.2 °C). For the predicted T50 this variation reaches 1.8 °C, with minimum and maximum values of 37.9 °C and 39.7 °C for these treatment set-ups, respectively. Results are quite similar for a bolus temperature of 18 °C, with overall slightly lower tumor temperatures.
Figure 12. Simulated indexed temperatures T90, T50 and T10 for different electrode combinations and treatment positioning (prone or supine). Water bolus temperatures reflecting the clinically relevant range were used (10 °C or 18 °C) and power was scaled such that the maximum normal tissue temperature did not exceed 45 °C for all situations.
Although for the 25 + 25 cm set-up a slightly more favorable HTQ is predicted for supine position, prone position yields higher average SAR values in the target and thus a better focusing. This is explained by the effectively larger bottom electrode due to coupling effects to the treatment table, which yields slightly more focusing of the power toward the top electrode. The hot spot SAR is also slightly higher for the prone position, but the bolus cooling makes that this does not lead to more severe treatment limiting hot spots. The difference in predicted T90 and T50 for prone and supine position using a 25 + 25 cm set-up is 0.6–0.8 °C. The total absorbed power in the patient for a 25 + 25 cm set-up in prone position is 143–156 W, depending on the bolus temperature. Assuming an efficiency of ∼90% yields an output power of ∼160–175 W, which is well within the clinically tolerated maximum power level of 200 W when using a Celsius TCS system [Citation29]. Beyond 150 W, the risk of treatment limiting hot spots increases. However, even if a slight power reduction would be necessary, this treatment set-up can still be expected to yield the most favorable results, since the predicted temperatures are significantly higher compared to the other treatment set-ups. Thus, for this patient a prone treatment position and two 25 cm electrodes can be expected to yield the best treatment quality. For this set-up a relatively low HTQ compared to the other possible treatment set-ups is predicted and the highest tumor temperatures. shows the predicted 1 cc SAR distribution and the corresponding temperature distribution for this optimal treatment set-up and a water bolus temperature of 10 °C.
Figure 13. Simulated 1 cc SAR distribution and corresponding temperature distribution for the optimal treatment set-up: the patient in prone position and two 25 cm diameter electrodes. The water bolus temperature was 10 °C and total power was scaled such that the maximum predicted normal tissue temperature did not exceed 45 °C.
3.4.2. The effect of additional saline overlay boluses
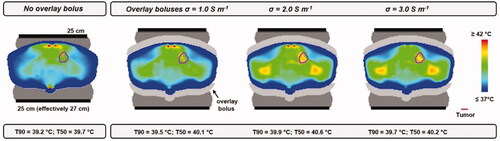
As observed in , the achievable tumor temperature is limited by superficial hot spots. The use of additional overlay boluses with various salinities was simulated to evaluate whether this relatively simple adjustment to the treatment set-up could improve treatment quality. shows the predicted temperature distributions considering overlay boluses with an electrical conductivity σ = 1.0, 2.0 and 3.0 S m−1. Results are compared to the default situation without overlay boluses. When σ = 1.0 S m−1, tumor temperatures are predicted to improve slightly (T90 + 0.3 °C). Superficial hot spots are slightly reduced, but remain treatment limiting. Further increasing the salinity/conductivity increases the power absorption in the overlay bolus, thereby further reducing the superficial hot spots. When σ = 3.0 S m−1, the T90 is predicted to increase with 0.5 °C, and in that case a somewhat more deep-seated hot spot is treatment limiting (not visible in the picture). For the simulated variations in overlay boluses σ = 2.0 S m−1 is predicted to yield the largest improvement in treatment quality. The T90 and T50 are 39.9 and 40.6 °C, respectively; 0.7–0.9 °C higher compared to temperatures predicted for the default set-up without overlay boluses, which is a clinically relevant improvement.
Figure 14. Simulated temperature distributions when applying 10 °C overlay boluses at various salinities, compared with the default situation without overlay boluses. The optimal treatment set-up for this patient was considered, i.e., prone position and two 25 cm diameter electrodes. Total power was scaled such that the maximum predicted normal tissue temperature did not exceed 45 °C.
Improvement of treatment delivery with this strategy would require more power since 1) the overlay bolus itself absorbs part of the power and 2) more power is needed to actually increase the tumor temperature. For overlay boluses with σ = 2.0 S m−1, a total power of 288 W was absorbed in the patient, and 97 W in the overlay boluses. Although the clinically tolerated maximum output power level is usually 200 W for a Celsius TCS system, a higher power level would probably be feasible when using overlay boluses, since less severe superficial hot spots would be expected. This is supported by the fact that also much higher power levels are generally used in clinical practice with the Thermotron RF8 device [Citation32,Citation35]. Nevertheless, when clinical feasibility would be evaluated, treatment would always start with a low initial power level, which will be gradually increased depending on patient tolerance to avoid complications.
4. Discussion
The hyperthermia treatment planning system Plan2Heat is being used for many years in clinical hyperthermia, mainly in combination with radiative heating systems [Citation36–40]. When treatment planning is used in clinical decision making, validation of simulations using phantom measurements is essential. Plan2Heat was validated for several radiative devices [Citation41–45]. This study validated the use of Plan2Heat for capacitive hyperthermia devices. Simulation results for various homogeneous and inhomogeneous tissue-equivalent phantoms and different electrode combinations showed a very good correspondence with published measurements for two different commonly used capacitive hyperthermia devices: the Thermotron RF8 and the Celsius TCS systems [Citation24,Citation25]. The penetration depth, a very relevant parameter when characterizing the performance of a heating system and predicting the ability to heat specific target locations, was also correctly predicted by Plan2Heat. Simulated and measured normalized SAR profiles for different configurations showed very good agreement within 5%.
Since applications of hyperthermia treatment planning for capacitive heating are still limited, validation studies are also scarce. This study provides the first extensive validation of treatment planning for capacitive heating showing very good agreement and potential for patient-specific applications. The recent publication by Beck et al, from which we used the extensive Celsius TCS measurement results, also validated capacitive treatment planning and they reported a qualitative agreement [Citation25]. Their simulations performed with Sim4Life were able to correctly describe the general behavior, that is, a smaller electrode on one side yields a shift in power absorption toward the small electrode, a fat layer absorbs a large amount of energy, thereby significantly limiting adequate heating beyond the fat layer and a bony structure shows a shielding effect. However, the SAR obtained using Sim4Life did show a large overestimation of the SAR values at depth, up to a factor 2, compared with the measurements. This overestimation also resulted in a serious overestimation of the penetration depth (which is ∼4 cm in a homogeneous phantom, based on measurements) with 2–3 cm using Sim4Life. Accurate prediction of the penetration depth is very important when treatment planning is applied to evaluate the heating ability of certain tumor locations/depths. Therefore, further research would be needed to investigate the source of these significant deviations before accurate Sim4Life-based patient-specific treatment planning for capacitive heating could be performed. Furthermore, Sim4Life simulations are quite time-consuming since the quasi-static solver of Sim4Life is currently not supported by GPU acceleration [Citation46]. This low computational speed could further limit practical use in clinical routine. Plan2Heat allows very fast calculations by GPU acceleration. Phantom simulations using an NVIDIA GeForce GTX 760 GPU took 1–5 min for the Thermotron RF8 system, depending on the electrode combination. Simulations for the Celsius TCS system showed a slower convergence because of the distilled water in the bolus; convergence is much faster for a saline-filled bolus. Phantom simulations for Celsius TCS device took ∼15 min, and patient simulations took ∼15–30 min, again depending on the treatment set-up. Plan2Heat is thus so far the first treatment planning system that was shown to accurately predict SAR profiles and penetration depth and is thereby the first planning system validated for application with capacitive devices, enabling fast patient-specific applications.
Validation of treatment planning simulations for capacitive heating was so far performed using solvers for the quasi-static formulation of Maxwell’s equations. This enables much faster simulations compared to solving the full Maxwell’s equations with the conventional Finite Difference Time Domain (FDTD) method. Exploring the feasibility of FDTD simulations for capacitive heating is subject of ongoing research. Computation times of FDTD increase with decreasing frequency and FDTD demands extensive computational resources when solving low-frequency problems. The frequencies of capacitive devices (typically 8 − 13.56 MHz) are at the lower band of the applicability of ordinary FDTD solvers, which would make the practical use of FDTD challenging. Furthermore, modeling of an RF source is required for FDTD, which enlarges the computational domain, thereby even further increasing computation times. Thus, even when future studies will be able to demonstrate the feasibility of FDTD to accurately predict heating patterns generated by capacitive heating devices, the high computational demands will significantly limit routine use of conventional FDTD-based treatment planning for capacitive hyperthermia in clinical applications.
Capacitive heating is known to have some drawbacks, such as the risk of excessive heating of superficial fat layers, which can limit adequate target heating, especially at deeper target locations. Several adjustments were investigated to improve the heating quality, for example, bolus composition, and treatment planning could be a very helpful instrument to evaluate potential further improvements, in addition to phantom measurements [Citation17,Citation18]. The benefit of simulations is that a large variety of possible improvements can be evaluated while keeping the anatomy constant. Furthermore, simulations allow a detailed evaluation of the potential hot spots in the superficial fat layers and the possible improvement in hot spot-target ratio. Thus, simulations could provide essential insights to realize future improvements in system design.
In clinical routine, treatment planning for capacitive heating can also be very helpful to ensure optimal treatment quality. Direct steering during treatment is not possible with capacitive devices and electrode diameters determine the size and location of the heating focus. Therefore, adequate electrode size selection and electrode positioning are of utmost importance to ensure optimal heating conditions [Citation47]. Based on the actual patient anatomy as recorded by CT, patient specific treatment planning can be applied by evaluating different electrode configurations and other relevant treatment parameters before treatment, such as prone or supine treatment position and water bolus temperature. Target heating and the risk of hot spots would then reveal the optimal choice for these parameters. This ensures the best possible treatment quality by determining the most favorable treatment set-up for individual patients.
Which tumor indications could be treated adequately with capacitive heating is still a topic of debate within the hyperthermia community. Although radiative heating in general allows a better heating quality, capacitive heating can also realize therapeutic temperature levels for specific patient categories. Positive clinical results have been reported for example for head&neck cancer and painful bone metastases [Citation6,Citation48]. Also in cervical cancer patients with a small superficial fat layer therapeutic temperatures can be realized [Citation49]. indicate a SAR penetration depth of ∼4 cm, which should be adequate to treat tumor sites at superficial and semi-deep locations. A previous simulation study also showed that capacitive heating would be feasible for superficial tumor sites, although hot spots in the superficial fat layer remain a treatment limiting factor [Citation2]. Capacitive devices could thus play a role in the battle against cancer, especially in low- and middle-income countries, where sophisticated phased array systems and dedicated radiative devices may prove less affordable. Local healthcare quality for cancer patients can then improve with capacitive devices, provided that quality assurance (QA) is ensured by on-line temperature monitoring and sensible patient selection. Overall, treatment planning can provide more and essential insight in which specific patient categories can be treated with capacitive devices. For example, Kato et al used basic simulations with varying metallic implant size and shape, insertion site and insertion direction, to develop recommended guidelines for safe capacitive heating methods to treat patients with metallic implants [Citation50]. Treatment planning can thus also be instrumental in development of general international QA guidelines for capacitive hyperthermia.
5. Conclusion
Comparison of simulation results with analytical solutions and measurements in homogeneous and inhomogeneous phantoms for two different capacitive devices showed that Plan2Heat can accurately predict heating patterns generated by a capacitive system; deviations between measurements and simulations were <5%. Plan2Heat provides fast GPU-based treatment planning and accurately predicts the effective heating depth for various treatment configurations. These results provide a solid basis to use Plan2Heat in patient-specific treatment planning for capacitive hyperthermia, as was illustrated by a clinical case of an anal cancer patient.
Disclosure statement
No potential conflict of interest was reported by the author(s).
References
- Kok HP, Cressman ENK, Ceelen W, et al. Heating technology for malignant tumors: a review. Int J Hyperthermia. 2020;37(1):711–741.
- Kok HP, Crezee J. A comparison of the heating characteristics of capacitive and radiative superficial hyperthermia. Int J Hyperthermia. 2017;33(4):378–386.
- Kok HP, Navarro F, Strigari L, et al. Locoregional hyperthermia of deep-seated tumours applied with capacitive and radiative systems: a simulation study. Int J Hyperthermia. 2018;34(6):714–730.
- Kroeze H, Kokubo M, van de Kamer JB, et al. Comparison of a capacitive and a cavity slot radiative applicator for regional hyperthermia. Jpn J Hyperthermic Oncol. 2002;18(2):75–91.
- Harima Y, Nagata K, Harima K, et al. A randomized clinical trial of radiation therapy versus thermoradiotherapy in stage IIIB cervical carcinoma. 2001. Int J Hyperthermia. 2009;25(5):338–343.
- Huilgol NG, Gupta S, Sridhar CR. Hyperthermia with radiation in the treatment of locally advanced head and neck cancer: a report of randomized trial. J Can Res Ther. 2010;6(4):492–496.
- Ohguri T, Imada H, Kato F, et al. Radiotherapy with 8 MHz radiofrequency-capacitive regional hyperthermia for pain relief of unresectable and recurrent colorectal cancer. Int J Hyperthermia. 2006;22(1):1–14.
- Abe M, Hiraoka M, Takahashi M, et al. Multi-institutional studies on hyperthermia using an 8-MHz radiofrequency capacitive heating device (Thermotron RF-8) in combination with radiation for cancer therapy. Cancer. 1986;58(8):1589–1595.
- Bakker A, Tello Valverde CP, van Tienhoven G, et al. Post-operative re-irradiation with hyperthermia in locoregional breast cancer recurrence: temperature matters. Radiother Oncol. 2022;167:149–157.
- Bakker A, Van der Zee J, van tienhoven G, et al. Temperature and thermal dose during radiotherapy and hyperthermia for recurrent breast cancer are related to clinical outcome and thermal toxicity: a systematic review. Int J Hyperthermia. 2019;36(1):1024–1039.
- Franckena M, Fatehi D, de Bruijne M, et al. Hyperthermia dose-effect relationship in 420 patients with cervical cancer treated with combined radiotherapy and hyperthermia. Eur J Cancer. 2009;45(11):1969–1978.
- Kroesen M, Mulder HT, Van Holthe JML, et al. Confirmation of thermal dose as a predictor of local control in cervical carcinoma patients treated with state-of-the-art radiation therapy and hyperthermia. Radiother Oncol. 2019;140:150–158.
- Overgaard J, Gonzalez DG, Hulshof MCCH, et al. Hyperthermia as an adjuvant to radiation therapy of recurrent or metastatic malignant melanoma. A multicentre randomized trial by the European Society for Hyperthermic Oncology. International Journal of Hyperthermia. 1996;12(1):3–20.
- Nakahara S, Ohguri T, Kakinouchi S, et al. Intensity-modulated radiotherapy with regional hyperthermia for high-risk localized prostate carcinoma. Cancers (Basel. 2022;14(2):400.
- Kok HP, van der Zee J, Guirado FN, et al. Treatment planning facilitates clinical decision making for hyperthermia treatments. Int J Hyperthermia. 2021;38(1):532–551.
- Kok HP, Crezee J. Hyperthermia treatment planning: clinical application and ongoing developments. IEEE J. Electromagn. RF Microw. Med. Biol. 2021;5(3):214–222.
- Ohguri T, Kuroda K, Yahara K, et al. Optimization of the clinical setting using numerical simulations of the electromagnetic field in an obese patient model for deep regional hyperthermia of an 8 MHz radiofrequency capacitively coupled device in the pelvis. Cancers (Basel). 2021;13(5):979.
- Tomura K, Ohguri T, Mulder HT, et al. The usefulness of mobile insulator sheets for the optimization of deep heating area for regional hyperthermia using a capacitively-coupled heating method: Phantom, simulation and clinical prospective studies. Int J Hyperthermia. 2018;34(7):1092–1103.
- Kok HP, Kotte ANTJ, Crezee J. Planning, optimisation and evaluation of hyperthermia treatments. Int J Hyperthermia. 2017;33(6):593–607.
- de Bree J, van der Koijk JF, Lagendijk JJW. A 3-D SAR model for current source interstitial hyperthermia. IEEE Trans Biomed Eng. 1996;43(10):1038–1045.
- Gabriel S, Lau RW, Gabriel C. The dielectric properties of biological tissues: II. Measurements in the frequency range 10 Hz to 20 GHz. Phys Med Biol. 1996;41(11):2251–2269.
- Hasgall PA, Di Gennaro F, Baumgarter C, et al. IT’IS Database for thermal and electromagnetic parameters of biological tissues. Version 3.0, www.itis.ethz.ch/database. 2015.
- Song CW. Effect of local hyperthermia on blood flow and microenvironment: a review. Cancer Res. 1984;44(10 Suppl):4721s–4730s.
- Song CW, Rhee JG, Lee CK, et al. Capacitive heating of phantom and human tumors with an 8 MHz radiofrequency applicator (Thermotron RF-8). Int J Radiat Oncol Biol Phys. 1986;12(3):365–372.
- Beck M, Wust P, Oberacker E, et al. Experimental and computational evaluation of capacitive hyperthermia. Int J Hyperthermia. 2022;39(1):504–516.
- Hornsleth SN, Mella O, Dahl O. A new segmentation algorithm for finite difference based treatment planning systems. in Hyperthermic oncology 1996. vol. 2, C. Franconi, G. Arcangeli, and R. Cavaliere, Eds., ed Rome, Italy Tor Vergata, 1996. pp. p. 521–523.
- Canters RA, Wust P, Bakker JF, et al. A literature survey on indicators for characterisation and optimisation of SAR distributions in deep hyperthermia, a plea for standardisation. Int J Hyperthermia. 2009;25(7):593–608.
- Canters RA, Franckena M, Van der Zee J, et al. Optimizing deep hyperthermia treatments: are locations of patient pain complaints correlated with modelled SAR peak locations? Phys Med Biol. 2011;56(2):439–451.
- The gentle power of hyperthermia TCS – Tumor Cell Solution for regional hyperthermia therapy. https://pdf.medicalexpo.com/pdf/celsius-42/tcs-tumor-cell-solution/121368-194331.html. Accessed Nov 2020.
- Pennes HH. Analysis of tissue and arterial blood temperatures in the resting human forearm. J Appl Physiol. 1948;1(2):93–122. 1948
- Stoll AM, Greene LC. Relationship between pain and tissue damage due to thermal radiation. J Appl Physiol. 1959;14(3):373–382.
- Ohguri T, Imada H, Yahara K, et al. Effect of 8-MHz radiofrequency-capacitive regional hyperthermia with strong superficial cooling for unresectable or recurrent colorectal cancer. Int J Hyperthermia. 2004;20(5):465–475.
- Kato H, Hyodo K, Akasaka N, et al. Optimization of bolus for capacitive type heating. Jpn J Hyperthermic Oncol. 1997;13(1):10–17.
- Neufeld E, Chavannes N, Samaras T, et al. Novel conformal technique to reduce staircasing artifacts at material boundaries for FDTD modeling of the bioheat equation. Phys Med Biol. 2007;52(15):4371–4381.
- Harima Y, Ohguri T, Imada H, et al. A multicentre randomised clinical trial of chemoradiotherapy plus hyperthermia versus chemoradiotherapy alone in patients with locally advanced cervical cancer. Int J Hyperthermia. 2016;32(7):801–808.
- Kok HP, Korshuize-van Straten L, Bakker A, et al. Online adaptive hyperthermia treatment planning during locoregional heating to suppress treatment-limiting hot spots. Int J Radiat Oncol Biol Phys. 2017;99(4):1039–1047.
- Kok HP, Crezee J. Adapt2Heat: treatment planning-assisted locoregional hyperthermia by on-line visualization, optimization and re-optimization of SAR and temperature distributions. Int J Hyperthermia. 2022;39(1):265–277.
- Kok HP, de Kroon-Oldenhof R, Korshuize - van Straten L, et al. RF Heating of Pancreatic Tumours Guided by Hyperthermia Treatment Planning and Limited Thermometry Proceedings of the 48th European Microwave Conference. 2018. p. 332–335.
- Kok HP, Korshuize-van Straten L, Bakker A, et al. Feasibility of on-line temperature-based hyperthermia treatment planning to improve tumour temperatures during locoregional hyperthermia. Int J Hyperthermia. 2018;34(7):1082–1091.
- Kok HP, Van Haaren PMA, van de Kamer JB, et al. Prospective treatment planning to improve locoregional hyperthermia for oesophageal cancer. Int J Hyperthermia. 2006;22(5):375–389.
- Van Haaren P, Kok P, Van Stam G, et al. SAR measurements and FDTD calculations in inhomogeneous phantom models. 9th International Congress on Hyperthermic Oncology, St.Louis, USA, 2004. Abstracts2004;pp. 167.
- Van Haaren PMA, Kok HP, Wiersma J, et al. Faster EM-field calculations for locoregional hyperthermia treatment planning using the FDTD method. 21st Annual Meeting of the European Society for Hyperthermic Oncology, Abstract book. Munich, Germany. 2003. p. 137.
- Van Haaren PMA, Kok HP, Van den Berg CAT, et al. On verification of hyperthermia treatment planning for cervical carcinoma patients. Int J Hyperthermia. 2007;23(3):303–314.
- van Stam G, Kok HP, Hulshof M, et al. A flexible 70 MHz phase-controlled double waveguide system for hyperthermia treatment of superficial tumours with deep infiltration. Int J Hyperthermia. 2017;33(7):796–809.
- Crezee J, Van Haaren PMA, Westendorp H, et al. Improving locoregional hyperthermia delivery using the 3-D controlled AMC-8 phased array hyperthermia system: a preclinical study. Int J Hyperthermia. 2009;25(7):581–592.
- Androulakis I, Mestrom RMC, Christianen M, et al. simultaneous thermobrachytherapy: electromagnetic simulation methods for fast and accurate adaptive treatment planning. Sensors. 2022;22(4):1328.
- Tsuda N, Kuroda K, Suzuki Y. An inverse method to optimize heating conditions in RF-capacitive hyperthermia. IEEE Trans Biomed Eng. 1996;43(10):1029–1037.
- Chi MS, Yang KL, Chang YC, et al. Comparing the effectiveness of combined external beam radiation and hyperthermia versus external beam radiation alone in treating patients with painful bony metastases: a phase 3 prospective, randomized, controlled trial. Int J Radiat Oncol Biol Phys. 2018;100(1):78–87.
- Ohguri T, Harima Y, Imada H, et al. Relationships between thermal dose parameters and the efficacy of definitive chemoradiotherapy plus regional hyperthermia in the treatment of locally advanced cervical cancer: data from a multicentre randomised clinical trial. Int J Hyperthermia. 2018;34(4):461–468.
- Kato H, Kondo M, Imada H, et al. Quality assurance: recommended guidelines for safe heating by capacitive-type heating technique to treat patients with metallic implants. Int J Hyperthermia. 2013;29(3):194–205.