
 ?Mathematical formulae have been encoded as MathML and are displayed in this HTML version using MathJax in order to improve their display. Uncheck the box to turn MathJax off. This feature requires Javascript. Click on a formula to zoom.
Abstract
Background
Highly consistent cardiac ablation outcomes through radiofrequency catheter ablation (RFCA) under pulsatile and constant flow profiles (PP&CP) of intracardiac blood were previously indicated by computer modeling, with simplified geometry and lossless receipt of inflow for ablation catheters. This study aimed to further investigate the effects of intracardiac blood pulsatility in an anatomy-based atrium model.
Methods
Four pulmonary veins were blood inflows at 10 mm Hg. The mitral valve was the outflow, with PP based on pulsatile velocity curve from clinical measurements, and CP was obtained by averaging the velocity curve under PP over an ablation time of 30 s. A numerical comparison between ablation results under PP and CP, without experimental validation, was performed.
Results
Temperature fluctuations persisted in mid-myocardium, and most clearly in blood and endocardium under PP. At a constant power of 20 W, marked differences in ablation outcome between PP and CP occurred in the middle of unilateral pulmonary veins and the posterior wall of the left atrium (LA) where the blood velocities were significantly decreased under CP. The mid-myocardial, blood and endocardial temperatures, as well as the effective lesion volume at the former position, were decreased by 4.1%, 15%, 13.6%, and 13.8%, respectively under PP. The extents for the latter position were 11%, 22%, 22.5%, and 55.6%, respectively.
Conclusion
Intracardiac flow pulsatility causes a greater reduction in blood and endocardial temperatures at ablation sites away from the main bloodstream, effective cooling of which is more likely to rely on blood velocities approaching peak PP values.
1. Introduction
Radiofrequency catheter ablation (RFCA) has been the preferred method for treating and easing the burden of atrial fibrillation (AF), which is the most prevalent type of cardiac arrhythmia, during the past decade [Citation1,Citation2]. During this treatment, cardiac tissue that allows the transmission of abnormal electrical signals in the heart which can lead to AF is thermally damaged by delivering a radiofrequency (RF) current using a percutaneous ablation catheter [Citation3]. Computer models are now being widely used to analyze and understand the characteristics of heat transfer and lesion formation during RFCA, which facilitate the fundamental contribution of AF treatment [Citation4,Citation5]. In addition to the essential electrical and thermal problems requiring solutions for modeling ablation procedures, solving the cooling effect experienced by the cardiac tissue and electrode through blood flow is also required for the simulation of RFCA. Furthermore, recent RFCA simulations also consider the saline irrigation functioned by the ablating electrode, as cooling the temperature around the electrode-tissue interface prevents the thrombus formation from overheating [Citation6–8].
The aforementioned cooling effects of blood and saline irrigation were previously simulated by applying convective coefficients to the tissue surface [Citation9–11] and a fixed temperature throughout the electrode surface, respectively [Citation8,Citation9,Citation12]. However, such simplifications have been proven to overestimate the lesion surface width and blood temperature [Citation8]. Therefore, there should be a consideration of the fluid dynamics in RFCA simulations. In the existing literature, the consideration of fluid dynamics related to intracardiac blood in RFCA computer models mostly involves the application of a constant and continuous flow velocity, ignoring blood pulsatility [Citation13]. An improved modeling study using a pulsatile flow profile, by Pares et al. [Citation14], showed that pulsatile flow in the cardiac chamber has an insignificant effect on the maximum tissue and blood temperatures and that the influence on lesion size can be ignored for computer models. Therefore, the pulsatile flow profile can be replaced by a constant profile. This conclusion, however, is derived from a simplified model where a fragment of cardiac tissue was constructed and the ablating catheter directly experienced a blood flow profile mimicking the flow velocity in the pulmonary vein ostium, assuming that the catheter was placed inside the pulmonary vein (PV), whereas this is not a recommended ablation site due to an increased rate of RFCA complications, such as PV stenosis [Citation15]. As the left atrium (LA) is the most common domain for AF triggers, recent ablation strategies suggest different ablation sites in this chamber [Citation16] in which the blood flow is mixed from four PVs. This flow condition is still unusual in modeling studies of the RFCA.
Therefore, this study aimed to further investigate the effects of pulsatile intracardiac blood flow on ablation outcomes using an anatomy-based heart model. The ablation outcome was compared with that under a constant and continuous blood velocity, which represents the common simplification of fluid dynamics in simulation studies of RFCA.
2. Materials and methods
2.1. Geometry of the ablation model
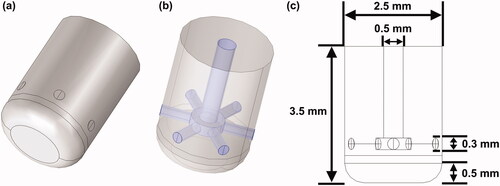
A three-dimensional ablation model, previously constructed in [Citation17], was used to perform the simulation. The ablation outcomes obtained from the current model had not been experimentally validated. The geometric construction was established in COMSOL Multiphysics 5.6 (COMSOL, Burlington, MA). The construction consisted of an atrium model (without ventricular chambers) immersed in an elliptical cylinder, acting as a portion of the thorax. The thorax model was formed in layers, such as the skin, subcutaneous fat, muscle, and connective tissue. A rectangular area was lined to simulate the grounding pad on the back. The detailed dimensions of the geometry are shown in . Four ablation sites in the LA were selected according to the recent ablation strategy (Section Selection of ablation sites) [Citation16,Citation18]. A section of the ablation catheter was modeled, and the electrode tip (7.5-Fr, 3.5 mm) with six irrigation ports () was built based on the Navister ThermoCool ablation catheter (Biosense Webster, Diamond Bar, CA) [Citation19]. The detailed construction of the internal lumina for saline infusion and the dimension of the electrode tip was demonstrated in , respectively. The electrode was inserted as perpendicular as possible into the myocardium for approximately 1 mm, forming a typical monopolar ablation. As it is difficult to measure the insertion depth of the electrode in an anatomy-based heart model, owing to the inhomogeneous geometry, the electrode model was first inserted into a flat domain for 1 mm, calculating the surface area (15.84 mm2) and volume (4.51 mm3) of the penetration. Those two values with a deviation of ±5% were then used as criteria to ensure a relatively consistent insertion of the electrode among all target sites.
Figure 1. Construction and geometry of the ablation model. IVC/SVC: inferior/superior vena cava; LAA/RAA: left/right atrial appendage; LSPV/LIPV/RSPV/RIPV: left superior/left inferior/right superior/right inferior pulmonary vein.
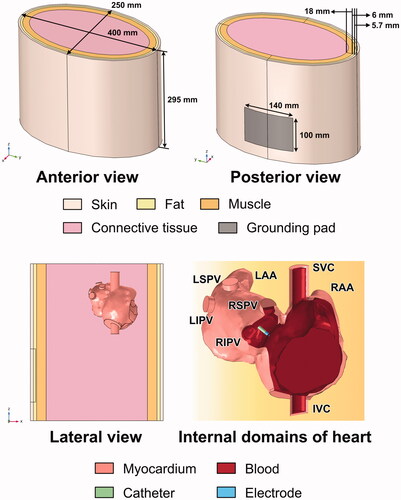
Figure 2. Model of the electrode tip. (a) External view; (b) internal construction of the lumina for saline infusion; and (c) detailed dimension.
2.2. Selection of ablation sites
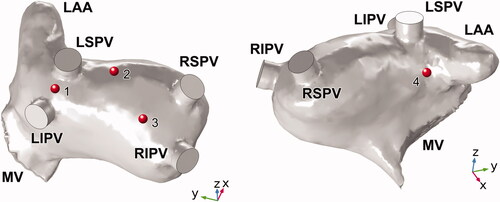
shows the four ablation sites selected for this study. Position 1 was located between the left superior and inferior pulmonary veins (LSPV), proposed by the additional linear ablation of unilateral PVs [Citation18]. Positions 2, 3, and 4 were all placed >1.5 cm from the PV ostium, belonging to the novel wide atrial pulmonary vein isolation (PVI) [Citation20] which represents a modification of the cornerstone of AF ablation Position 2 was placed on the LA roof between the LSPV and right superior pulmonary vein (RSPV), which is also a target site for linear ablation. Position 3 was placed on the posterior wall (PW) of the LA, located near the RSPV and the right inferior pulmonary vein (RIPV), where complex fractionated atrial electrograms (CFAEs) may be detected [Citation16]. Position 4 was the only target site on the anterior side of the LA, which was set below the LSPV and near the left atrial appendage (LAA) ostium.
Figure 3. Selection of ablation sites on the endocardium of LA. LAA: left atrial appendage; LSPV/LIPV/RSPV/RIPV: left superior/left inferior/right superior/right inferior pulmonary vein; MV: mitral valve.
2.3. Governing equations
The current ablation model was based on a multi-physical fields coupling problem, the electrical and thermal components of which were simulated by the electric currents and bioheat transfer interfaces respectively in COMSOL Multiphysics. Biological tissue under RF (∼500 kHz) can be regarded as a total resistive medium [Citation21]. Therefore, the electrical problem of the RFCA can then be described by a quasistatic method that satisfies
(1)
(1)
where
is the electrical conductivity of the tissue (Sm−1), V is the voltage (V), and E is the electric field (Vm−1). The resistive heating Qh produced by the RF current can be expressed as
which is coupled within the equation of the thermal problem, namely the Pennes bioheat equation:
(2)
(2)
where ρ, c, T, and k are the density (kg m−3), specific heat (J kg−1 K−1), temperature (K), and thermal conductivity (W m−1 K−1), respectively.
and
are the heat loss due to blood perfusion (W m−3) and metabolic heat production (W m−3), respectively. These two terms are usually neglected because of their negligible effects on CA.
is the heat loss due to fluid dynamics (i.e., blood flow and saline irrigation), where
is the blood velocity (ms−1), and is described by the incompressible Navier–Stokes equations, consisting of the momentum and mass equations [8]:
(3)
(3)
(4)
(4)
where P is the pressure (Pa), and
is the blood viscosity (0.0035 kg ms−1 [Citation22]). The body force F (N m−3) was neglected in the model.
2.4. Physical properties of materials
lists the physical properties of each material used in the ablation model [Citation10,Citation14,Citation17]. The electrical conductivity of the connective tissue was determined to match the clinical transthoracic impedance to 120 Ω. The electrical (
) and thermal conductivities (
) of the myocardium were isotropic at 37 °C and follow two temperature-dependent piecewise functions [Citation6]:
(5)
(5)
(6)
(6)
Table 1. Thermal and electrical properties of the materials used in the ablation model.
Considering the effect of fiber architecture on myocardial electrical conductivity, the isotropic value in this study was adjusted until the initial impedance matched that under the anisotropic conductivities, which were 0.40 and 0.28 S/m in longitudinal and transverse directions, respectively [Citation17]. The ablation outcome under isotropic conditions can therefore largely agree with the anisotropic condition [Citation9].
The electrical conductivity of the connective tissue was flexible, and it was determined so that the initial impedances of the model among all simulation cases were approximately 120 Ω, which approached the value determined from clinical measurement [Citation23].
2.5. Boundary conditions
shows the boundary conditions of the ablation model. A constant power of 20 W was applied to the electrode tip. The grounding pad was set to 0 V. A null electric flux was added to the other model surfaces. An initial temperature and a constant temperature, both set at 37 °C, were defined for the entire and outer surfaces of the model, respectively except for the top surface of the central lumen inside the electrode tip where a constant temperature TS of 30 °C was applied to model the inlet of cooled saline infusion [Citation24].
Figure 4. Boundary conditions of electrical, thermal and fluid problems in the ablation model. LAA: left atrial appendage; LSPV/LIPV/RSPV/RIPV: left superior/left inferior/right superior/right inferior pulmonary vein; MV: mitral valve.
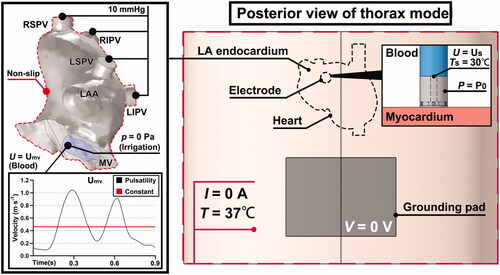
For fluid dynamics, the blood flow in the LA was simulated by setting the four PVs as inflows with a condition of 10 mmHg [Citation25], and the mitral valve (MV) as an outflow with a pulsatile flow profile (PP) and a constant flow profile (CP), respectively, for comparison. The fluid type was determined by calculating the Reynolds number in the PV as [Citation26]:
(7)
(7)
where
and
are the density (kg m−3), velocity (ms−1), and viscosity (kg ms−1) of blood, respectively, and
is the diameter (m) of the PV. As the Reynolds number for the peak flow velocities in all four PVs was approximately 1800, the fluid type was set as laminar flow.
The velocity curve of PP (UMV) in one cardiac cycle at mitral annulus was based on [Citation27], and the overall amplitude was enlarged to ensure that ① the peak flow velocity of the E-wave was less than 1.3 m/s [Citation28]; ② the E/A wave ratio ranged from 0.75 to 1.5 [Citation29], and ③ the mean flow velocity in LA was around 0.2 m/s [Citation30]. The constant blood velocity at MV was calculated by averaging the UMV with respect to time. As the original atrium model had no definition of MV, an area close to the shape of the MV orifice (violet area in ) was manually designed [Citation31]. The area was adjusted to ensure that the peak flow velocity at MV was approximately twice that at the PV inlet [Citation27]. Saline irrigation was simulated by setting a constant velocity US of 3.45 m s−1 (corresponding to a flow rate of 15 ml min−1) on the top surface of the central lumen as an inflow [Citation24]. The MV, as an outflow, was applied at zero pressure in this case [Citation6,Citation8]. In addition to the inflow and outflow of blood flow and saline irrigation, the remaining boundaries of the endocardium were applied with a non-slip condition.
2.6. Preprocessing of simulation
As the construction of the thorax model was based on realistic measurement [Citation17], the convergence test was conducted to determine element size for meshing and time step for simulation except for model dimension. Eventually, the finest element size (0.15 mm) meshed around the electrode-tissue interface. All simulations were performed for 30 s, and the time step was chosen as 0.1 s. Nearly 245,000 tetrahedral elements have meshed in the entire model. The electrical conductivity of the connective tissue was 0.22 S m−1 after trial and error. The mean flow velocities of blood in the LA under PP and CP were 0.204 ± 0.113 and 0.193 ± 0.009 m/s, respectively. The peak velocities of E and A waves under PP were 1.04 and 0.91 m/s (E/A ratio = 1.1), respectively. The peak flow velocity at the PV was 0.55 m/s. These results associated with fluid dynamics matched with the previous data range [Citation27–30]. To ease the computational burden of RFCA simulation, a stationary simulation was first implemented to solve the electrical problem (i.e., the release of constant RF power), the result of which was then input as the initial value of variables in the time-dependent simulation for the multi-physical fields coupling problem. The complex physical problem was handled in segregated steps. The electrical component was solved by the GMRES solver, and the thermal and fluid components were both worked out by PARDISO solver.
3. Results
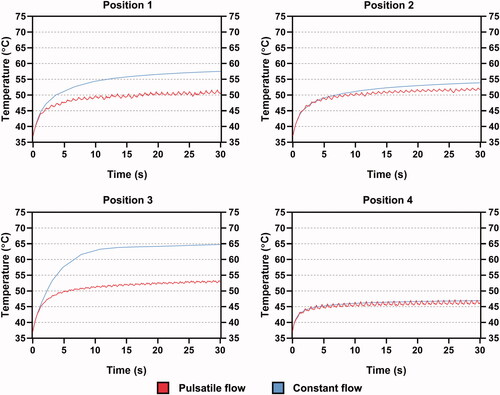
3.1. Blood velocity inspected by electrode tip
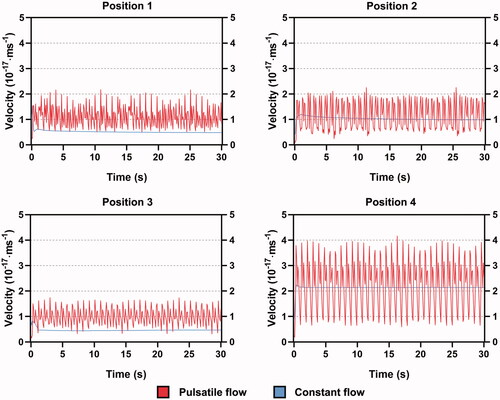
shows the blood velocity experienced by the electrode tip under PP and CP. Blood velocity fluctuated persistently with the cardiac cycle under PP. The largest peak-to-peak (PTP) amplitude occurred at position 4. The velocity was reduced in the other three positions to a large extent, especially in position 3. Both the PTP amplitudes in positions 1 and 2 were almost half of that in position 4 whereas the overall velocity was higher in position 2. For all positions, there was a floating period before the velocity became stable under CP. The velocities under CP at the stable state in positions 2 and 4 were approximately in the middle of the PTP amplitude under PP. A markedly low velocity of constant flow was observed at positions 1 and 3, which was close to the valley value of the pulsatile velocity.
Figure 5. Flow velocity was inspected by the electrode tip in the blood domain under PP and CP for all ablation sites, during 30 s of RFCA.
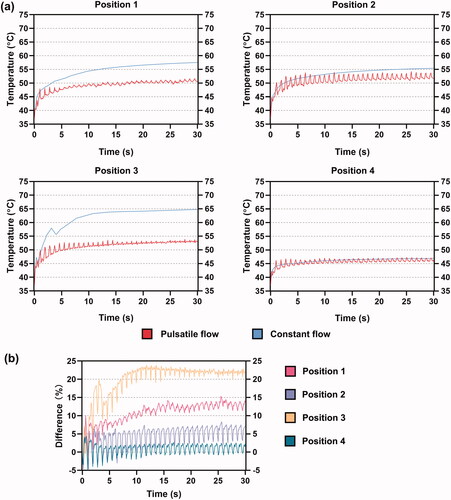
3.2. Trends of mid-myocardial and blood temperatures
shows the curves of the maximum mid-myocardial temperature under PP and CP during 30 s of RFCA. The mid-myocardial temperature showed a fluctuating increase under PP, while the extent of this fluctuation was not apparent in position 3. The mid-myocardial temperature in positions 1 and 3 under CP started to surpass the result under PP after 1 s whereas an overall similarity was achieved in positions 2 and 4 under the two fluid conditions. shows the temperature difference between PP and CP, which was calculated as follows:
(8)
(8)
Figure 6. (a) The maximum temperature growth in midmyocardium and (b) corresponding temperature difference between PP and CP for all ablation sites, during 30 s of RFCA.
reflects the degree of difference when PP was used as the reference.
and
represented the mid-myocardial temperature under CP and PP, respectively. A positive difference means that the temperature under CP is larger than that under PP, and vice versa. For positions 1 and 3, the temperature difference directly increased from the beginning of RFCA. For positions 2 and 4, the temperature difference first decreased and then kept increasing after 5 s. From 20 s, the difference started to float around 1% in position 2 which corresponded to the slight exceeding of mid-myocardial temperature under CP as shown in . The smallest degree of deviation, yielding a great overlap of mid-myocardial temperature under PP and CP, was observed at position 4 with the proceed of RFCA.
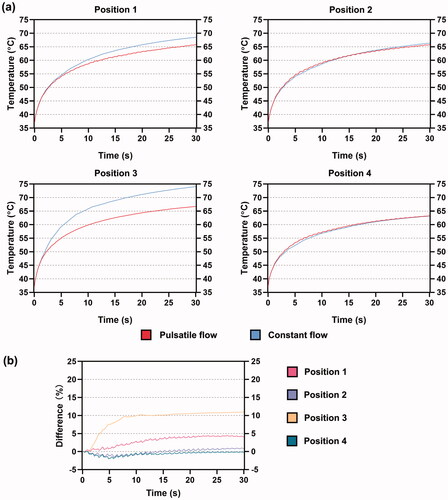
shows the curves of the maximum blood temperature and corresponding temperature difference (similarly based on EquationEquation (8)(8)
(8) ) under the two fluid conditions. The blood temperature was lower than the mid-myocardium but with more intense fluctuation under PP in all the cases. The blood temperature under CP was more likely to surpass the results under PP. Compared to the case of mid-myocardial temperature, the deviation of blood temperature increased between the two conditions, especially in positions 1 and 3, at approximately 15% and 22%, respectively. Positions 2 and 4 still remained more stable and had minor temperature differences, within an average value of 5% and 1%, respectively.
Figure 7. (a) The maximum temperature growth in blood and (b) corresponding temperature difference between PP and CP for all ablation sites, during 30 s of RFCA.
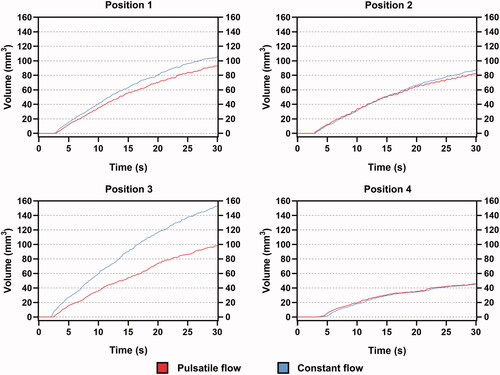
3.3. Effective lesion volume
plots the effective lesion volume at four positions, measured by the temperature contour above 50 °C. Position 4 was the last site to generate an effective lesion, at nearly 5 s. In contrast, only half of that time was required in positions 1 and 3. It was found that the difference in mid-myocardial temperature amplified that in lesion volume under the two fluid conditions. For position 1, the differences in mid-myocardial temperature and lesion volume at 30 s were 2.7 °C (4.1%) and 12.4 mm3 (13.8%), respectively. For Position 3, the differences were 7.3 °C (11%) and 54.7 mm3 (55.6%), respectively. The difference in lesion volume in position 2 was relatively insignificant at 6.9% and that for position 4 was almost non-existent.
Figure 8. Growth of the effective lesion volume for all ablation sites under PP and CP, during 30 s of RFCA.
3.4. The maximum endocardial, mid-myocardial, and epicardial temperatures
The maximum temperatures of the endocardium, mid-myocardium, and epicardium after 30 s of RFCA are shown in . For position 4, a difference of less than 0.1 °C was achieved for the maximum temperatures in the mid-myocardium and epicardium under PP and CP. This position was the only site where no effective surface lesion on the endocardium was generated. Transmural lesions were formed in all positions under both fluid conditions. The endocardial temperature under CP was always higher than that under PP. The temperature difference in epicardium tended to be negligible as the differences above 1% were recognized in positions 1 and 3, which also remained within an insignificant level of 2.2% and 5.5%, respectively. In contrast, the largest temperature difference under the two fluid conditions was found in the endocardium, the temperature growths of which at four positions are shown in . The temperature differences of the endocardium in positions 1 and 3 were 13.6% and 22.5%, respectively. These for positions 2 and 4 were 4.1% and 2.4%, respectively.
Figure 9. The maximum temperatures were achieved in the endocardium, midmyocardium, and epicardium for all target sites under PP and CP, at 30 s of RFCA.
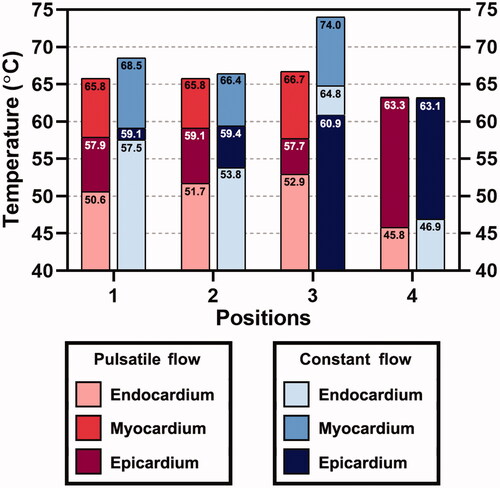
Figure 10. The maximum temperature growth in endocardium under PP and CP, during 30 s of RFCA.
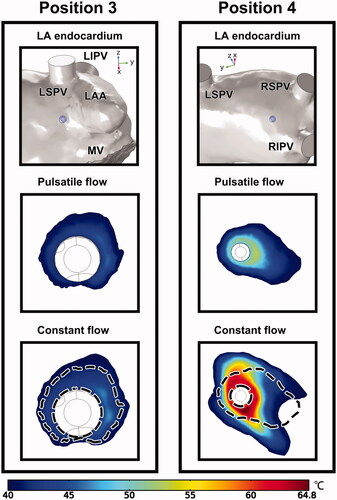
3.5. Comparison between endocardial temperature fields
Based on the aforementioned ablation outcome, the endocardial temperature fields of positions 3 and 4, as they represent a typical opposition in the similarity between PP and CP, are demonstrated in . As no effective endocardial lesion was formed at position 4, the temperature range was sorted from 40 °C instead of 50 °C, to demonstrate an appreciable area of temperature distribution for comparison. The dashed line plotted in the CP case indicates the outer boundary of the endocardial lesion under PP. It was difficult to discern the relationship between PP and CP in position 3, as the preferences for lesion growth in the two cases were significantly different. For position 4, the occupation of higher temperatures was shared by both cases. The lesion shape under CP seemed to be an enlargement of that under PP.
Figure 11. Temperature distribution of the endocardium at positions 3 and 4 under PP and CP, with the display of ablation site in LA. The dashed lines in the constant flow cases represent the outline of temperature distribution under PP. LAA: left atrial appendage; LSPV/LIPV/RSPV/RIPV: left superior/left inferior/right superior/right inferior pulmonary vein; MV: mitral valve.
3.6. Computation time of simulation
lists the total cost of computation time for all cases. Clearly, PP required a high computational time to solve the ablation procedure, whereas the time cost for CP was less than 70 min. The computation time was recorded using a 64-bit 10-core Intel Xeon E5-2660 v3 2.60 GHz processor (Intel, Santa Clara, CA).
Table 2. Total simulation time required for each position under two fluid conditions.
4. Discussion
4.1. Effect of boundary conditions and geometry
The boundary conditions for fluid dynamics in a simplified RFCA model refer to the definition of the specific blood velocity at the inlet and zero pressure at the outlet of the blood domain [Citation6–8,Citation12]. During the pretest of the current study, these settings in the anatomy-based model actually caused a large reduction in blood velocity when blood flowed into the atrium chamber, making the PTP amplitude of the average flow velocity in MV consistently smaller than that in PVs. This result did not obey the actual measurement [Citation27], thus revealing that the boundary conditions of fluid dynamics in the simplified RFCA model cannot be completely adopted by the anatomy-based model.
The ablation results of Parés et al. [Citation14] showed that there was no fluctuation in the maximum mid-myocardial temperature under PP, and the difference in the maximum blood temperature under the two fluid conditions was less than 6 °C. It is proposed that the reason for such a difference in results between the studies was the presence of four PVs as inflows that greatly disturbed the blood motion in LA. This can be proven by the greater fluctuations in blood temperature in each position, which produced a limited agreement between CP and PP, as shown in . Accordingly, it can be reasonably deduced that an irregular geometry of the atrial wall in the anatomy-based heart model mostly reduces the flow velocity. The induction of multiple inflows from different directions further intensifies the velocity variation, thus affecting the tissue (i.e., endocardium and mid-myocardium) and blood temperatures. Therefore, applying the flow profile to the outflow is promising for maintaining a certain flow velocity in a model with complex geometry.
4.2. Effect of ablation location and corresponding blood flow
From the results of this study, marked differences between CP and PP were found in positions 1 and 3, where the tissue and blood temperatures, as well as the effective lesion volume under CP, were larger than those under PP. The openings of the four PVs were located on PW [Citation32], and, in this atrium model, they were all pointed to the anterior side of the LA where the MV resided as the outflow. Therefore, the main bloodstream from the PVs preferentially flowed toward the MV. The cooling of positions 1 and 3 during RFCA largely depended on the backflow, due to the arcuate atrial wall. This is more reasonable for position 3 because none of the jets coming from the four PVs could directly contact the electrode.
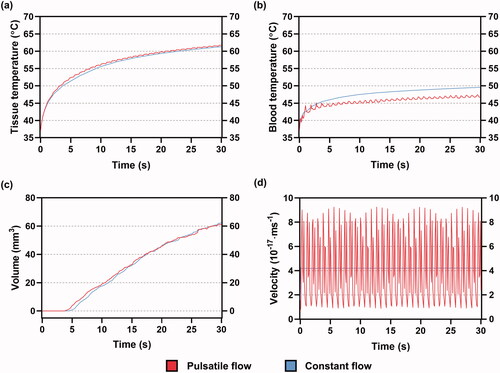
For position 1, although it was set close to the Ostia of the left unilateral PVs, this position did not seem to easily encounter the inflow from the PV as the bloodstream injected from the PV ostium will not turn immediately because of the inertia induced in the PV, which can be supported by the flow patterns from [Citation33,Citation34]. This phenomenon appeared to explain the higher tissue and blood temperatures at position 1 than at position 4. However, proves that if the ablation site is shifted to PV ostium, the difference in ablation outcomes under CP and PP can be significantly reduced with the trends approaching that in positions 2 and 4. It can also be expected that placing the electrode definitely inside PVs, which approaches the configuration of blood flow and ablation catheter in the simplified RFCA model, could further yield unnoticeable differences.
Figure 12. An additional set of simulation including the maximum (a) midmyocardial, (b) blood temperatures, (c) effective lesion volume and (d) blood velocity inspected by electrode tip when shifted to LSPV ostium under PP and CP, during 30 s of RFCA. LSPV: left superior pulmonary vein.
In contrast, positions 2 and 4 were located in or close to the main pathway of the bloodstream toward the MV. They could receive higher flow velocity more directly and easily than positions 1 and 3. These features seemed to contribute to the agreement of ablation outcome between CP and PP.
Based on the above analysis, it can be concluded that the ablation outcome is more likely to differ between CP and PP when ablation sites are placed away from the major blood flow, which cannot receive higher blood velocity frequently, as can be proven by .
4.3. Additional insight into ablation on the posterior side of LA
From the simulation results, ablation at positions 1 and 3 caused poorer cooling effects and resulted in higher temperatures in the proximal areas surrounding the ablation electrode (i.e., blood, endocardium, and mid-myocardium). Therefore, controlling the RF power output at these positions on the posterior side of LA, especially the PW in the current case, is a crucial consideration. As suggested by the ablation index (AI), used to monitor the ablation quality during clinical procedures, the recommended AI target for PW is – 280–330, which is smaller than that of AW at 400–450, and the roof or inferior wall at 380–430 [Citation35]. As AI is described by a weighted formula, incorporating RF power, contact force, and ablation duration, the recommended relation of RF powers in these positions can be predicted as PW < roof/inferior wall < AW if the contact force and time are fixed. The current results confirmed this recommendation because the ablation site with the highest possibility of causing overheating was pointed to the PW, followed by the LA roof and AW under a fixed contact force (insertion depth of 1 mm) and time (30 s).
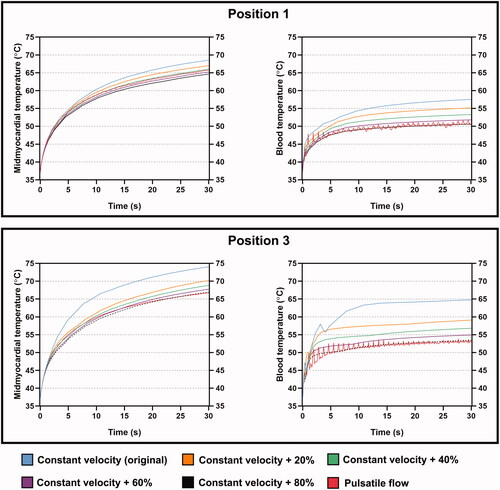
Considering that there was a noticeable reduction in blood flow velocity, thus overestimating the tissue and blood temperatures under CP at positions 1 and 3, a series of extra simulations were conducted for these positions to investigate the relationship between the mid-myocardial and blood temperatures under PP and the progressively increased velocity under CP. The original flow velocity under CP increased by 20% for each increment. Four additional cases (i.e., the increment of CP was up to 80%) of tissue and blood temperatures at positions 1 and 3 after 30 s of RFCA are shown in . The cooling effect for both mid-myocardium and blood temperatures faded with the increase in flow velocity. The increments of constant blood velocity to achieve agreement of mid-myocardium and blood temperatures at positions 1 and 3 between CP and PP after 30 s were approximately 60% (0.734 m s−1) and 80% (0.8262 m s−1), respectively. These results reflect that intracardiac positions away from the main bloodstream may require a large increase of blood velocity under CP, which approaches the peak values of the pulsatile velocity curve, to reach relatively similar ablation results under PP. The extent of velocity increase is proportional to the differences in ablation outcome between CP and PP, which are essentially determined by the local blood velocity. For a specific ablation site, it is believed that the velocity increase under CP can be theoretically estimated by simulating the trends of flow velocity under CP and PP, based on data analysis of massive intracardiac positions, thus facilitating the computing efficiency for RFCA simulation.
Figure 13. Comparison of the maximum temperature growth in midmyocardium and blood under PP and CP, with increased flow velocity at positions 1 and 3 after 30 s of RFCA.
4.4. Limitations
Although the ablation environment of the current model (i.e., construction of the thorax model and flow conditions in LA) was emulated in accordance with historical measurements [Citation17,Citation27–30], also the trends of the maximum mid-myocardial temperature at different ablation sites complied with suggested values of AI in a real-world scenario, the ablation results were short of experimental validation, which was the major limitation of this study. Therefore, the current findings are more simulation-orientated. However, the temperature distributions in tissue and blood during RFCA, referring to the main calculated parameters herein, were challenging factors for measurement. By far, no technique can perform real-time temperature monitoring inside myocardial tissue [Citation36].
Second, the proposed RFCA model was static that omitted the influence of a heartbeat on ablation outcomes. The RFCA simulation becomes a complex integration of different fields if wall motion is considered, along with the electric current, thermal distribution, fluid dynamics, and mechanical deformation of cardiac tissue due to electrode insertion, which undoubtedly requires a greater computational cost that exceeds the current case of PP. This multiphysics problem has not yet been reported in the literature. To the best of the authors’ knowledge, there is an acceptance or rejection of physical modules to simulate the RFCA procedure, including electric, thermal, fluid [Citation6–8,Citation12], and sometimes additional elastic problems [Citation7,Citation37] in a simplified model, or to consider thermal-fluid dynamics in an anatomy-based heart model that also includes wall motion. However, the thermal problem in the latter case, established by Dillon-Murphy et al. [Citation38], was modeled by defining a spheroid heat source near the LA wall, regardless of the physical structure of the ablation catheter. Such modeling of the thermal process was limited by the temperature-constant ablation, the lack of edge effect between the electrode and catheter body, and the incapability of saline irrigation.
Third, in addition to the obstruction of the electrode tip that greatly isolated the surrounding blood streams [Citation39,Citation40], there is a lack of proof of specific blood velocity at ablation positions or on the electrode surface selected where the flow velocity was significantly smaller than the inflow and outflow velocities in the current result. As the focus was on the relative differences in ablation outcomes between PP and CP to emphasize the effect of blood pulsatility, the above-mentioned influences of wall motion and unproved flow velocity were believed to cause a simultaneous change in the results, which may not disturb the overall characteristics of the two fluid conditions.
5. Conclusion
In this study, a simulation was conducted to explore the effects of intracardiac pulsatile blood flow on ablation outcomes in an anatomy-based heart model. Due to the inhomogeneous cardiac structure and the use of multiple PVs as inflows of blood, the results showed persistent fluctuations of temperature in mid-myocardium and, to a greater extent, in endocardium and blood under PP. Significant differences in tissue and blood temperatures as well as effective lesion volume between PP and CP occurred at ablation sites that were difficult to receive the main bloodstream directly, resulting in increased temperature and lesion volume under CP during RFCA. The cooling effect of these positions was largely dependent on the higher blood velocity around the peak values of the pulsatile velocity curve in each cardiac cycle. Due to the fact that the current study lacks a direct validation of ablation results, these findings are more intended to provide a point of reference to support the incorporation of flow pulsatility in RFCA simulations.
Disclosure statement
The authors declare that they have no potential conflicts of interest.
Additional information
Funding
References
- Morillo CA, Banerjee A, Perel P, et al. Atrial fibrillation: the current epidemic. J Geriatr Cardiol. 2017;14(3):195–203.
- Wattigney WA, Mensah GA, Croft JB. Increased atrial fibrillation mortality: United States, 1980–1998. Am J Epidemiol. 2002;155(9):819–826.
- Joseph JP, Rajappan K. Radiofrequency ablation of cardiac arrhythmias: past, present and future. QJM. 2012;105(4):303–314.
- Berjano EJ. Theoretical modeling for radiofrequency ablation: state-of-the-art and challenges for the future. Biomed Eng Online. 2006;5:24.
- González-Suárez A, Pérez JJ, Irastorza RM, et al. Computer modeling of radiofrequency cardiac ablation: 30 years of bioengineering research. Comput Methods Programs Biomed. 2022;214:106546.
- González-Suárez A, Berjano E, Guerra JM, et al. Computational modeling of open-irrigated electrodes for radiofrequency cardiac ablation including blood motion-saline flow interaction. PLOS One. 2016;11(3):e0150356.
- Petras A, Leoni M, Guerra JM, et al. A computational model of open-irrigated radiofrequency catheter ablation accounting for mechanical properties of the cardiac tissue. Int J Numer Method Biomed Eng. 2019;35(11):e3232.
- González-Suárez A, Pérez JJ, Berjano E. Should fluid dynamics be included in computer models of RF cardiac ablation by irrigated tip electrodes? Biomed Eng Online. 2018;17(1):43.
- Pérez JJ, González-Suárez A, Berjano E. Numerical analysis of thermal impact of intramyocardial capillary blood flow during radiofrequency cardiac ablation. Int J Hyperthermia. 2018;34(3):243–249.
- Yan S, Wu X, Wang W. A simulation study to compare the phaseshift angle radiofrequency ablation mode with bipolar and unipolar modes in creating linear lesions for atrial fibrillation ablation. Int J Hyperthermia. 2016;32(3):231–238.
- Yan S, Wu X, Wang W. Theoretical and experimental analysis of amplitude control ablation and bipolar ablation in creating linear lesion and discrete lesions for treating atrial fibrillation. Int J Hyperthermia. 2017;33(6):608–616.
- Singh S, Melnik R. Fluid–structure interaction and non-Fourier effects in coupled electro-thermo-mechanical models for cardiac ablation. Fluids. 2021;6(8):294.
- Berkmortel C, Avari H, Savory E. Computational modelling of radiofrequency cardiac ablation to study the effect of cooling on lesion parameters. 2018 Canadian Society for Mechanical Engineering (CSME) International Congress; 2018 May 27–30; Toronto, ON, Canada; 2018. p. 1–5.
- Parés C, Berjano E, González-Suárez A. Effect of intracardiac blood flow pulsatility during radiofrequency cardiac ablation: computer modeling study. Int J Hyperthermia. 2021;38(1):316–325.
- Han S, Hwang C. How to achieve complete and permanent pulmonary vein isolation without complications. Korean Circ J. 2014;44(5):291–300.
- Verma A, Jiang C-y, Betts TR, et al. Approaches to catheter ablation for persistent atrial fibrillation. N Engl J Med. 2015;372(19):1812–1822.
- Gu K, Yan S, Wu X. Effect of anisotropy in myocardial electrical conductivity on lesion characteristics during radiofrequency cardiac ablation: a numerical study. Int J Hyperthermia. 2022;39(1):120–133.
- Calkins H, Kuck KH, Cappato R, et al. 2012 HRS/EHRA/ECAS expert consensus statement on catheter and surgical ablation of atrial fibrillation: recommendations for patient selection, procedural techniques, patient management and follow-up, definitions, endpoints, and research trial design. Europace. 2012;14(4):528–606.
- Teng C. A 3-dimensional in-silico test bed for radiofrequency ablation catheter design evaluation and optimization [master's thesis]. San Luis Obispo, CA: California Polytechnic State University; 2019.
- Proietti R, Santangeli P, Di Biase L, et al. Comparative effectiveness of wide antral versus ostial pulmonary vein isolation: a systematic review and meta-analysis. Circ: Arrhythmia Electrophysiol. 2014;7(1):39–45.
- Gu K, Wang Y, Yan S, et al. Modeling analysis of thermal lesion characteristics of unipolar/bipolar ablation using circumferential multipolar catheter. Appl Sci. 2020;10(24):9081.
- Otani T, Al-Issa A, Pourmorteza A, et al. A computational framework for personalized blood flow analysis in the human left atrium. Ann Biomed Eng. 2016;44(11):3284–3294.
- Bhaskaran A, Barry MA, Pouliopoulos J, et al. Circuit impedance could be a crucial factor influencing radiofrequency ablation efficacy and safety: a myocardial phantom study of the problem and its correction. J Cardiovasc Electrophysiol. 2016;27(3):351–357.
- Rossmann C, Motamarry A, Panescu D, et al. Computer simulations of an irrigated radiofrequency cardiac ablation catheter and experimental validation by infrared imaging. Int J Hyperthermia. 2021;38(1):1149–1163.
- Wang Y, Qiao Y, Mao Y, et al. Numerical prediction of thrombosis risk in left atrium under atrial fibrillation. Math Biosci Eng. 2020;17(3):2348–2360.
- Valen-Sendstad K, Mardal KA, Mortensen M, et al. Direct numerical simulation of transitional flow in a patient-specific intracranial aneurysm. J Biomech. 2011;44(16):2826–2832.
- Fyrenius A, Wigström L, Ebbers T, et al. Three dimensional flow in the human left atrium. Heart. 2001;86(4):448–455.
- Nishimura RA, Miller FA, Callahan MJ, et al. Doppler echocardiography: theory, instrumentation, technique, and application. Mayo Clin Proc. 1985;60(5):321–343.
- Mottram PM, Marwick TH. Assessment of diastolic function: what the general cardiologist needs to know. Heart. 2005;91(5):681–695.
- Fluckiger JU, Goldberger JJ, Lee DC, et al. Quantification of left atrial flow velocity distribution in atrial fibrillation using 4D flow MRI. J Cardiovasc Magn Reson. 2013;15(S1):261.
- Oliveira D, Srinivasan J, Espino D, et al. Geometric description for the anatomy of the mitral valve: a review. J Anat. 2020;237(2):209–224.
- Porres DV, Morenza OP, Pallisa E, et al. Learning from the pulmonary veins. Radiographics. 2013;33(4):999–1022.
- D’Alessandro N, Masci A, Andalo A, et al. Simulation of the hemodynamic effects of the left atrial appendage occlusion in atrial fibrillation: preliminary results. Comput Cardiol. 2020;47:1–4.
- Cheng Y, Qiao A, Yang Y, et al. Numerical simulation of hemodynamics in two models for total anomalous pulmonary venous connection surgery. Front Physiol. 2020;11:1–8.
- Wang YJ, Tian Y, Shi L, et al. Pulmonary vein isolation guided by moderate ablation index targets combined with strict procedural endpoints for patients with paroxysmal atrial fibrillation. J Cardiovasc Electrophysiol. 2021;32(7):1842–1848.
- Zaltieri M, Massaroni C, Cauti FM, et al. Techniques for temperature monitoring of myocardial tissue undergoing radiofrequency ablation treatments: an overview. Sensors. 2021;21(4):1453.
- Yan S, Gu K, Wu X, et al. Computer simulation study on the effect of electrode-tissue contact force on thermal lesion size in cardiac radiofrequency ablation. Int J Hyperthermia. 2020;37(1):37–48.
- Dillon-Murphy D, Marlevi D, Ruijsink B, et al. Modeling left atrial flow, energy, blood heating distribution in response to catheter ablation therapy. Front Physiol. 2018;9(1757):1713–1757.
- Alhamad IM, Ahmed WK, Ali HZ. Boosting teaching experience in mechanical engineering courses using additive manufacturing technologies. 2019 Advances in Science and Engineering Technology International Conferences (ASET); 2019 Mar 26–Apr 10; Dubai, United Arab Emirates; 2019. p. 1–6.
- Rajput P, Khan S, Arya S, et al. Investigations of nutrient flow through microfluidic channels for medical applications. Int J Sci Tech Adv. 2015;1(3):113–117.