
Abstract
Objective
The addition of hyperthermia in the treatment of intact breast cancer with the aim to improve local response is currently in a research phase. First, optimal hyperthermia devices need to be developed, for which a diverse, anatomically and pathologically accurate set of patient models is necessary.
Methods
To investigate the effects of inter-subject variations on hyperthermia treatment plans, we generated a repository of 22 anatomically and pathologically diverse patient models based on MR images of breast cancer patients. Hyperthermia treatment plans were generated for the 22 models using a generic theoretical phased array hyperthermia applicator.
Results
Good temperature coverage was achieved in the vast majority of the models, with median values for T10 = 43.5°C (41.9–43.8°C), T50 = 42.5°C (41.3–43.3°C), and T90 = 41.3°C (39.8–42.6°C) under the condition that the maximum temperature increase in the patient is limited to 44°C.
Conclusions
For future development of hyperthermia devices and treatment methods, a repository with a sufficiently large number of representative patient models, such as the one provided in this study, should be used to ensure applicability to a wide variety of patients. This repository is therefore made publicly available.
Introduction
Hyperthermia is an effective therapy in treating recurrent breast cancer as an adjuvant to radiotherapy [Citation1,Citation2]. Superficial hyperthermia combined with radiotherapy has been effective in locally recurrent breast cancer and postoperative breast cancer after previous irradiation in the case of tumors extending up to 4 cm below the skin [Citation3,Citation4]. Also, as an adjuvant to chemotherapy, there is promising evidence that hyperthermia improves clinical outcome [Citation5,Citation6]. Research toward devices that can effectively treat tumors in the intact breast is ongoing and mainly theoretical or at an early clinical stage [Citation7–13]. Also, hyperthermia treatment planning and optimization of heating tumors located in the breast is still in an investigative stage [Citation14].
For the development of hyperthermia devices and delivery of treatments, accurate knowledge of the patient anatomy, as well as of the tumor location and its characteristics, is needed. This is also valid for the development of accurate treatment planning workflows. The breast region is an inhomogeneous mixture of fibroglandular and fatty tissues [Citation15]. Three-dimensional (3D) imaging is mainly performed using magnetic resonance imaging (MRI) due to its superior soft-tissue contrast compared to X-ray computed tomography (CT). As manually segmenting breast tissues is a difficult and impractical task, several automated and semi-automated methods have been proposed and used for breast tissue segmentation [Citation16–18]. The latter is important as it is mandatory to implement routine breast tissue segmentation for tumor-targeted hyperthermia treatment modeling to apply radiotherapy or adjuvant chemotherapy plus hyperthermia to the intact breast.
Earlier attempts to model a hyperthermia treatment device for breast hyperthermia using both high-quality anatomical and electromagnetic information of the normal tissue and the cancerous tissue are limited. Wu et al. used a simple geometric equivalent of a breast with layers of skin, fat, muscle, and tumor tissue [Citation7]. Curto et al. used a similar geometric equivalent consisting entirely of fibroglandular tissue and a skin layer [Citation11,Citation12]. Baskaran and Arunachalam created a geometric equivalent breast and tumor model by analyzing the data of breast cancer patients [Citation13]. While, on the one hand, they did differentiate tumorous from healthy tissue, they did not discriminate fatty from fibroglandular tissue in the breast. Zastrow et al. used anatomically correct healthy volunteer models from their earlier published database [Citation16], ignoring the impact of the tumorous tissue properties in the target region [Citation8]. Nguyen et al. used anatomically correct healthy volunteer models with breasts of different fibroglandular content. The tumor tissue was assigned as a 1 cm3 cubic target with different material properties [Citation10]. In the European Society of Hyperthermic Oncology (ESHO) benchmarking guidelines, two accurate breast cancer patients were provided, based on real anatomical and pathological data [Citation19]. Hence, current research on intact breast hyperthermia has been limited to a small number of evaluated models, and the models are often partial or simplified versions of the real patient scenario.
An additional limitation of previous studies is that the anatomical variations of the breast and pathological variations of the breast cancers are not widely covered. Women with a higher relative amount of fibroglandular tissue are linked with a higher risk of developing breast cancer [Citation20]. But the amount of fibroglandular tissue in the breast can vary immensely, and the breast is usually classified into four categories (I – almost entirely fat, II – scattered fibroglandular tissue, III – heterogeneous fibroglandular tissue, IV – extreme fibroglandular tissue) [Citation21], based on mammographic imaging. In breast MRI, there is, in general, no consensus on how breast density should be quantified [Citation22]. However, the same breast composition categories applied in mammography are commonly used. In terms of tumor characteristics, the vast majority (62%) of breast tumors are diagnosed in the upper outer quadrant [Citation23]. But tumors in the upper outer quadrant are also linked with a more favorable survival advantage than other tumor locations [Citation24]. Solid breast tumors are staged based on their longest spatial dimension. While a higher tumor stage is correlated with less favorable survival, also the tumor shape can vary vastly and can determine the aggressiveness of a tumor [Citation25]. Therefore, there is a need for a repository that includes a representative variety of models.
Besides breast imaging repositories [Citation26] and whole-body models [Citation27], two high-quality breast model repositories are currently available [Citation16,Citation28], with one containing models of nine healthy volunteers and the other containing models of one cancer patient and five healthy volunteers, as well as an axillary model repository [Citation29]. There is a lack of realistic tumor position, size, and shape. Knowing the position, size, and shape of the tumor is important for properly targeting the energy. It is also known that there is a clear difference in tissue properties between cancerous and normal breast tissue [Citation30,Citation31].
Therefore, the aim of the current study is to develop a large repository of anatomically accurate breast cancer patient models for the development of breast cancer hyperthermia devices and treatment planning. Here, we used MR images acquired from breast cancer patients to generate breast patient models. The models are used for treatment plan generation with a generic hyperthermia breast applicator, and the variations in treatment planning metrics are evaluated.
Materials and methods
Patient population and imaging
A retrospective single-institute study was conducted at the Erasmus MC Cancer Institute, Rotterdam, The Netherlands. Twenty-five breast cancer patients undergoing neoadjuvant chemotherapy were included from October 2015 and October 2017. Approval from the medical ethics committee was obtained before the start of the study (MEC 2015-647). Patients were only included after informed consent and if the lesion was entirely inside the breast tissue (tumor stage < cT4). For the current study, and after receiving approval from the medical ethics committee (MEC-2019-0531), fully anonymized contrast enhanced MRI data of the 25 breast cancer patients were evaluated to generate 3D electromagnetic breast models. 3D models were generated from the available 3D Fat-suppressed T1-weighted Gradient Echo sequences with the following MRI parameters: fl3d sequence, TE = 6.02 ms, TR = 12.20 ms, FOV 360 mm, slice thickness 1.0 mm, flip angle 10°, acquisition size 448 × 380 × 144, reconstruction matrix size 512 × 512 × 144, and averaging 1 on a 1.5 T Siemens Avanto system; and VIBRANT sequence, TE = 2.48 ms, TR = 5.23 ms, FOV 340 mm, slice thickness 2.2 mm, flip angle 12°, acquisition size 512 × 360 × 82, reconstruction matrix size 512 × 512 × 82, and averaging 1 on a 1.5 T GE Signa HDxt system. The MRI device used for each patient was chosen based on clinical routine.
Tissue discretization method
From the 25 available breast cancer patient datasets, the quality, or used imaging sequence, of three datasets did not allow for performing accurate tissue segmentation. This resulted in 22 patients eligible for 3D models generation. Skin, thoracic bones, pectoralis major muscle, and the lesion were manually contoured in the dedicated medical image visualization and segmentation software environment (MIM Software Inc. – Cleveland, OH). Tissue contouring was performed by a radiotherapy technician (M. N. D. M.) with more than 5 years of experience in contouring. The contoured models were independently validated by a radiation oncologist (M. F). For separating the remaining tissue volume inside the breast in fatty and fibroglandular tissue, an automatic method based on the voxel intensity, similar to those described by Zastrow et al. [Citation8] and Omer et al. [Citation18], was used.
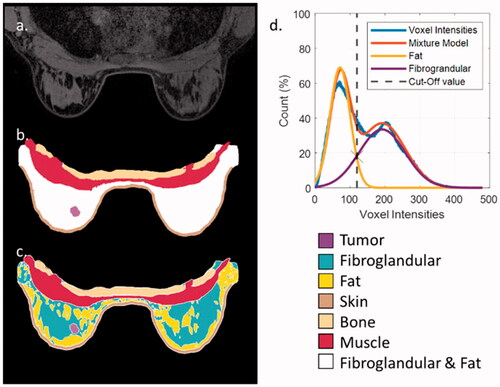
A two-component Gaussian mixture model distribution (GMM) was fitted on the histogram of the voxel intensities of the contrast-enhanced MR images from the unassigned tissue in the breast (). Since fibroglandular tissue appears brighter due to the contrast injection, the component with the highest mean value corresponds to the fibroglandular breast tissue, while the other component corresponds to the fatty tissue. Since, in most instances, the two GMM components were overlapping, a cutoff value was defined at the intersection of the two components (). All voxels of the unassigned breast tissue with intensities higher than the cutoff value were assigned as fibroglandular tissue, while all other voxels were assigned as fatty tissue.
Figure 1. From patient imaging to patient model (patient 10): (a) an axial slice of the patient MRI; (b) the segmentations on the same slice of bone, muscle, skin, tumor, and fibroglandular-fat mixture; (c) the same segmentation on the same slice, with the automated division of the fibroglandular-fat mixture into two distinct tissue entities; (d) the two-component GMM that lead to the selected cutoff value in the fibroglandular and fat mixture.
3D model generation
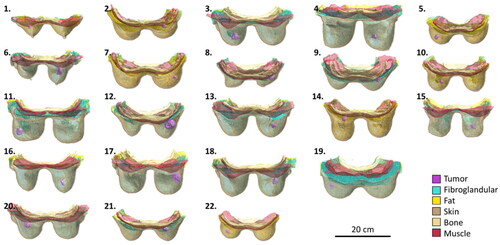
After the discretization of tissues, all labeled voxels were used to generate 3D triangular surface meshes corresponding to each separate tissue. For the generation of the surface meshes, a constrained Laplacian smoothing algorithm was used to remove staircasing artifacts caused by the imaging voxel grid. After that, a second algorithm was used to minimize surface intersections. In the final surface mesh, each triangular surface mesh has a minimum edge length of 0.75 mm. The 3D model generation and smoothing was performed in Sim4Life v6.2 (Zurich MedTech AG, Zurich, Switzerland). Each separate tissue was saved as an STL-file. All 22 models are presented in . Models 4 and 20 correspond to Venus, and Luna presented in [Citation19], respectively.
Figure 2. Top 3D view of all 22 generated breast cancer models. All models are on the same scale.
Patient classification
For breast density classification, we used the categories proposed in the Breast Imaging Reporting and Data System (BI-RADS) [Citation21]. As there is no consensus on how these categories are defined based on 3D MRI data [Citation22], we used the following classification method:
almost entirely fat: <10% of the inner breast is composed of fibroglandular tissue;
scattered fibroglandular tissue: ≥10% and <20% of the inner breast is composed of fibroglandular tissue;
heterogeneous fibroglandular tissue: ≥20% and <40% of the inner breast is composed of fibroglandular tissue;
extreme fibroglandular tissue: ≥40% of the inner breast is composed of fibroglandular tissue.
For the classification of tumor stage, we used the TNM classification (8th edition) [Citation32], which is based on the longest dimension of the tumor in any orientation (for T1, ≤20 mm; for T2, >20 mm & ≤50 mm; for T3, >50 mm). The longest dimension was measured by a digital ruler after tumor delineation.
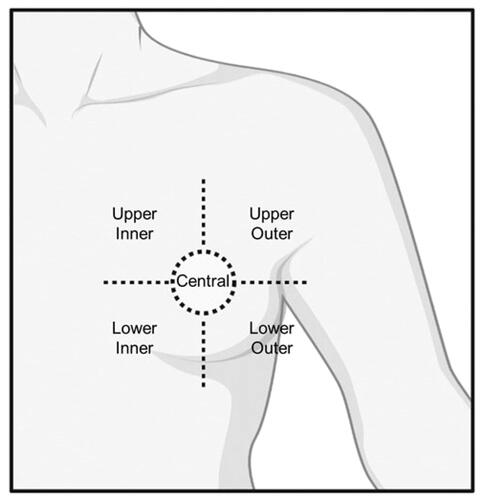
For tumor position classification within the breast, five regions were considered: Upper Outer, Upper Inner, Lower Outer, Lower Inner, and Central position (). In case a tumor was between two regions, the tumor position was categorized based on the position of the center of mass of the tumor.
Figure 3. Graphic representation of the tumor position classifications. Five distinct tumor positions are assumed: upper outer; upper inner; lower outer; lower inner; and central tumor position.
Besides the classifications mentioned above, the laterality of the tumor, total breast volume, tumor volume, and tumor center to skin distance were documented for each of the 22 patients. A summary of all characteristics is presented in .
Table 1. Summary of patient and tumor characteristics.
Hyperthermia device
For the hyperthermia treatment, a theoretical hyperthermia device operating at 434 MHz as defined in the ESHO benchmarks was assumed [Citation19]. The theoretical hyperthermia device consisted of 12 half-wavelength dipole antennas distributed over two rings of 20 cm diameter (). The rings were 3 cm apart from each other and rotated 30° in respect to each other so that the two antenna rings are nested. As a matching medium, a cylindrical water-bolus containing deionized water was defined in such a way, that all antennas are completely submerged in deionized water, and a constant distance of 10 mm from the water–air barrier is maintained.
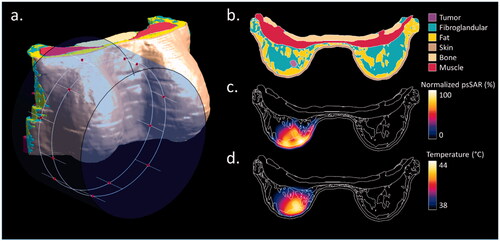
Figure 4. Treatment planning setup and results in a single patient (Patient 10). (a) The water bolus and dipole antennas positions (red dots) distributed along two rings around the breast tissue; (b) tissue discretization in an axial slice passing through the center of the tumor; (c) normalized 1 g averaged SAR distribution on the same slice after THQ optimization; (d) steady-state temperature distribution on the same slice.
Tissue properties
For the electromagnetic property assignment of each of the six segmented tissues (bone, fat, fibroglandular tissue, muscle, skin, tumor), we applied the properties proposed in the ESHO benchmarks for the case of breast tissue and applied an electromagnetic frequency of 434 MHz. All thermal tissue properties were assigned, assuming the tissues are under thermal stress, as proposed in the ESHO benchmarks. The tissue properties are listed in [Citation19].
Table 2. Assigned physical, electrical, and thermal tissue properties.
Simulation and optimization
To calculate the electromagnetic field distribution of each dipole antenna, we used a finite-difference time-domain (FDTD) solver in Sim4Life v6.2 (Zurich MedTech AG, Zurich, Switzerland). A 1.5-mm cubic grid was used in the whole model. For each dipole antenna, a separate simulation was performed. In each simulation, one dipole was excited by a 50 Ω source with a 1 V sinusoidal signal of 20 periods at the operating electromagnetic frequency of 434 MHz, while the other antenna were connected to 50 Ω loads. The resulting electric field per antenna was normalized to 1 W of irradiated power. The final electric field distribution was then calculated by superpositioning the electric fields generated by each antenna.
For focusing the specific absorption rate (SAR) deposition toward the tumor, the phase and power amplitude of each antenna was optimized based on the target to hotspot ratio (THQ) using the VEDO treatment planning software [Citation33]. The hyperthermia target volume (HTV) was defined as the tumor delineation without additional margins.
For the calculation of the temperature distribution, a steady-state solution of the Pennes bioheat equation was calculated using an FDTD solver in Sim4Life v6.2 (Zurich MedTech AG, Zurich, Switzerland). A 1.5-mm cubic grid was used in the whole model. An initial temperature of 37 °C was assumed for all patient tissues, while the surrounding air temperature was set to 20 °C. The water bolus temperature was kept steady at 30 °C using a mixed boundary condition to mimic a temperature-controlled water bolus, as is common in hyperthermia treatments. The heat transfer coefficient between the water bolus and the patient skin was set to 40 W/m2 K, and the heat transfer coefficient between air and the patient skin was set to 6 W/m2 K [Citation19]. The total applied power was scaled such that the maximum steady-state temperature reached in the patient would be 44 °C. In the cases where the low water bolus temperature was limiting the intratumoral temperature, the water bolus temperature was elevated from 30 °C to 40 °C [Citation34].
Evaluation
For the treatment plan evaluation, THQ and the target coverage parameters corresponding to the volume percentage of the HTV covered by 25% (TC25), 50% (TC50), and 75% (TC75) iso-SAR contour were used as defined in the ESHO benchmarks [Citation19]. The temperature was evaluated using the T10, T50, and T90 parameters, corresponding to the temperatures achieved in at least 10%, 50%, and 90% of the target volume, respectively.
Results
Treatment planning results in all patient data
shows the results of a single patient from the repository (Patient 10) as an example. In , the positioning of the theoretical applicator and water bolus are visualized. shows an axial slice of the patient model, passing through the center of the tumor volume. shows the normalized SAR distribution averaged over 1 g of tissue in the same slice after optimizing the antenna settings to achieve the highest THQ value, i.e., 0.73, which resulted in a TC50 value of 66%. shows the steady-state temperature distribution on the same slice, with a water bolus temperature of 30 °C. The T10, T50, and T90 values were 43.3 °C, 42.7 °C, and 41.8 °C, respectively.
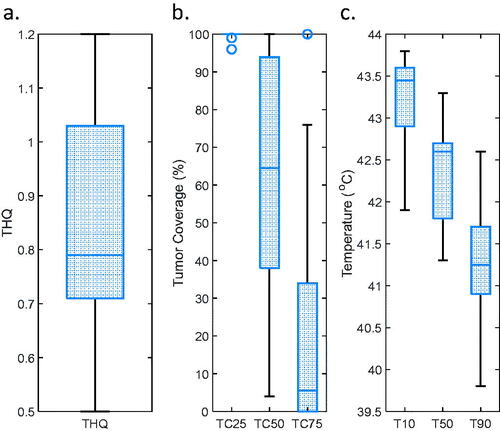
summarizes treatment planning results for all patients in the repository. The THQ varied between 0.50 and 1.20, with a median of 0.79 (). TC25 varied between 96% and 100%, with a median of 100%. TC50 varied between 4% and 100%, with a median of 65%. TC75 varied between 0% and 100%, with a median of 6% (). In terms of temperature distribution, the maximum temperature in healthy tissue reached the maximum allowed temperature of 44 °C in 11 cases. The median maximum healthy tissue temperature was 44.0 °C with a range of 42.9–44.0 °C. Water bolus temperature was set to 40 °C in two patients (12 and 22) where the water bolus temperature was affecting the intratumoral temperature, i.e., because the tumor was very close to the skin. In the other 19 patients, the water bolus temperature was kept at 30 °C. The median T10, T50, and T90 values () were 43.5 °C, 42.6 °C, and 41.3 °C, respectively. In one patient with a very superficial tumor, the temperature increase in the tumor was limited by the maximum water bolus temperature, leading to a T90 value barely just below 40 °C (39.8 °C). In general, an adequate temperature (T90 > 40 °C) can be reached in all but one of the patients in the repository.
Figure 5. Boxplots of the hyperthermia treatment planning parameters on all patients; (a) the THQ; (b) the TC25, TC50, and TC75; (c) the T10, T50, and T90.
Influence of patient-specific characteristics on treatment planning outcome
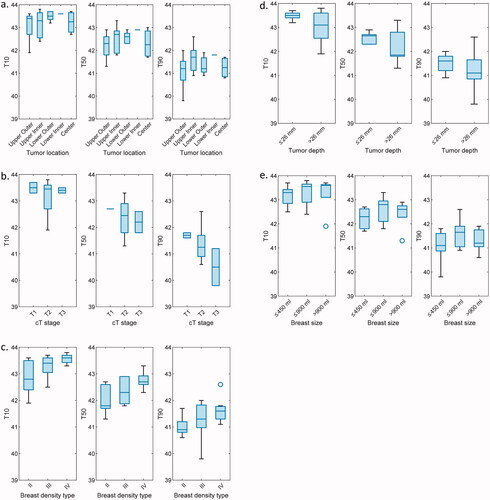
In , the treatment planning heating variables T10, T50, and T90 for different breast and tumor characteristics are presented. It can be observed that regarding the tumor location (), slightly lower intratumoral temperatures are achieved for tumors located in the upper outer breast, with however no notable difference between any of the locations. Note that the lower inner tumor location group contains only a single patient model. In terms of tumor stage (), it can be observed that good intratumoral temperatures can be achieved independently of tumor stage. Note that the T1 and T3 tumor stage groups each contain only two individual patient models. T10 and T50 values are comparable for the three groups, while a gradual decrease of T90 can be observed when the tumor stage increases. Regarding the breast density type (), there is an indication that slightly better temperatures can be reached for breasts with lower fat content. Regarding the tumor depth (), marginally lower intratumoral temperatures were observed for deep-seated tumors (with the median tumor center to skin distance of 26 mm as a cutoff value). Finally, regarding the breast volume, higher median temperatures were reached in averagely sized breasts (between 450 ml and 900 ml), and lower median temperatures were reached in small breasts (below 450 ml).
Figure 6. Evaluation of the tumor temperature volume metrics (T10, T50, T90) for different anatomical and tumor characteristics: (a) between different tumor location groups; (b) between different tumor stage groups; (c) between different breast density types; (d) between deep and superficial tumor locations; (e) between different breast sizes (≤450 ml; >450 ml & ≤900 ml; >900 ml).
Discussion
We have developed a breast tumor patient model repository with 22 realistic breast cancer patient models. This repository provides a unique platform to advance the field of intact breast hyperthermia by facilitating an objective comparison of the heating quality for different hyperthermia devices using the same set of patient-derived models.
There are currently some breast model repositories available; however, they contain a limited amount of models, limited anatomical detail, and are mainly based on healthy volunteers rather than patients with breast tumor in situ. Therefore, this is the first study presenting a relatively large pool of intact breast patient models containing healthy and tumor tissue. As intact breast hyperthermia is still at an investigative stage, it is important to have a large repository of realistic and representative models on which device development and treatment planning software can be based [Citation35]. While other repositories focusing on microwave imaging have reported single-breast models, in this study, we offer a wide range of models, including both the right and left breast area, the ribs, sternum, and surrounding muscle as a single model. In this way, the combination of all separate models can be used to evaluate and generate realistic medical devices, which can be more rapidly translated into their clinical application.
In all earlier studies for intact breast hyperthermia, a lower amount of anatomical and pathological variations was evaluated. The study with the highest number of evaluated breast models was Zastrow et al., where four patient models were used [Citation8]. Device development and evaluation on such small samples sizes are liable to be patient-specific and hence not widely applicable in practice. Therefore, a larger amount of patient models should be evaluated. Looking at hyperthermia treatment evaluation for other treatment sites, Drizdal et al. have compared the heating ability of a dedicated head and neck device with a superficial hyperthermia applicator in 24 patient models with different pathologies [Citation36], which is close to the number of patients provided in the current study. Furthermore, early clinical trials evaluate typically results from around 10 to a maximum of 20 patients. As the current repository contains 22 patient models, we can claim this is a sufficiently large repository size for preclinical device and treatment planning evaluation and development. However, to effectively reflect all tumor pathologies that might be encountered in the future clinical application of hyperthermia of tumors in the intact breast, not only the size of the repository is important, but also its anatomical and pathological variability.
The models generated in this study enable a reliable and representative evaluation of the features and quality of a hyperthermia device designed to heat tumors in the intact breast by offering a large variability of anatomical and pathological characteristics (). In terms of anatomical characteristics, the breast models range from small volumes (154 ml) to large volumes (1336 ml) and a mean value (591 ml), close to what is found in other studies [Citation37]. Another important anatomical characteristic, the breast density, is well covered, with three out of four breast density groups included in this database. The missing type I (almost entirely fat) breast density category is known to have a significantly lower risk of developing breast cancer [Citation38], and hence is normal not to appear in such a database. Finally, the wide differentiation in breast shapes is visible in .
In terms of pathological characteristics, all the repository models hold important variations in terms of tumor size, tumor location, and tumor depth. In terms of tumor size, the tumor volumes vary from very small 1.8 ml to 39 ml. The vast majority of tumors are stage T2 (20–50 mm) tumors (18/22), but both T1 (<20 mm; 2/22) and T3 (>50 mm; 2/22) staged tumors are present in this repository. In terms of tumor location, the current repository covers all the areas of the breast, with the most common tumor site being the upper outer region, as this is also the region where most primary tumors tend to appear [Citation23]. In terms of tumor depth, the tumor sites cover all ranges from superficially positioned tumors to tumors very close to the breast base, close to the chest wall. This is evident in the large variation of tumor center to skin distance, varying from 12 to 43 mm, with an average of 26 mm. This is an important parameter in the development of hyperthermia devices since not all applicator designs can reach deep-seated tumors and conform the energy to the tumor. It is worth mentioning that most superficial hyperthermia devices can only treat tumors up to a depth of at maximum 15–40 mm [Citation39], while in the current study 9/23 models have a maximum tumor depth of > 40 mm.
In the treatment planning results, we have shown that when applying hyperthermia using a generic theoretical phased-array microwave hyperthermia device, we can achieve good temperature coverage in the vast majority of models, with T10 = 43.5 °C (41.9–43.8 °C), T50 = 42.5 °C (41.3–43.3 °C), and T90 = 41.3 °C (39.8–42.6 °C) reached when the maximum temperature in the patient does not exceed 44 °C. These results show that reaching hyperthermia temperatures in the tumor is feasible. A deeper look into the variation between different patients showed that no patient characteristic was associated with improvement or worsening of the heating ability of the tumor. One reason might be that the repository is not large enough. But the most apparent reason is that there are many factors concerning the breast anatomy and pathology that play a role in the heating ability of the tumor, so a repository would have to be unrealistically large to fit all sizes, shapes, and constitutions. In this way, we can stress that in the design and development of novel hyperthermia devices for the intact breast, an evaluation of a multitude of patient models, such as in the current study, is necessary to assure the efficiency of a wider patient population. This is also in line with the generally accepted amount of patients used for phase I feasibility and dose-finding studies.
Other repositories have a further division of fat and fibroglandular tissues into subgroups, based on electric property variations, but their aim is in microwave imaging of the breast rather than RF heating, where accurate discretization between different tissues is important due to the higher variation of dielectric properties at higher frequencies [Citation16]. This paper has followed the ESHO benchmarking guidelines for tissue differentiation, where only fibroglandular and fat tissues are assumed [Citation19]. On the one hand, it has been shown that there is a non-negligible difference in the predicted SAR patterns between patient models and homogeneous phantom-based surrogate models [Citation35]. But, on the other hand, very detailed tissue segmentation does not lead to significant differences in treatment outcomes [Citation40].
Conclusion
In this study, we have generated 22 accurate and representative breast models for patients with breast cancer in situ based on anonymized MR images of patients. Treatment plans were generated for the patient models based on the ESHO benchmarking guidelines, using the recommended generic applicator and THQ optimization. The treatment planning results show that hyperthermia treatment planning with phased array antennas can lead to adequate heating in the tumor area without overheating healthy tissue. The treatment planning results do not seem to depend on a single treatment planning parameter but rather on the patient-specific breast anatomy and pathology. To accurately evaluate the performance of hyperthermia applicators and treatment planning techniques for all potential patients, we postulate that a sufficiently large and diverse patient population, like the one provided, is needed. In future research, the evaluation of novel breast cancer hyperthermia treatment applications should be evaluated on a wide variety of patient models to ensure feasibility for the majority of patients. Therefore, the surface- and voxel-based versions of the repository models are available online at the following website: http://www.itis.ethz.ch/virtual-population/regional-human-models/BTPM-repository.
Acknowledgments
The authors thank Iva VilasBoas Ribeiro for her technical support in the tissue segmentation process and Jonathan Rincon Soto for his support to generate the Gaussian mixture model distribution (GMM).
Disclosure statement
No potential conflict of interest was reported by the authors.
Additional information
Funding
References
- Group ICH, Vernon CC, Hand JW, et al. Radiotherapy with or without hyperthermia in the treatment of superficial localized breast cancer: results from five randomized controlled trials. Int J Radiat Oncol: Biol Phys. 1996;35(4):731–744.
- Datta NR, Puric E, Klingbiel D, et al. Hyperthermia and radiation therapy in locoregional recurrent breast cancers: a systematic review and Meta-analysis. Int J Radiat Oncol: Biol Phys. 2016;94(5):1073–1087.
- Van Der Zee J, De Bruijne M, Mens JWM, et al. Reirradiation combined with hyperthermia in breast cancer recurrences: overview of experience in Erasmus MC. Int J Hyperthermia. 2010;26(7):638–648.
- Bakker A, Valverde CPT, van Tienhoven G, et al. Post-operative re-irradiation with hyperthermia in locoregional breast cancer recurrence: temperature matters. Radiother Oncol. 2022;167:149–157.
- Zagar TM, Oleson JR, Vujaskovic Z, et al. Hyperthermia for locally advanced breast cancer. Int J Hyperthermia. 2010;26(7):618–624.
- Loboda A, Smolanka I Sr, Orel VE, et al. Efficacy of combination neoadjuvant chemotherapy and regional inductive moderate hyperthermia in the treatment of patients with locally advanced breast cancer. Technol Cancer Res Treat. 2020;19:153303382096359.
- Wu L, McGough RJ, Arabe OA, et al. An RF phased array applicator designed for hyperthermia breast cancer treatments. Phys Med Biol. 2006;51(1):1–20.
- Zastrow E, Hagness SC, Van Veen BD. 3D computational study of non-invasive patient-specific microwave hyperthermia treatment of breast cancer. Phys Med Biol. 2010;55(13):3611–3629.
- Vujaskovic Z, Kim DW, Jones E, et al. A phase I/II study of neoadjuvant liposomal doxorubicin, paclitaxel, and hyperthermia in locally advanced breast cancer. Int J Hyperthermia. 2010;26(5):514–521.
- Nguyen PT, Abbosh A, Crozier S. Microwave hyperthermia for breast cancer treatment using electromagnetic and thermal focusing tested on realistic breast models and antenna arrays. IEEE Trans Antennas Propagat. 2015;63(10):4426–4434.
- Curto S, Prakash P. Design of a compact antenna with flared groundplane for a wearable breast hyperthermia system. Int J Hyperthermia. 2015;31(7):726–736.
- Curto S, Garcia-Miquel A, Suh M, et al. Design and characterisation of a phased antenna array for intact breast hyperthermia. Int J Hyperthermia. 2018;34(3):250–260.
- Baskaran D, Arunachalam K. Design and experimental verification of 434 MHz phased array applicator for hyperthermia treatment of locally advanced breast cancer. IEEE Trans Antennas Propagat. 2021;69(3):1706–1715.
- Baskaran D, Arunachalam K. Optimization techniques for hyperthermia treatment planning of breast cancer: a comparative study. In Proceedings of the 2019 IEEE MTT-S International Microwave and RF Conference (IMaRC) December 13–15, 2019, IIT Bombay, Mumbai, India. pp. 1–4.
- den Hartogh MD, Philippens MEP, van Dam IE, et al. MRI and CT imaging for preoperative target volume delineation in breast-conserving therapy. Radiat Oncol. 2014;9(1):63.
- Zastrow E, Davis SK, Lazebnik M, et al. Development of anatomically realistic numerical breast phantoms with accurate dielectric properties for modeling microwave interactions with the human breast. IEEE Trans Biomed Eng. 2008;55(12):2792–2800.
- Tunçay AH, Akduman I. Realistic microwave breast models through T1-weighted 3-D MRI data. IEEE Trans Biomed Eng. 2015;62(2):688–698.
- Omer M, Fear EC. Automated 3D method for the construction of flexible and reconfigurable numerical breast models from MRI scans. Med Biol Eng Comput. 2018;56(6):1027–1040.
- Paulides MM, Rodrigues DB, Bellizzi GG, et al. ESHO benchmarks for computational modeling and optimization in hyperthermia therapy. Int J Hyperthermia. 2021;38(1):1425–1442.
- Lokate M, Peeters PHM, Peelen LM, et al. Mammographic density and breast cancer risk: the role of the fat surrounding the fibroglandular tissue. Breast Cancer Res. 2011;13(5):1–8.
- Price ER, Hargreaves J, Lipson JA, et al. The California breast density information group: a collaborative response to the issues of breast density, breast cancer risk, and breast density notification legislation. Radiology. 2013;269(3):887–892.
- Sindi R, Sá Dos Reis C, Bennett C, et al. Quantitative measurements of breast density using magnetic resonance imaging: a systematic review and meta-analysis. JCM. 2019;8(5):745.
- Lee AHS. Why is carcinoma of the breast more frequent in the upper outer quadrant? A case series based on needle core biopsy diagnoses. Breast. 2005;14(2):151–152.
- Sohn VY, Arthurs ZM, Sebesta JA, et al. Primary tumor location impacts breast cancer survival. Am J Surg. 2008;195(5):641–644.
- Moon H-G, Kim N, Jeong S, et al. The clinical significance and molecular features of the spatial tumor shapes in breast cancers. PLoS One. 2015;10(12):e0143811.
- Clark K, Vendt B, Smith K, et al. The cancer imaging archive (TCIA): maintaining and operating a public information repository. J Digit Imaging. 2013;26(6):1045–1057.
- Christ A, Kainz W, Hahn EG, et al. The virtual family—development of surface-based anatomical models of two adults and two children for dosimetric simulations. Phys Med Biol. 2010;55(2):N23–N38.
- Omer M, Fear E. Anthropomorphic breast model repository for research and development of microwave breast imaging technologies. Sci Data. 2018;5(1):1–10.
- Godinho DM, Felício JM, Castela T, et al. Development of MRI-based axillary numerical models and estimation of axillary lymph node dielectric properties for microwave imaging. Med Phys. 2021;48(10):5974–5990.
- Sha L, Ward ER, Stroy B. A review of dielectric properties of normal and malignant breast tissue In Proceedings of the IEEE SoutheastCon 2002 (Cat. No. 02CH37283), 2002. p. 457–462.
- Lazebnik M, Popovic D, McCartney L, et al. A large-scale study of the ultrawideband microwave dielectric properties of normal, benign and malignant breast tissues obtained from cancer surgeries. Phys Med Biol. 2007;52(20):6093–6115.
- Giuliano AE, Connolly JL, Edge SB, et al. Breast cancer—major changes in the American joint committee on cancer eighth edition cancer staging manual. CA Cancer J Clin. 2017;67(4):290–303.
- Rijnen Z, Bakker JF, Canters RAM, et al. Clinical integration of software tool VEDO for adaptive and quantitative application of phased array hyperthermia in the head and neck. Int J Hyperthermia. 2013;29(3):181–193.
- Van Der Gaag ML, De Bruijne M, Samaras T, et al. Development of a guideline for the water bolus temperature in superficial hyperthermia. Int J Hyperthermia. 2006;22(8):637–656.
- Bellizzi GG, Sumser K, VilasBoas-Ribeiro I, et al. Standardization of patient modeling in hyperthermia simulation studies: introducing the erasmus virtual patient repository. Int J Hyperthermia. 2020;37(1):608–616.
- Drizdal T, Paulides MM, van Holthe N, et al. Hyperthermia treatment planning guided applicator selection for sub-superficial head and neck tumors heating. Int J Hyperthermia. 2018;34(6):704–713.
- Hussain Z, Roberts N, Whitehouse GH, et al. Estimation of breast volume and its variation during the menstrual cycle using MRI and stereology. BJR. 1999;72(855):236–245.
- Vachon CM, Brandt KR, Ghosh K, et al. Mammographic breast density as a general marker of breast cancer risk. Cancer Epidemiol Prev Biomarkers. 2007;16(1):43–49.
- Trefná HD, Crezee H, Schmidt M, et al. Quality assurance guidelines for superficial hyperthermia clinical trials: I. Clinical requirements. Int J Hyperthermia. 2017;33(4):471–482.
- VilasBoas-Ribeiro I, van Rhoon GC, Drizdal T, et al. Impact of number of segmented tissues on SAR prediction accuracy in deep pelvic hyperthermia treatment planning. Cancers. 2020;12(9):2646.