
Abstract
Purpose
To assess short-term tissue shrinkage in patients with liver malignancies undergoing computed tomography (CT)-guided microwave ablation (MWA) using Jacobian determinant (JD).
Materials and methods
Twenty-nine patients with 29 hepatic malignancies (primary n = 24; metastases n = 5; median tumor diameter 18 mm) referred to CT-guided MWA (single position; 10 min, 100 W) were included in this retrospective IRB-approved study, after exclusion of five patients. Following segmentation of livers and tumors on pre-interventional images, segmentations were registered on post-interventional images. JD mapping was applied to quantify voxelwise tissue volume changes after MWA. Percentual volume changes were evaluated in the ablated tumor, a 5-cm tumor perimeter and in the whole liver and compared in different clinical conditions (tumor entity: primary vs. secondary; tumor location: subcapsular vs. non-subcapsular; tumor volume: >/<6 ml: cirrhosis: yes vs. no; prior chemotherapy: yes vs. no using Shapiro–Wilk, χ2 and Wilcoxon rank sum tests, respectively (with p < 0.05 deemed significant).
Results
Tissue volume change was 0.6% in the ablated tumor, 1.6% in the 5-cm perimeter and 0.3% in the whole liver. Shrinkage in the ablated tumor was pronounced in non-subcapsular located tumors, whereas tissue expansion was noted in subcapsular tumors (median −3.5 vs. 1.1%; p = 0.0195). Shrinkage in the whole liver was higher in tumor volumes >6ml, compared with smaller tumors, in which tissue expansion was noted (median −1.0 vs. 2.5%; p = 0.002). Other clinical conditions had no significant influence on the extent of tissue shrinkage (p > 0.05).
Conclusion
3D Jacobian analysis shows that hepatic tissue deformation following MWA is most pronounced in a 5-cm area surrounding the treated tumor. Tumor location and tumor volume may have an impact on the extent of tissue shrinkage which may affect estimation of the safety margin.
Introduction
The efficacy of image-guided thermal ablation including microwave ablation (MWA) of malignant liver tumors is well-established [Citation1–3]. Moreover, thermal ablative techniques are increasingly implemented not only for treatment of unresectable, but also for resectable hepatic lesions [Citation3,Citation4]. MWA provides an energy profile which is advantageous in terms of a faster coagulation, more homogenous and more predictable coagulation zones than for example radiofrequency ablation (RFA) [Citation5,Citation6]. In this regard, meticulous placement of the MWA antenna in knowledge of the expected size of the evolving ablation zone is essential for maximum treatment efficacy and patient safety. Furthermore, anticipation and knowledge of adjacent liver tissue behavior during MWA are beneficial for treatment planning and evaluation of post-interventional imaging in terms of treatment outcome [Citation7].
Recently, significant spatial tissue contraction in the first minutes of the ablation cycle has been shown with the use of hyperthermal techniques [Citation8]. Specifically, a volume decrease of the ablated tissue at the end of the ablation procedure compared with the volume occupied by the equivalent untreated tissue has been observed [Citation8,Citation9]. In a few cases, even expansion of the treated organ tissue has been noticed [Citation10]. Furthermore, it has been shown that the observed shrinkage increases with temperature and is directly related to the deployed energy [Citation9,Citation11]. From a clinical perspective, tissue shrinkage may affect treatment safety as, first, it can expose peripheral structures to unwanted heating and, second, the thermally ablated area might be underestimated on post-interventional imaging [Citation12]. Therefore, there is a strong need to quantify the amount of local and peritumoral tissue shrinkage during MWA to facilitate more precise assessment of the ablation outcome. Investigating tissue shrinkage with regard to different clinical conditions such as tumor location or in cirrhosis may further support treatment planning, especially in challenging cases. Clinically applied methods for tissue shrinkage characterization are typically limited to radiological standard evaluation and tumor segmentation. However, plain visual evaluation of pre- and post MWA CT acquisitions are quantitatively inexact as tissue shrinkage in all three dimensions may be displayed unequally [Citation13]. Moreover, conventional tumor segmentation for comparison of volumetric variation can be challenging due to possible partial volume effects or limited tumor-parenchyma contrast [Citation14].
One established method which allows in vivo measurement of tissue alteration in time is deformable image registration [Citation15,Citation16]. Based on this approach, Jacobian determinant (JD) calculation employs a registration algorithm that provides the transformation at a given voxel by the local volume ratio between the undeformed and deformed voxels [Citation17]. As a result, the deformation of the defined lesion or tissue is captured linearly over time and a Jacobian map of tissue volume changes is created. The local shrinkage obtained from the Jacobian map is integrated voxel-by-voxel to identify the net volume change of the defined tissue [Citation18]. The Jacobian approach was successfully applied to CT-based quantification of lung volume changes depending on ventilation [Citation19,Citation20] and radiation-induced lung disease [Citation21]. In a recent study, the findings of JD and subtraction maps on follow-up CTs were compared with conventional hepatic tumor segmentation outcomes in patients undergoing systemic therapy with promising results [Citation22]. However, tools that quantify in vivo liver and tumor tissue after MWA are still very limited, especially their translation from bench to bedside.
The purpose of our study was twofold. First, it was conducted to quantify tumor and liver shrinkage after hepatic MWA using JD mapping, and second, to assess patient- and tumor-specific factors that may affect the extent of a tissue shrinkage.
Materials and methods
Study design and patients
This study was IRB-approved (Hannover Medical School, approval number 2147-2014) with a waiver of patient consent granted, including patients referred for CT-guided MWA of malignant liver tumors. Respective interventions, follow-up data and demographics were selected retrospectively from a database of all patients treated using percutaneous MWA in our department between December 2012 and February 2021. Inclusion criteria were as follows: patient age ≥18 years; referral for CT-guided MWA of a single malignant hepatic lesion with a curative intent after discussion in our multidisciplinary tumor board; treatment with a single ablation cycle and a single treatment position (power 100 W, 10 min); successful image registration for JD mapping. In addition, all interventions were performed using the same MWA system (EmprintTM Microwave Ablation, Medtronic). Electronic medical patient records were reviewed with regard to demographics, laboratory values and available follow-up data. Initially, 29 patients which were meeting the inclusion criteria were identified from the above-mentioned database. Five patients had to be excluded due to following reasons: incomplete image registration (n = 3); a second indeterminate hepatic lesion identified during MWA (n = 1); one patient with HCC recurrence who was counted twice by mistake (). The final study population comprised 24 patients (14 male; median age 61, interquartile range 34–79 years). Patients were further stratified based on tumor location (subcapsular or non-subcapsular), tumor volume (<6 ml or ≥6 ml), underlying cirrhosis (yes or no), tumor entity (primary or secondary liver tumor), and prior chemotherapy including trans arterial chemoembolization (TACE; yes or no). A subcapsular location was defined as a tumor-capsule distance ≤ 5 mm. The cutoff value of 6 ml for tumor volume stratification was based on the median tumor volume of the final study population. Patient demographic data are presented in detail in .
Figure 1. Flow-chart of patient inclusion process.
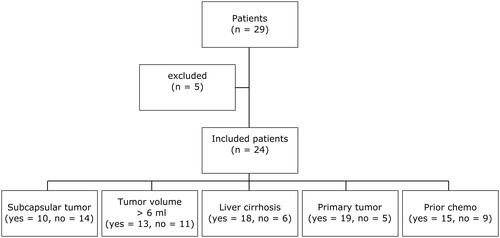
Table 1. Demographic data of patients included for further evaluation of tissue shrinkage after CT-guided MWA.
MWA
MWA was performed under CT-guidance (16 slice scanner; Lightspeed GE Healthcare, Waukesha, WI, USA) and under general anesthesia. Antenna placement was accomplished using the SmartStep mode with single low-dose slices acquired intermittently. MWA was performed by one of two radiologists with more than 10 years of experience in CT-guided interventions, using the Emprint™ Microwave Ablation System (Medtronic Inc.; Watford, UK). This system consists of a 2.45 GHz generator that can generate a maximum power of 100 W. Pre- and post- interventional CT images were acquired in the arterial and portal venous phase using 60 ml of an i.v. contrast agent (Imeron 300, Bracco Imaging Deutschland GmbH, Konstanz, Germany) injected at a flow of 4 ml/s. Complications after MWA were graded as proposed by the Cardiovascular and Interventional Radiological Society of Europe (CIRSE) [Citation23].
Postprocessing and Jacobian analysis
First, image evaluation and semi-automatic whole liver and tumor segmentation were performed on pre-interventional portal-venous phase CT scans using a thin PACS client (Visage Imaging® GmbH, Berlin, Germany). Further postprocessing and Jacobian determinant calculation were performed using MATLAB 2018 b (The MathWorks, Natick, MA, USA). Prior to the registration of post-interventional on pre-interventional CT images, slice locations in both datasets were determined and only intersected slices were included for further postprocessing. Furthermore, all pre and post CT images were zero padded by 20 voxels in all three dimensions to ease the registration and increase convergence speed.
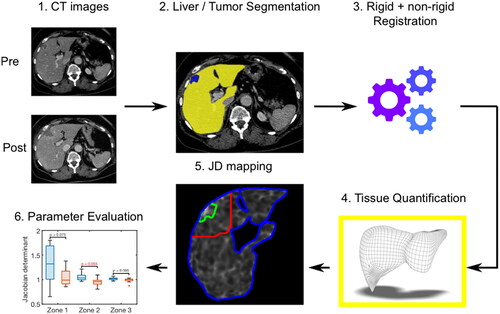
A rigid and non-rigid image registration algorithm using advanced normalization tools [Citation24] was applied to register the post-interventional CT image on the pre-interventional CT image. First, the global structures were aligned using rigid registration. Afterwards, non-rigid registration was necessary, since the location and shape of the liver, heart, lung and other neighboring organs change over time in a complex way. As it was our intention to register only the liver, the semi-automatically segmented liver mask was used to assess the similarity metric between pre- and post-interventional CT image during the registration procedure. To characterize the local structural change (shrinkage/expansion) between both image datasets, the resulting deformation field was further assessed using Jacobian matrix, which is the first derivative of the obtained transformation field. Its determinant, termed Jacobian Determinant (JD), indicates the volumetric change after the registration. The results are interpreted as follows: a JD >1 denotes local tissue expansion; a JD = 1 implies no local volume change; a JD < 1 reflects local tissue shrinkage. JD mapping was performed voxel-wise and evaluated in three specific anatomic zones: (1) ablated tumor zone; (2) a circumferential 5-cm perimeter around the tumor; (3) the whole liver (). After creating JD maps, the median of all voxels was calculated in each patient for assessment of the percental tissue volume change. In this sense, a tissue volume change >0% is consistent with local tissue volume expansion, a tissue volume change = 0% implies no local change and a percental tissue volume change <0% reflects local tissue shrinkage.
Figure 2. Schematic description of the postprocessing steps for evaluation of tissue shrinkage. 1: Export of pre- and post-interventional CT images. 2: Semi-automatic whole liver (yellow color-coded) and tumor (blue color-coded) segmentation. 3: Image registration. 4: Application of a postprocessing algorithm to quantify voxel wise the deformation volume of the liver tissue. 5: Calculation of JD maps in three defined anatomic regions (green zone = ablated tumor; red zone = 5cm tumor perimeter; blue zone = whole liver). 6: Evaluation of tissue shrinkage considering different patient and tumor settings.
Registration performance
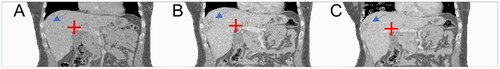
To assess registration accuracy, a pair of anatomical landmarks was placed on the bifurcation of the portal vein in the pre-interventional CT images. Also, a pair of anatomical landmarks was placed on the bifurcation of the portal vein in the registered CT images and in the post-interventional CT dataset, respectively, as described by other study groups before [Citation25]. Distance differences of the same anatomical landmarks placed on the bifurcation of the portal vein between pre- and post-interventional CT datasets and between pre-interventional and registered post-interventional CT datasets were calculated in all patients ().
Figure 3. Exemplary registration analysis. A 43-year-old female patient with a subcapsular located metastasis of a neuroendocrine cervix carcinoma is shown (blue arrow). The bifurcation of the portal vein was defined as landmark and marked in the pre-interventional (A), in the registered (B) and in the post-interventional CT dataset (C) (red cross). The landmark distance between pre- and post-interventional CT images was 10.3 mm and, as expected, the landmark distance between pre- and registered post-interventional CT image decreased, in this patient up to 2.0 mm.
Statistical analysis
Statistical analysis was performed using MATLAB 2018 b (The MathWorks, Natick, MA, USA) and JMP (pro16 software, USA). Data are presented as median and interquartile range (25–75%). Patients’ characteristics were compared between subgroups using χ2 and Wilcoxon rank sum test, respectively. After creating JD maps, the median of all voxels was calculated for each patient for assessment of the percental tissue volume change in different anatomic zones (i.e., ablated tumor, 5-cm tumor perimeter and the whole liver). Furthermore, volume changes in each zone were compared between different subgroups (tumor location, tumor volume, presence of cirrhosis, tumor entity, history of chemotherapy) using Wilcoxon rank sum test. For evaluation of registration accuracy, the landmark differences were compared using Wilcoxon rank sum test. In addition, a post hoc power calculation was performed to calculate the minimal detectable difference for each parameter in all three anatomical zones [Citation26]. A p-value less than 0.05 was deemed statistically significant for all calculations.
Results
Patients and MWA procedure
There were no significant differences of all analyzed clinical conditions regarding patient´s sex and patient´s liver volumes () (all p > 0.2). There were no significant differences of all analyzed clinical conditions (except tumor volume > 6 ml) regarding patient´s tumor volumes (all p > 0.2) (). All tumors were treated according to the protocol and covered completely by the respective ablation zone, as confirmed on post-interventional contrast-enhanced CT. The median liver and tumor volumes were 2595 ml (2046–2915 ml) and 6 ml (2–10 ml), respectively. All ablations were performed using a single- or double- angulated approach, technical success was 100%. There was one grade 1 complication reported in a male patient in terms of a local hematoma which was treated conservatively. One patient died in the later course due to a separate preexisting comorbidity (chronic heart failure) and another patient underwent liver transplantation shortly after MWA. At follow-up, two patients with HCC showed local tumor recurrence.
Table 2. Results of different patient´s preconditions.
Evaluation of image registration
A significant difference between the median distance pre- to post-MWA CT landmarks (median 5.2 mm, inter quartile range 3.9–7.8 mm, p < 0.001) vs. pre- to registered post-MWA CT landmarks (median 2.1 mm, inter quartile range 1.4–3.1 mm, p < 0.001) was found.
Evaluation of tissue shrinkage
In all patients, median percental tissue volume changes in the ablated tumor zone, the 5-cm perimeter and in the whole liver were 0.6, 1.6 and 0.3%, respectively.
At subgroup analysis, significant differences of tissue shrinkage in the tumor region dependent on tumor location were observed. Although in patients with non-subcapsular located tumors pronounced tissue shrinkage (−3.5% (−6.9 to 2.4%) was visible, ablation of subcapsular located tumors resulted in a local volume increase (1.1% (−0.1 to 2.1%), p = 0.0195). Exemplary results of two patients with differently located tumors and their corresponding JD maps are demonstrated in . Similarly, significant differences of tissue shrinkage in the whole liver dependent on tumor volume could be observed. Specifically, in patients with tumors >6 ml, liver volume shrinkage (−1.0% (−1.5 to 1.1%) was more pronounced as opposed to patients with tumor volumes <6 ml (2.5% (−0.2 to 5%), p = 0.002). Results of the post hoc power calculation and volume changes in each subgroup are presented in detail in and in ().
Figure 4. Exemplary results of two patients are demonstrated. (A) Pre- and post-interventional CT images of a 34-year-old female patient with a non-subcapsular located liver metastasis in segment 8 (green arrow) with 6.5 ml tumor volume with regional tissue alterations in zone 1 (green line) of −2.5 %, tissue shrinkage in zone 2 (red line) of +4.7% and similar tissue formation in the whole liver (blue line). (B) Pre- and post-interventional CT images of a 64-year-old female patient with a subcapsular liver metastases in segment 4 (green arrow) with 6.9 ml tumor volume with regional tissue alterations in zone 1 (green line) of +0.9%, +1.6 % in zone 2 (red line) and −0.1 % in the whole liver (blue line).
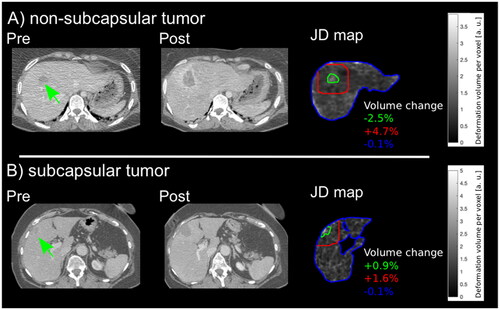
Figure 5. Results of volume changes for all subgroups (A–E) in the ablated tumor, 5-cm perimeter and the whole liver, respectively, are demonstrated. Hepatic tissue volume changes were compared depending on different clinically preconditions including tumor location (subcapsular vs. non-subcapsular, (A), tumor volume (6/<6 ml, B), presence of cirrhosis (yes vs. no, C), tumor entity (primary vs. secondary, D), history of chemotherapy (yes vs. no, E).
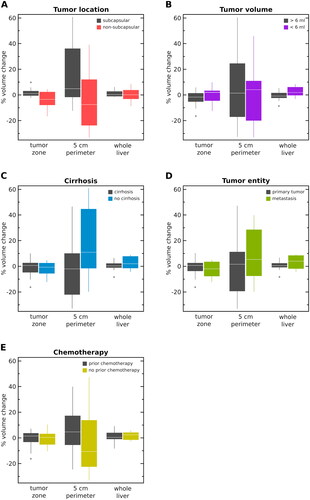
Table 3. Percental tissue volume changes post-MWA of each subgroup are shown.
Table 4. Results of the post hoc power calculation [Citation26].
Discussion
In this study, we systematically assessed the extent of short-term hepatic tissue shrinkage and expansion in patients undergoing CT-guided MWA using JD mapping. Jacobian 3D tissue volume analysis showed that tissue deformation following MWA is most pronounced in a 5-cm zone surrounding the treated tumor. Furthermore, tumor location and tumor volume may have an impact on the extent of tissue shrinkage.
The presented postprocessing algorithm was able to detect regional differences in tissue deformation following MWA in various clinical subgroups of patients with malignant liver tumors. Similar to previous studies [Citation27,Citation28], postprocessing was based on a non-rigid and a rigid image registration algorithm. A non-rigid and a rigid image registration algorithm were chosen, as two different image acquisition time points and two different breathing states in each patient had to be considered. In the validation part of the applied registration algorithm, a significant difference was observed with regard to the distance (mm) of the anatomical landmarks corresponding to the portal vein, between the pre- and post- interventional registered liver CT images. This finding suggests a successful image registration step and is in accordance with previously reported results [Citation25].
There are only few studies that have assessed tissue volume changes quantitatively after percutaneous thermal ablation [Citation29], especially using MWA. Recently, no significant difference of post MWA hepatic shrinkage in centrally vs. peripherally located lesions was described in a living, hepatic porcine non-survival model [Citation30]. However, there are three important differences as compared with our study, which are worth mentioning. First of all, in the above-mentioned study by Awad et al., ablations were performed in non-tumor-bearing porcine hepatic tissue. Second, ablation times were not uniform, varying between 2 and 8 min. And third, the number of included animals was very limited (three animals per group). In the study at hand, a percental volume change of shrinkage was found to be significant in non-subcapsular tumor lesions when compared with subcapsular tumors, when assessing specifically the ablated tumor zone. The 5-cm perimeter and the whole liver showed no notable volume difference after MWA between patients with non-subcapsular and subcapsular tumors. These findings are in line with the results of a previously published study by Hollenstein et al. [Citation31]. The group investigated the biomechanical properties using a bilayer elastic model of an in vitro bovine liver capsule (stroma) and its parenchyma until tissue rupture [Citation31]. The results demonstrated considerable variations regarding the reaction of parenchyma and capsule on mechanical stress [Citation31]. Given these issues, in the context of MWA procedures, neglecting the role of the tumor location may lead to wrongful assumptions concerning the parenchymal properties and of the safety margin [Citation31]. Therefore, considering the patients´ tumor location prior to MWA may offer a clinical benefit when ablating liver lesions close to the capsule. In the future, JD mapping may assist the interventionalist to decrease the safety margin adjusted to the patient´s tumor location site.
In the cohort at hand, patients with larger tumor sizes showed significantly higher tissue shrinkage in the whole liver, whereas patients with smaller tumors demonstrated tissue deformation with volume increase. One possible explanation might be that the tumor-related extent of altered microstructure of the normally hexagonal-shaped hepatic lobules influences the extent to which tissue shrinkage occurs in the liver. In a previous study, the ablated tumor areal has been shown to shrink on evaluated patients MRÍs up to 24 h after MWA [Citation32]. Our patient cohort, however, demonstrated an overall increased liver volume in the 5-cm tumor perimeter at initial follow-up CTs only a few minutes after MWA. One possible explanation for the volume increase in the 5 cm tumor perimeter in all analyzed patients could be that the selected post-CT time of measuring was directly after MWA. Consequently, the microperfusion of the hepatic tissue may be affected inter alia by reactive hyperemia, edema or carbonization [Citation33]. A regional non-uniform liver tissue change with an asymmetry between the radial and the longitudinal axis, as described before, might also play a role [Citation34].
To the best of our knowledge, there are no previous studies that evaluated systemically the short-term extent of tissue shrinkage with regard to different patient- and tumor-specific preconditions. As a novelty, the overall findings of our study indicate the importance to additionally evaluate the clinical context of the patients referred to hepatic MWA ensuring precise tissue deformation analysis.
This study has some limitations. It is a single center, retrospective study with a limited number of patients. However, the presented results are based on a very patient homogeneous cohort with regard to matching MWA specific parameters (single ablation position, 10 min ablation cycle). Another limitation is that the majority of patients had underlying cirrhosis and prior treatment with transarterial chemotherapy. Therefore, the results of our study need to be further validated in larger, preferably multicenter studies.
In conclusion, evaluation of tissue shrinkage after CT-guided MWA based on Jacobian determinant mapping seems feasible. In the study at hand, tissue deformation in different anatomical zones in the liver was not uniform and dependent on tumor location and tumor volume. In this sense, larger cohort studies focusing on the impact of tumor- and patient-specific parameters, which may affect a defined safety margin, are highly warranted. Predictable shrinkage cutoff values in patient subgroups could be valuable for computer-assisted simulations, to improve treatment outcome and patient safety.
Acknowledgements
We would like to thank Lea Behrendt and Cagla Ozdol for the assistance with the figures.
Disclosure statement
No potential conflict of interest was reported by the author(s).
Additional information
Funding
References
- Van Cutsem E, Cervantes A, Adam R, et al. ESMO consensus guidelines for the management of patients with metastatic colorectal cancer. Ann Oncol. 2016;27(8):1386–1422.
- Marrero JA, Kulik LM, Sirlin CB, et al. Diagnosis, staging, and management of hepatocellular carcinoma: 2018 practice guidance by the American Association for the study of liver diseases. Hepatology. 2018;68(2):723–750.
- Vogel A, Martinelli E, Cervantes A, ESMO Guidelines Committee, et al. Updated treatment recommendations for hepatocellular carcinoma (HCC) from the ESMO clinical practice guidelines. Ann Oncol. 2021;32(6):801–805.
- Onkologie L. Leitlinienreport. S3-Leitlinie Diagnostik und Therapie des hepatozellulären Karzinoms und biliärer Karzinome. Arbeitsgemeinschaft der Wissenschaftlichen Medizinischen Fachgesellschaften e.V. (AWMF). 2021;3:1–205.
- Simon CJ, Dupuy DE, Mayo-Smith WW. Microwave ablation: principles and applications. Radiographics. 2005;25(suppl_1):S69–S83.
- Vo Chieu VD, Wacker F, Rieder C, et al. Ablation zone geometry after CT-guided hepatic microwave ablation: evaluation of a semi-automatic software and comparison of two different ablation systems. Int J Hyperthermia. 2020;37(1):533–541.
- Ringe KI, Pöhler GH, Rabeh H, et al. Electromagnetic navigation system-guided microwave ablation of hepatic tumors: a matched cohort study. Cardiovasc Intervent Radiol. 2021;44(3):500–506.
- Brace CL, Diaz TA, Hinshaw JL, et al. Tissue contraction caused by radiofrequency and microwave ablation: a laboratory study in liver and lung. J Vasc Interv Radiol. 2010;21(8):1280–1286.
- Rossmann C, Garrett-Mayer E, Rattay F, et al. Dynamics of tissue shrinkage during ablative temperature exposures. Physiol Meas. 2014;35(1):55–67.
- Liu D, Brace CL. CT imaging during microwave ablation: analysis of spatial and temporal tissue contraction. Med Phys. 2014;41(11):1–9.
- Sommer CM, Sommer SA, Mokry T, et al. Quantification of tissue shrinkage and dehydration caused by microwave ablation: experimental study in kidneys for the estimation of effective coagulation volume. J Vasc Interv Radiol. 2013;24(8):1241–1248.
- Amabile C, Farina L, Lopresto V, et al. Tissue shrinkage in microwave ablation of liver: an ex vivo predictive model. Int J Hyperthermia. 2017;33(1):101–109.
- Farina L, Weiss N, Nissenbaum Y, et al. Characterisation of tissue shrinkage during microwave thermal ablation. Int J Hyperthermia. 2014;30(7):419–428.
- Sarkar S, Johnson TD, Ma B, et al. Evaluation of an automatic registration-based algorithm for direct measurement of volume change in tumors. Int J Radiat Oncol Biol Phys. 2012;83(3):1038–1046.
- Ashburner J, Friston k, Penny W. Human brain function. 2nd ed. In: Friston K, Frith C, Dolan R, editors. Elsevier; 2008.
- Dennis EL, Hua X, Villalon-Reina J, et al. Tensor-based morphometry reveals volumetric deficits in moderate = severe pediatric traumatic brain injury. J Neurotrauma. 2016;33(9):840–852.
- Sakamoto R, Mori S, Miller MI, et al. Detection of time-varying structures by large deformation diffeomorphic metric mapping to aid reading of high-resolution CT images of the lung. PLOS One. 2014;9(1):e85580–11.
- Meyer CR, Armato SG, Fenimore CP, et al. Quantitative imaging to assess tumor response to therapy: common themes of measurement, truth data, and error sources. Transl Oncol. 2009;2(4):198–210.
- Reinhardt JM, Ding K, Cao K, et al. Registration-based estimates of local lung tissue expansion compared to xenon CT measures of specific ventilation. Med Image Anal. 2008;12(6):752–763.
- Castillo R, Castillo E, Martinez J, et al. Ventilation from four-dimensional computed tomography: density versus jacobian methods. Phys Med Biol. 2010;55(16):4661–4685.
- Diot Q, Kavanagh B, Vinogradskiy Y, et al. Lung deformations and radiation-induced regional lung collapse in patients treated with stereotactic body radiation therapy. Med Phys. 2015;42(11):6477–6487.
- Sarkar S, Narayanan R, Park H, et al. Quantitative growth measurement of lesions in hepatic interval CT exams. Med Imag Proc. 2008;6914:69141G.
- Filippiadis DK, Binkert C, Pellerin O, et al. Cirse quality assurance document and standards for classification of complications: the cirse classification system. Cardiovasc Intervent Radiol. 2017;40(8):1141–1146.
- Avants BB, Tustison NJ, Song G, et al. A reproducible evaluation of ANTs similarity metric performance in brain image registration. Neuroimage. 2011;54(3):2033–2044.
- Kim KW, Lee JM, Klotz E, et al. Safety margin assessment after radiofrequency ablation of the liver using registration of preprocedure and postprocedure CT images. Am J Roentgenol. 2011;196(5):565–572.
- Rosner B. Fundamentals of biostatistics. 7th ed. Boston: Brooks/Cole, Cengage Learning; 2011.
- Luu HM, Klink C, Niessen W, et al. Non-rigid registration of liver ct images for ct-guided ablation of liver tumors. PLOS One. 2016;11(9):e0161600.
- Luu HM, Klink C, Niessen W, et al. Erratum: “An automatic registration method for pre- and post-interventional CT images for assessing treatment success in liver RFA treatment” [med. Phys. 42, 5559-5567 (2015)]. Med Phys. 2015;42(12):7202–7202.
- Arnold G, Gressner AM, Clahsen H. Experimental studies of the historheology of the liver capsule (author’s transl). Anat Anz. 1977;142(3):180–191.
- Awad MM, Devgan L, Kamel IR, et al. Microwave ablation in a hepatic porcine model: correlation of CT and histopathologic findings. HPB. 2007;9(5):357–362.
- Hollenstein M, Nava A, Valtorta D, et al. Mechanical characterization of the liver capsule and parenchyma. Vol. 4072, Lecture Notes in Computer Science. Zurich (Switzerland): Biomedical Simulation, Third International Symposium, ISBMS; 2006. p. 150–158.
- Lee JK, Siripongsakun S, Bahrami S, et al. Microwave ablation of liver tumors: degree of tissue contraction as compared to RF ablation. Abdom Radiol. 2016;41(4):659–666.
- Ahmed M, Solbiati L, Brace CL, Standard of Practice Committee of the Cardiovascular and Interventional Radiological Society of Europe, et al. Image-guided tumor ablation: standardization of terminology and reporting criteria – a 10-year update. Radiology. 2014;273(1):241–260.
- Farina L, Amabile C, Nissenbaum Y, et al. Ex vivo tissue shrinking in microwave thermal ablation. 2015 9th European Conference Antennas Propagation, EuCAP; 2015; vol. 2015. p. 8–11.