
 ?Mathematical formulae have been encoded as MathML and are displayed in this HTML version using MathJax in order to improve their display. Uncheck the box to turn MathJax off. This feature requires Javascript. Click on a formula to zoom.
Abstract
Purpose
To develop and evaluate susceptibility corrected 2D proton resonance frequency (PRF)-based magnetic resonance (MR)-thermometry for the accurate assessment of the ablation zone of hepatic microwave ablation (MWA).
Methods and materials
Twelve hepatic MWA were performed in five LEWE minipigs with human-like fissure-free liver. Temperature maps during ablation of PRF-based MR-thermometry were corrected by modeling heat induced susceptibility changes. Ablation zones were determined using cumulative equivalent minutes at 43 °C (CEM43) as tissue damage model. T1 weighted (w) post-ablation contrast-enhanced (CE) MR-imaging and manually segmented postmortem histology were used for validation. The agreement of uncorrected (raw) and susceptibility corrected (corr) MR-thermometry with T1w post-ablation CE MR-imaging and histology was evaluated. The Wilcoxon-signed rank test and Bland–Altman analysis were applied.
Results
With the susceptibility corrected MR-thermometry a significantly increased dice coefficient (raw: 77% vs. corr: 83%, p < 0.01) and sensitivity (raw: 72% vs. corr: 82%, p < 0.01) was found for the comparison to T1w-CE imaging as well as histopathology (dice coefficients: raw: 76% vs. corr: 79%, p < 0.001; sensitivity: raw: 72% vs. corr: 74%, p < 0.001). While major axis length was significantly increased (7.1 mm, p < 0.001) and minor axis length significantly decreased (2.2 mm, p < 0.001) in uncorrected MR-thermometry compared to T1w-CE MR-imaging, no significant bias was found after susceptibility correction.
Conclusion
Using susceptibility corrected 2D PRF-based MR-thermometry to predict the ablation zones of hepatic MWA provided a good agreement in comparison to T1w post-ablation CE MR-imaging and histopathology.
Introduction
Percutaneous image-guided microwave ablation (MWA) has become a promising method for minimally invasive treatment of patients with hepatic malignancies [Citation1–5].
In the clinical setting, MRI provides many advantages for navigation, including excellent soft tissue contrast, multi-planar imaging capabilities, near real-time needle guidance and the absence of ionizing radiation [Citation6–10]. The ability to measure temperature in vivo non-invasively using magnetic resonance (MR)-thermometry is beneficial for monitoring and control of thermal ablation [Citation10]: Only direct intraprocedural temperature measurements ensure complete tumor destruction and thus guarantee complete (‘A0’) ablation while healthy surrounding tissue can be protected. Precise MR-guided oncologic intervention may reduce complications, mortality, lower the rate of recurrence and shorten hospitalization [Citation6,Citation11].
Since the proton resonance frequency (PRF) [Citation10] has a linear temperature dependency in the relevant temperature range of hyperthermial treatment, it allows accurate MR-thermometry and correspondingly treatment monitoring during ablation [Citation12].
PRF-based thermometry measures the shift of the proton frequency either spectroscopically or via the image phase, related to a reference before ablation. Therefore, motion (e.g., respiration, intestinal peristalsis), temporal drift in the main magnetic field B0 and temperature-dependent change of conductivity and temperature-dependent change of magnetic susceptibility of fat tissue in the vicinity of water molecules during ablation may introduce significant errors in temperature estimation and thus significant errors in monitoring of the ablation zone [Citation13,Citation14].
During MWA, high-energy deposition near the microwave applicator may cause vaporization and carbonization of the tissue (near the active zone of the microwave antenna) and release of gas bubbles (mainly nitrogen) [Citation15–17]. Carbonization may lead to inflammation and other unwanted side-effects. Therefore, adapted applicator design, pulsed mode, a water-cooled applicator and temperature controlling are used in commercially available thermal ablation systems to reduce the carbonization zone [Citation18–21].
In addition, reduced water content, tissue carbonization and gas release may change magnetic susceptibility in the vicinity of the microwave applicator and therefore impair PRF-based MR-thermometry [Citation22].
The aim of this work was to evaluate the impact of heat-induced susceptibility changes on PRF-based MR-thermometry of MWA. A correction method is proposed and evaluated in respiratory-triggered PRF-based thermometry for the assessment of the ablation zones induced by hepatic MWA in an in vivo human-like porcine model using a commercially available MWA system.
Material and methods
Animal model
The study was conducted in accordance with the German law for animal protection (TierSchG) and with the European Directive 2010/63/EU. All experiments were approved by the local animal ethic committee (Lower Saxony State Office for Consumer Protection and Food Safety, LAVES (AZ: 33.19-42502-04-18/2987)). Two female and three male LEWE minipigs (body weight 40.8 kg ± 2.8 kg, body length 108.3 cm ± 4.7 cm) were used. Prior to the current experiment, all animals underwent hepatic resection to examine liver regeneration (AZ: 33.12-42502-04-16/2374). This resulted in a homogenous liver without deep intralobular fissures typical for normal porcine livers [Citation23].
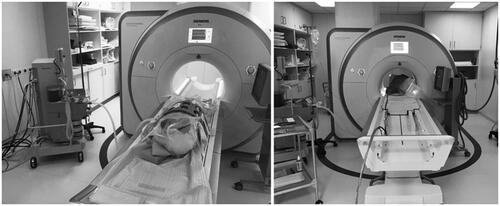
MR-guided MWA was performed 30–34 days after liver resection. Anesthesia was induced via central venous catheter in the V. cava superior with propofol (10 mg/kg) (Narcofol®, CP Pharma, Germany). The animals were intubated and mechanically ventilated with an individualized isoflurane inhalation (air–oxygen mixture 1:1) for maintenance of general anesthesia. The breathing rate was set to 12 breaths/min and a ventilation volume of 10 mL/kg per breath, whereas the medium heart rate amounted to 105 beats/min. The depth of anesthesia was continuously monitored. The animals were placed in head first supine-position (). For analgesia the animals were injected with 4 mg/kg carprofen (Rimadyl®, Zoetis, USA) intravenously at the time of induction of anesthesia. Prior to each puncture of the liver with the microwave applicator, the animals received 1 mg/kg lidocaine as local anesthetic at the site of skin penetration. At the end of the MRI experiments, the animals were euthanized in deep anesthesia by intravenous injection of T61 (MSD Tiergesundheit, Unterschleißheim, Germany).
Figure 1. Experimental setup for the microwave ablation of swines.
Histopathology
Tissue samples of the harvested liver including the ablation zone were cut out as blocks ranging approximately 1.5–2.5 cm distal from the proximal end of the puncture channel and were then formalin-fixed (4% buffered formaldehyde solution) and embedded in paraffin. Slices were cut perpendicular to the puncture channel and stained with hematoxylin and eosin (H&E) and apoptotic cells were visualized by indirect TdT-mediated dUTP nick end labeling (TUNEL) using the ApopTag® Plus Peroxidase In Situ Apoptosis Kit (Merck Millipore, Burlington, MA, USA) according to the manufacturers advice. Central necrotic zone was identified on H&E by lack of nuclei and hyper eosinophilic cytoplasm. The transition zone was defined as visible nuclei on H&E and >50% of apoptotic cells by an experienced pathologist. Unaffected tissue was identified by present nuclei, regular cellular and tissue architecture and the lack of apoptotic cells in TUNEL assay. Slides were digitized using a Zeiss AxioScan.Z1 slide scanner. Segmentation of the whole ablation zone (including the coagulation necrosis and the transition zone) was performed at 20-fold magnification. The histopathologic slices were co-registered manually by an experienced radiologist to the 2D slices of MR-thermometry with an in-house written software (Matlab R2018am The MathWorks, Inc., Natick, MA, USA) [Citation24]: the histologic image overlayed on the magnitude image of MR-thermometry was transformed by translation, rotation and spatial scaling until an optimal morphologic alignment was reached.
MR-guided microwave ablation
MR-guided MWA was performed in a 1.5 T MRI system using the body coil, spine matrix and 4-channel flex coil (MAGNETOM Aera, Siemens Healthineers, Erlangen, Germany). The ablation was performed with a commercially available MR-compatible microwave ablation system AveCure (MedWaves Inc., San Diego, CA, USA) operating at 902–928 MHz placed inside the scanner room (). Using T1w 3D spoiled gradient echo (GRE) imaging for planning of the liver region to be ablated, a real-time balanced steady-state free precession (bSSFP)-based sequence was used to position the microwave applicator (). The ablation zones were placed in the central parts of the liver with a safety distance to the next ablation zone of at least 10 cm. To reduce tissue carbonization, the microwave generator (MWG) includes a temperature sensor subapical to the active tip of the microwave applicator, which allows to limit the maximum temperature in a feedback loop with the pulsed MWG [Citation25]. For all experiments, a medium size 14 gauge microwave applicator with an active tip of 2 cm was used and the MWG was set to 120 °C target temperature with a duration of 12 min.
Table 1. Imaging protocol of MR-guided microwave ablation.
PRF-based 2D MR-thermometry
To reduce motion artifacts, a respiratory-triggered 2D spoiled gradient echo (spGRE) sequence (Table 1: THERM spGRE) was used for PRF-based thermometry. To keep magnetization in steady state the MR sequence was continuously pulsing. To avoid electromagnetic interference, a switching circuit was used to automatically toggle between the states of the MWG: If expiration is reached, the MWG was switched to stand-by mode and then MRI-acquisition started. After MR-imaging of the single slice was finished, the MWG was switched to active mode until the next trigger pulse followed. To prolong the time of the MWG in active mode, MR-imaging was triggered in every second breath.
For MR-thermometry, two parallel slices separated by a distance of 10 mm were oriented perpendicular to the applicator 25 and 15 mm distal to the end of the tip of the microwave applicator. The two slices were acquired sequentially during two separate stand-by cycles of the MWG. With a respiratory cycle of 5 s and an acquisition time per image of 1.8 s (using parallel imaging with reduction factor 0.68 for accelerated image acquisition [Citation26]), one image was acquired every 20 s resulting in a duty cycle of approximately 80% for the active ablation system.
Post-ablation T1w-CE 3 D spGRE imaging was performed one minute after an intravenous injection of 0.025 mmol/kg gadolinium ethoxybenzyl diethylenetriamine pentaacetic acid (Gd-EOB-DTPA, Primovist, Bayer-Schering Pharma, Berlin, Germany) ().
Temperature maps
Subsequent to the experiment, the phase images for PRF-based thermometry were reconstructed using GRAPPA with an in-house written software using Matlab R2018a (The MathWorks, Inc., Natick, MA, USA) [Citation26]. Residual motion was compensated by co-registering the root sum squared images using the baseline-image as reference [Citation27]. The resulting motion transforms were applied to the complex coil images which were combined according to Parker et al. [Citation28]. The temperature changes during ablation were calculated by subtracting the present phase φ(x,y,t) during heating from a reference phase φ0(x,y) at baseline:
(1)
(1)
where
is the temperature change at a certain time-point t during the heating phase, α is the thermal coefficient (−0.01 ppm/°C),
is the gyromagnetic ratio, B0 is the static magnetic field and TE is the echo time [Citation10]. The reference phase φ0 was calculated as the average of ten THERM spGRE phase images acquired before starting the ablation.
To correct for the B0 field drifts, the temperature difference in an adipose area was averaged per time point, linearly fitted over time and subtracted from the temperature difference map [Citation29–31]. For phase drift correction, areas of high signal-to-noise ratio, a homogenous signal distribution and without motion were manually selected.
Susceptibility correction
Field distortions near the microwave applicator induced by vaporization, carbonization and formation of gas bubbles were corrected according to Kickhefel et al. [Citation32]. Time-dependent spatial phase change due to change of susceptibility
may be calculated as follows:
(2)
(2)
with H0 being the unperturbed magnetic field strength, FT being the Fourier-transform [Citation33] and
being the coordinates in Fourier space.
Time-dependent susceptibility change may be estimated by a constant susceptibility difference between carbonized and uncarbonized liver tissue multiplied by the change of shape of the signal void S(x,y,t)−S0(x,y,t) surrounding the microwave applicator.
The increasing area of signal void surrounding the ablation needle was segmented semi-automatically from an iso-contour fit at 60% of the mean signal of the liver (determined in a manually drawn region-of-interest (ROI)). This procedure overestimates the region of overheated tissue, but is a practical approach to find borders accurately and reproducibly. Binary masks S(x,y,t) were created setting the area within these borders to ‘1’ and all other areas to ‘0’.
In MWA, carbonization develops a cylindrical shape around the microwave applicator [Citation34]. Since PRF-based thermometry was measured by two parallel 2D slices orthogonal to the ablation applicator, 3D field distortion was modeled by a cylinder of infinite length:
(3)
(3)
where the Fourier-transform of the cylinder was applied in the coordinate system with the axis of infinite length aligned in the z-direction. The function of the first factor in the brackets, where the z-axis is aligned with B0, is transformed to the coordinate system of the cylinder and the product before inverse Fourier-transform is applied over the non-zero k-space locations of the Fourier-transform of the cylinder of infinite length.
represents the phase difference between liver tissue and the areas of gas formation/tissue carbonization.
Temperature maps corrected by susceptibility changes were calculated:
(4)
(4)
The body temperature measured before ablation by the temperature probe included in the microwave applicator, was added for absolute temperature mapping.
Evaluation of the prediction of the ablation zone
Temperature precession was assessed by calculating the mean standard deviation of the temperature maps for single voxels in manually drawn ROIs in the nonheated liver and skeletal muscle.
Using the temperature maps, tissue damage was estimated with the cumulative equivalent minutes at 43 °C (CEM43) model:
(5)
(5)
with
for T > 43° and
for T ≤ 43 °C. Tissue damage is assumed if thermal dosage of CEM43 is above 240 min [Citation35].
To validate the assessment of the ablation zone using T1w 3D spGRE CE MR-imaging, it was compared to co-registered necrosis maps of histopathology. Since misalignment between MR-imaging and the histologic samples may yield a significant error, the accuracy of PRF-based thermometry was evaluated by using T1w 3D spGRE CE MR-imaging as the ground truth. The ablation zone was manually segmented in the T1w-CE data by a radiologist with 6 years of experience. MR-thermometry and CE MR-imaging were co-registered using Advanced Normalization Tools V2.3.1 [Citation27].
The accuracy of the predicted ablation zones was tested slice by slice by calculating the Dice Similarity Coefficient, the sensitivity and the false positive rate (FPR). In addition, the area and the minor and major axis lengths (defined by the normalized second moments of the area) of the ablation zone were assessed and compared.
Determination of 
Susceptibility-corrected PRF-based thermometry requires the knowledge of between liver tissue and the gas/carbonized tissue developing during ablation. One approach to estimate
is to minimize the standard deviation of
along the border between liver tissue and the gas/carbonized tissue [Citation32]. However, optimization over this low intensity region may be prone to errors. Instead,
was determined by maximizing the dice coefficient between the ablation zone assessed by PRF-based thermometry and by post-ablation T1w-CE MR-imaging. Due to the low number of ablation zones, exhaustive cross-validation (165 possible combinations) using four samples as training set and eight samples as test set was applied to determine
Statistical analysis
Data are given as median with interquartile range in brackets. Data of both imaged slices were averaged for each swine. The Shapiro–Wilk test was used to test for normality. Since the data were not normally distributed, the Wilcoxon signed-rank test was used. A p < 0.05 was considered statistically significant. p-Values were adjusted in case of multiple comparison according to Bonferroni correction. Agreement to the reference was assessed with Bland–Altman analysis.
Results
MR-guided microwave ablation
Twelve MR-guided MWA were performed with two ablations in animals 1 to 3 and three ablations in animals 4 and 5 with larger livers. Because several specimens of the histopathologic samples showed scratches, which prevented accurate assessment of the ablation zone and precise spatial alignment with MR-imaging, only 5 of 12 histology samples were included in statistics.
The mean total energy input of the MWA was 19 kJ ± 2 kJ. The mean temperature at the applicator was 96 °C ± 23 °C at the end of the ablation ().
Table 2. Animal population, deposited energy and start and end temperature of the MWA, temperature accuracy and dice coefficients, sensitivities and false positive rate of PRF-based thermometry, susceptibility differences between liver and gas of all animals and all ablation procedures.
Validation of post-ablative T1w-CE
In comparison to histopathology, a good agreement of the ablation zones assessed by post-ablative T1w-CE imaging was found with a dice score of 79% (6%), sensitivity of 78% (23%) and an FPR of 11% (25%).
PRF-based temperature mapping
During ablation, a development of the extent of signal void surrounding the MW applicator was visible (). The signal void increases rapidly at the beginning of the ablation and shows a slight decrease at the end or after the ablation procedure. Caused by the corresponding dipolar distortion field, the resulting temperature map () provided an asymmetric distribution with an underestimation of the temperature in one spatial direction (red (‘1’) and yellow (‘3’) dots in and an overestimation of the temperature in the perpendicular direction (green (‘2’) and blue (‘4’) dots in .
Figure 2. Formation of gas bubbles and tissue carbonization during MWA lead to an development of the signal void around the center of the ablation zone in imaging of MR-thermometry. The red lines indicate the contours of the signal void found by the semi-automatic segmentation approach. In addition, the time after starting of the ablation procedure (duration 720 s) is given.
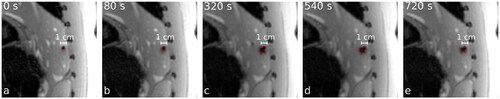
Figure 3. Exemplary liver ablation (swine 1, first ablation) with ablation zone determined by T1w-CE imaging (red line in (a)) and segmented area of signal void in MR-thermometry (black line in (d)). The resulting temperature map at the end of ablation (b and e) and corresponding time-dependent temperature curves (c, f) at four different positions (1: red, 2: green, 3: yellow and 4: blue dot) without (first row) and with (second row) susceptibility correction are shown.
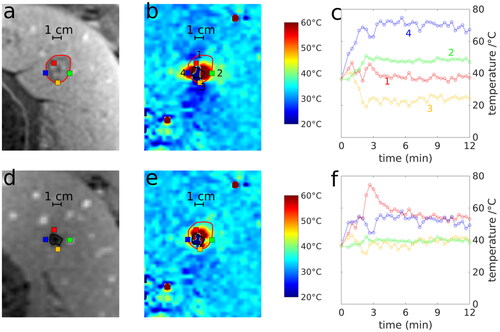
The semi-automatic segmentation of the signal void used to correct for the distortions of the magnetic field is indicated by the black line in . After application of the corresponding field correction, the temperature map () showed a more symmetric distribution around the center of the microwave applicator. This provided a better agreement with the shape of the ablation zone determined by post-ablation T1w-CE (red line in ) and an approximately radially symmetric temperature distribution around the center of the microwave applicator. For instance, the time curve of the yellow dot outside the ablation zone (‘3’ in ) provided a temperature decline during MWA prior to susceptibility correction, but was nearly constant after correction.
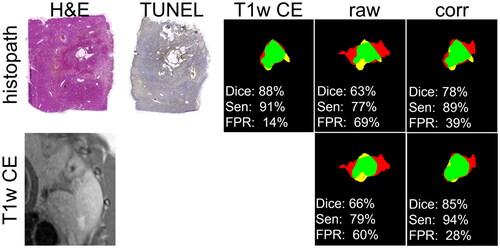
In comparison to the ablation zone determined by histopathology and T1w-CE, PRF-based MR-thermometry (, ‘raw’) overestimated the ablation zone (red area) in one spatial direction and underestimated (yellow area) its size in the perpendicular direction. After susceptibility correction (, ‘corr’), the ablation zones of PRF-based MR-thermometry showed a better visual (, green area) and quantitative (, ‘Dice’: dice coefficient, ‘Sen’: sensitivity, ‘FPR’: false positive rate) agreement with T1w-CE and histopathology.
Figure 4. Comparison of the predicted ablation zone assessed by T1w-CE, uncorrected (raw) and susceptibility corrected (corr) thermometry with histopathology (first row) and T1w-CE as reference (green area: intersection, yellow area: false negative, red area: false positive). Dice coefficients (Dice), sensitivities (Sen) and False Positive Rate (FPR) are given related to histopathology (first column) and T1w-CE (second column). Correspondingly, H&E and TUNEL staining as well as the image of T1w-CE are shown.
Optimization of
introduced by the developing gas/carbonized tissue during MWA, was determined by maximizing the median dice coefficient between the ablation zone assessed by T1w-CE and PRF-based MR-thermometry:
Data were split in a training set, providing the optimized and a test set to evaluate MR-thermometry for the assessment of the ablation zones. In the training set, the optimal susceptibility difference was found by maximizing the median dice score of the ablation zone predicted by MR-thermometry using the identical susceptibility difference for all data in this group in comparison to the ablation zone of T1w-CE imaging. A significant increase of the dice score was found in the test set using the optimized susceptibility difference determined in the training group. Using all 165 possible combinations of training and test data, the median optimal
of all samples provided 3.1 ppm (0.5 ppm). This value was used in the subsequent analysis of susceptibility corrected PRF-based thermometry.
In addition, the individually optimized susceptibility differences ranged from 2.6 to 5.1 ppm with a median of 3.1 ppm (2.0 ppm).
Accuracy of MR-thermometry: uncorrected vs. susceptibility corrected
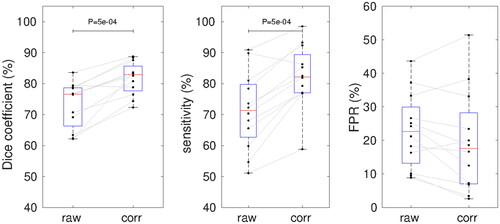
Comparing the ablation zones of MR-thermometry and histopathology, dice coefficients (raw: 76% (14%) vs. corrected: 79% (10%), p < 0.01) and sensitivity (raw: 72% (12%) vs. corrected: 74% (13%), p < 0.01) were significantly increased and FPR (raw: 12% (24%) vs. corrected: 5% (24%), p < 0.05) was significantly decreased after susceptibility correction.
In comparison to T1w-CE, susceptibility corrected thermometry provided significantly higher dice coefficients (raw: 77% (12%) vs. corrected: 83% (8%), p < 0.001) and sensitivities (raw: 72% (17%) vs. corrected: 82% (12%), p < 0.001) and a, not significantly, decreased FPR (raw: 23% (17%) vs. corrected: 18% (21%)) than uncorrected thermometry ( and ).
Figure 5. Dice coefficients, sensitivity and FPR of the ablation zone provided by MR-thermometry without and with susceptibility correction. Red lines with blue boxes represent group median with interquartile range for the corresponding data (black dots). p-Values of the Wilcoxon signed-rank test are shown.
Using individually optimized median dice coefficients were slightly increased (84% (8%), p < 0.001), sensitivities significantly decreased (67% (12%), p < 0.001) and FPR was not significantly different (22% (13%)) compared to the optimization by exhaustive cross-validation.
The area of the ablation zones of uncorrected and susceptibility corrected thermometry provided only a small, but statistically not significant bias compared to T1w-CE ( and ) (raw: −39 m2; corrected: −8 mm2). In concordance with the observation that PRF-based MR-thermometry is perturbed by a dipolar distortion field, the major axis length of uncorrected MR-thermometry was significantly increased (7.1 mm, p < 0.001) and the minor axis length was decreased (−2.2 mm, p < 0.001) compared to T1w-CE. Contrary, corrected MR-thermometry provided a small but not significant bias for both major axis length (1.7 mm) and minor axis length (−0.4 mm) ().
Figure 6. Bland–Altman plot of the area (first column), major axis and minor axis length (second and third column) of uncorrected (first row) and susceptibility corrected (second row) MR-thermometry in comparison to T1w post-ablation contrast-enhanced (P-C) MR-imaging.
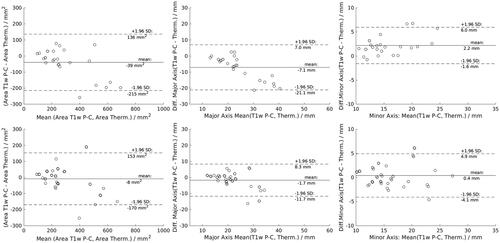
Table 3. Median area, major and minor axis length of the ablation zones depending on the susceptibility correction.
Table 4. p-Values of Wilcoxon signed-rank test comparing area, major and minor axis length of the ablation zones assessed by raw and susceptibility corrected MR-thermometry with T1w-CE MR-imaging.
Temperature accuracy
Median standard deviation of PRF-based MR-thermometry was 1.0 °C ± 0.2 °C in the muscle and 1.9°C ± 0.4 °C in the liver.
Discussion
The observed increase of the signal void surrounding the microwave applicator at the beginning of the ablation procedure may be explained by reduced water content, tissue carbonization and gas release of strongly heated liver tissue. The slight reduction of the signal void at the end of the procedure may be explained by tissue shrinkage [Citation36].
Using susceptibility correction of the dipolar distortion field caused by tissue carbonization and gas release close to the microwave applicator, a good agreement with post-ablation T1w-CE images was observed. The respective dice coefficient was 83% and a median bias of 8 mm2 for the area and 1.7 mm and 0.4 mm for the major and minor diameter of the ablation zone were found. Similarly, in a previous study of radiofrequency ablation of ex vivo tissue, susceptibility correction showed an improvement of the predicted temperatures of PRFS-based thermometry [Citation37]. With an uncertainty of 1 °C in regions without motion and of 1.9 °C in the liver a good accuracy of PRF-based MR-thermometry is achieved, which is in line with previous findings [Citation38].
A prerequisite of precise MR-thermometry is to minimize electromagnetic interference caused by the microwave generator. In this study, the MWA system was automatically switched to stand-by mode by the MR scanner to reduce interference with MR-imaging. However, this modification voids the FDA-approval of the commercially available MWA system and therefore impedes its application in a clinical setting. In addition, with a duty cycle of 80%, the effectiveness of the ablation is reduced or its duration must be increased. Without switching to stand-by mode, image quality may be improved by detection and shielding of electromagnetic interferences. In a study by Gorny et al., the same commercially available MWG was modified without affecting its FDA-approval and achieved an SNR loss of only 14% in a clinical setting while the MWG was active with an accuracy of 1.4 °C using PRF-based thermometry [Citation38]. Although effective, this method requires an independent adjustment for every interventional MR-suite and even for every procedure.
High temperatures equal to and above 100 °C near the microwave applicator lead to vaporization (gas formation) and tissue carbonization [Citation39]. The corresponding susceptibility change during ablation results in a dipolar field distortion that leads to an asymmetric distribution of the temperature assessed by MR-thermometry in the imaging plane perpendicular to the microwave applicator. The predicted ablation zone provided a significant overestimation (7.1 mm) in one spatial direction and an underestimation (2.2 mm) in the perpendicular direction.
Modeling the cavity as a cylinder of infinite length resulted in a correction of the dipolar field distortions [Citation32]. Thereby, the agreement of the area, the diameter and the shape (dice coefficient) of the ablation zone assessed by PRF-base thermometry and T1w-CE was significantly increased. The above-mentioned study by Gorny et al. reported an underestimation of the ablation zone in comparison to T1w post-contrast MR-imaging using CEM43 as tissue damage model and assigned this mainly to nonperfect phase drift correction [Citation38]. On the contrary, in our study using susceptibility correction, no significant underestimation was found. The optimization of using the dice score between MR-thermometry and T1w-CE may also compensate for other effects like motion, phase drift, fat fraction and interference with the MWG and may therefore overfit the agreement with T1w-CE.
We acquired two slices perpendicular to the microwave applicator for MR-thermometry. Using more slices or 3D imaging could give more precise information of tissue carbonization and gas formation and may therefore improve susceptibility correction. Furthermore, long echo times (of 9.6 ms) of spGRE imaging overestimates the signal void due to progressing spin dephasing particularly in regions of B0 inhomogeneity. To increase the robustness of the method, we used a fixed threshold of the signal decline at the edge of the signal void to define the borders to the unaffected tissue and was determined by maximizing the dice coefficient of the ablation zone in comparison to T1w-CE. However, the threshold has an impact on the resulting optimal value of
Therefore, the presented values for
are probably not in the expected physical range of a transition of the B0 field from tissue to gas/carbonized tissue. In the future, 3D imaging at lower echo times and at higher spatial resolution may improve the estimation of the exact shape of the cavity. Modeling of the cavity developing around the microwave applicator with a cylinder of infinite length, may not compensate for field distortions introduced by single traveling gas bubbles, motion or phase drift. More sophisticated methods of background field removal may further improve the susceptibility correction [Citation40–43].
In concordance with published work, the median diameter of the ablation zone assessed by post-ablation T1w-CE was 20.4 mm for MWA of 12 min and a target temperature of 120 °C [Citation44,Citation45]. Considering a safety margin of 5 mm, a single MWA-applicator should only be used to treat tumors less than 10 mm diameter. Larger ablation volumes can be achieved by using multiple applicators at higher material cost or one applicator in multiple positions at the cost of longer duration [Citation46].
Limitations
One limitation of our work is that thermal imaging was only available in 2D imaging in slices perpendicular to the microwave applicator. In the future, accelerated 3D MR-imaging and multigradient echo imaging may allow assessing the total ablation zone and may allow B0 quantification to better model the temperature dependency.
Another limitation is that ablation was only performed in healthy tissue. To evaluate the clinical impact of MR-thermometry, assessing the outcome of MWA in a tumor model is needed.
Conclusion
In an in vivo animal study we evaluated the performance of respiratory-gated PRF-based MR-thermometry to assess the ablation zone of hepatic MWA. Correcting for susceptibility changes caused by gas formation and tissue carbonization significantly improved the prediction of the temperature distribution in the liver tissue. Our results are important for further development of robust and accurate MR-thermometry during hepatic MWA to improve percutaneous local tumor treatment.
Acknowledgements
B.H. and S.H. contributed equally to this article and share the first authorship. D.J. and C.W. would like to thank Christina Petzold for her excellent technical support on this project.
Disclosure statement
No potential conflict of interest was reported by the author(s).
Additional information
Funding
References
- Morikawa S, Inubushi T, Kurumi Y, et al. MR-guided microwave thermocoagulation therapy of liver tumors: initial clinical experiences using a 0.5 T open MR system. J Magn Reson Imaging. 2002;16(5):576–583.
- Simon CJ, Dupuy DE, Mayo-Smith WW. Microwave ablation: principles and applications. Radiographics. 2005;25(Suppl 1):S69–S83.
- Vogl TJ, Nour-Eldin NA, Hammerstingl RM, et al. Microwave ablation (MWA): basics, technique and results in primary and metastatic liver neoplasms - review article. Rofo. 2017;189(11):1055–1066.
- Izzo F, Granata V, Grassi R, et al. Radiofrequency ablation and microwave ablation in liver tumors: an update. Oncologist. 2019;24(10):e990–e1005.
- Lubner MG, Brace CL, Hinshaw JL, et al. Microwave tumor ablation: mechanism of action, clinical results, and devices. J Vasc Interv Radiol. 2010;21(Suppl 8):S192–S203.
- Barkhausen J, Kahn T, Krombach GA, et al. White paper: interventional MRI: current status and potential for development considering economic perspectives, part 2: liver and other applications in oncology. Rofo. 2017;189(11):1047–1054.
- Meyer BC, Brost A, Kraitchman DL, et al. Percutaneous punctures with MR imaging guidance: comparison between MR imaging-enhanced fluoroscopic guidance and real-time MR imaging guidance. Radiology. 2013;266(3):912–919.
- Rempp H, Loh H, Hoffmann R, et al. Liver lesion conspicuity during real-time MR-guided radiofrequency applicator placement using spoiled gradient echo and balanced steady-state free precession imaging. J Magn Reson Imaging. 2014;40(2):432–439.
- Rothgang E, Gilson WD, Wacker F, et al. Rapid freehand MR-guided percutaneous needle interventions: an image-based approach to improve workflow and feasibility. J Magn Reson Imaging. 2013;37(5):1202–1212.
- Rieke V, Butts Pauly K. MR thermometry. J Magn Reson Imaging. 2008;27(2):376–390.
- Garnon J. Mission: impossible? Cardiovasc Intervent Radiol. 2020;43(11):1639–1640.
- JC H. Proton resonance shift of water in the gas and liquid states. J Chem Phys. 1966;44(12):4582–4592.
- Winter L, Oberacker E, Paul K, et al. Magnetic resonance thermometry: methodology, pitfalls and practical solutions. Int J Hyperthermia. 2016;32(1):63–75.
- Baron P, Deckers R, de Greef M, et al. Correction of proton resonance frequency shift MR-thermometry errors caused by heat-induced magnetic susceptibility changes during high intensity focused ultrasound ablations in tissues containing fat. Magn Reson Med. 2014;72(6):1580–1589.
- Chiou SY, Liu JB, Needleman L. Current status of sonographically guided radiofrequency ablation techniques. J Ultrasound Med. 2007;26(4):487–499.
- Malone DE, Lesiuk L, Brady AP, et al. Hepatic interstitial laser photocoagulation: demonstration and possible clinical importance of intravascular gas. Radiology. 1994;193(1):233–237.
- Goldberg SN, Gazelle GS, Mueller PR. Thermal ablation therapy for focal malignancy: a unified approach to underlying principles, techniques, and diagnostic imaging guidance. AJR Am J Roentgenol. 2000;174(2):323–331.
- Umehara H, Seki T, Inokuchi R, et al. Microwave coagulation using a perfusion microwave electrode: Preliminary experimental study using ex vivo and in vivo liver. Exp Ther Med. 2012;3(2):214–220.
- Bedoya M, del Rio AM, Chiang J, et al. Microwave ablation energy delivery: influence of power pulsing on ablation results in an ex vivo and in vivo liver model. Med Phys. 2014;41(12):123301.
- Granchi S, Vannacci E, Breschi L, et al. Advantages of cooled fiber for monitoring laser tissue ablation through temporal and spectral analysis of RF ultrasound signal: a case study. Ultrasonics. 2018;82:49–56.
- Wolf FJ, Aswad B, Ng T, et al. Intraoperative microwave ablation of pulmonary malignancies with tumor permittivity feedback control: ablation and resection study in 10 consecutive patients. Radiology. 2012;262(1):353–360.
- De Landro M, Pietra F, Pagotto SM, et al. Analysis of cavitation artifacts in magnetic resonance imaging thermometry during laser ablation monitoring. Annu Int Conf IEEE Eng Med Biol Soc. 2022;2022:5008–5011.
- Wittauer EM, Oldhafer F, Augstein E, et al. Porcine model for the study of liver regeneration enhanced by non-invasive 13C-methacetin breath test (LiMAx test) and permanent portal venous access. PLoS One. 2019;14(5):e0217488.
- Hensen B, Drenkmann U, Frericks B, et al. Detection of ablation boundaries using different MR sequences in a swine liver model. Cardiovasc Intervent Radiol. 2022;45(7):1010–1018. (accepted).
- Liang PC, Lai HS, Shih TT, et al. Initial institutional experience of uncooled single-antenna microwave ablation for large hepatocellular carcinoma. Clin Radiol. 2015;70(5):e35-40–e40.
- Griswold MA, Jakob PM, Heidemann RM, et al. Generalized autocalibrating partially parallel acquisitions (GRAPPA). Magn Reson Med. 2002;47(6):1202–1210.
- Avants BB, Epstein CL, Grossman M, et al. Symmetric diffeomorphic image registration with cross-correlation: evaluating automated labeling of elderly and neurodegenerative brain. Med Image Anal. 2008;12(1):26–41.
- Parker DL, Payne A, Todd N, et al. Phase reconstruction from multiple coil data using a virtual reference coil. Magn Reson Med. 2014;72(2):563–569.
- Bing C, Staruch RM, Tillander M, et al. Drift correction for accurate PRF-shift MR thermometry during mild hyperthermia treatments with MR-HIFU. Int J Hyperthermia. 2016;32(6):673–687.
- Gellermann J, Wlodarczyk W, Feussner A, et al. Methods and potentials of magnetic resonance imaging for monitoring radiofrequency hyperthermia in a hybrid system. Int J Hyperthermia. 2005;21(6):497–513.
- Faridi P, Keselman P, Fallahi H, et al. Experimental assessment of microwave ablation computational modeling with MR thermometry. Med Phys. 2020;47(9):3777–3788.
- Kickhefel A, Weiss C, Roland J, et al. Correction of susceptibility-induced GRE phase shift for accurate PRFS thermometry proximal to cryoablation iceball. MAGMA. 2012;25(1):23–31.
- Salomir R, De Senneville B, Moonen C. A fast calculation method for magnetic field inhomogeneity due to an arbitrary distribution of bulk susceptibility. Concepts Magn Reson. 2003;19B(1):26–34.
- Jin X, Feng Y, Zhu R, et al. Temperature control and intermittent time-set protocol optimization for minimizing tissue carbonization in microwave ablation. Int J Hyperthermia. 2022;39(1):868–879.
- Sapareto SA, Dewey WC. Thermal dose determination in cancer therapy. Int J Radiat Oncol Biol Phys. 1984;10(6):787–800.
- Amabile C, Farina L, Lopresto V, et al. Tissue shrinkage in microwave ablation of liver: an ex vivo predictive model. Int J Hyperthermia. 2017;33(1):101–109.
- Viallon M, Terraz S, Roland J, et al. Observation and correction of transient cavitation-induced PRFS thermometry artifacts during radiofrequency ablation, using simultaneous ultrasound/MR imaging. Med Phys. 2010;37(4):1491–1506.
- Gorny KR, Favazza CP, Lu A, et al. Practical implementation of robust MR-thermometry during clinical MR-guided microwave ablations in the liver at 1.5 T. Phys Med. 2019;67:91–99.
- Ansari MA, Erfanzadeh M, Mohajerani E. Mechanisms of laser-tissue interaction: II. Tissue thermal properties. J Lasers Med Sci. 2013;4(3):99–106.
- Boehm C, Goeger-Neff M, Mulder HT, et al. Susceptibility artifact correction in MR thermometry for monitoring of mild radiofrequency hyperthermia using total field inversion. Magn Reson Med. 2022;88(1):120–132.
- Wu M, Mulder HT, Baron P, et al. Correction of motion-induced susceptibility artifacts and B0 drift during proton resonance frequency shift-based MR thermometry in the pelvis with background field removal methods. Magn Reson Med. 2020;84(5):2495–2511.
- Tan J, Mougenot C, Pichardo S, et al. Motion compensation using principal component analysis and projection onto dipole fields for abdominal magnetic resonance thermometry. Magn Reson Med. 2019;81(1):195–207.
- Liu T, Khalidov I, de Rochefort L, et al. A novel background field removal method for MRI using projection onto dipole fields (PDF). NMR Biomed. 2011;24(9):1129–1136.
- Dong J, Geng X, Yang Y, et al. Dynamic imaging and pathological changes in pig liver after MR-guided microwave ablation. BMC Cancer. 2018;18(1):397.
- Kaltenbach B, Roman A, Eichler K, et al. Real-time qualitative MR monitoring of microwave ablation in ex vivo livers. Int J Hyperthermia. 2016;32(7):757–764.
- Hoffmann R, Rempp H, Keßler D-E, et al. MR-guided microwave ablation in hepatic tumours: initial results in clinical routine. Eur Radiol. 2017;27(4):1467–1476.