
 ?Mathematical formulae have been encoded as MathML and are displayed in this HTML version using MathJax in order to improve their display. Uncheck the box to turn MathJax off. This feature requires Javascript. Click on a formula to zoom.
Abstract
Introduction
Hyperthermic IntraPEritoneal Chemotherapy (HIPEC) aims to treat microscopic disease left after CytoReductive Surgery (CRS). Thermal enhancement depends on the temperatures achieved. Since the location of microscopic disease is unknown, a homogeneous treatment is required to completely eradicate the disease while limiting side effects. To ensure homogeneous delivery, treatment planning software has been developed. This study compares simulation results with clinical data and evaluates the impact of nine treatment strategies on thermal and drug distributions.
Methods
For comparison with clinical data, three treatment strategies were simulated with different flow rates (1600-1800mL/min) and inflow temperatures (41.6–43.6 °C). Six additional treatment strategies were simulated, varying the number of inflow catheters, flow direction, and using step-up and step-down heating strategies. Thermal homogeneity and the risk of thermal injury were evaluated.
Results
Simulated temperature distributions, core body temperatures, and systemic chemotherapeutic concentrations compared well with literature values. Treatment strategy was found to have a strong influence on the distributions. Additional inflow catheters could improve thermal distributions, provided flow rates are kept sufficiently high (>500 mL/min) for each catheter. High flow rates (1800 mL/min) combined with high inflow temperatures (43.6 °C) could lead to thermal damage, with values of up to 27 min. Step-up and step-down heating strategies allow for high temperatures with reduced risk of thermal damage.
Conclusion
The planning software provides valuable insight into the effects of different treatment strategies on peritoneal distributions. These strategies are designed to provide homogeneous treatment delivery while limiting thermal injury to normal tissue, thereby optimizing the effectiveness of HIPEC.
Introduction
Peritoneal metastases (PM) are generally not very sensitive to systemic chemotherapy due to the hypoxic nature of the peritoneal nodules [Citation1,Citation2]. The combination of cytoreductive surgery (CRS) and hyperthermic intraperitoneal chemotherapy (HIPEC) offers a curative treatment for selected patients diagnosed with PM. During CRS, the goal is to resect all visible macroscopic tumors, which may include the removal of significantly affected organs. Invisible microscopic tumor nodules can remain on the peritoneal surface after surgery, possibly causing recurrent disease after treatment. The addition of HIPEC is intended to eliminate the microscopic disease and reduce the risk of recurrence. During HIPEC treatment, a heated chemotherapy solution (39 °C–43 °C) is circulated through the abdomen. The perfusate is heated to enhance the cytotoxic effect of the chemotherapeutic agents. Other beneficial hyperthermic effects include inhibition of DNA repair and enhanced immune responses [Citation3–5]. Enhanced efficacy can be quantified by the thermal enhancement ratio (TER), which can be calculated as the ratio of the chemotherapy dose required to achieve a given endpoint at 37 °C to the chemotherapy dose required to achieve the same endpoint at elevated temperatures [Citation6]. For in vitro experiments, this endpoint is defined as a percentage of cell survival. The TER can vary widely for different chemotherapeutic agents and treatment temperatures [Citation4,Citation7]. Since the exact remaining microscopic tumor locations are unknown, HIPEC treatments should aim for a homogeneous thermal and drug distribution over the entire peritoneal surface. Since TERs are typically determined in steps of 0.5–1 °C, knowing the thermal distribution with accuracy within this range would provide valuable information on local thermal enhancement. However, the complexity of the peritoneal geometry and the large number of interactions with the body and environment can make it difficult to achieve homogeneous treatment conditions.
In 2015, Rettenmaier et al. published extensive thermal measurements during a 90-min closed HIPEC treatment in eleven women with advanced ovarian cancer [Citation8]. Temperatures were measured at five anatomical sites in the abdomen, at fifteen-minute intervals. Measurements showed variations of up to four degrees between sites and patients, which is not uncommon. A study by Ceelen et al. reported thermal variations between 38 °C and 41.5 °C [Citation9]. The clinical relevance of a sufficiently high treatment temperature was demonstrated by Schaaf et al. [Citation10]. They showed that the survival of the patients was higher when they were treated with at least 40 °C in the omental bursa and pelvis for a duration of 40 min. Although a small heterogeneous cohort of patients was studied, the results suggest the importance of achieving a thermal threshold. This threshold has been determined by in vitro research using clinically relevant cell lines and chemotherapeutic agents. The experimentally determined threshold of 40 °C for a duration of 40 min depends on the combination of cell type and chemotherapeutic agent used. However, in general, the existence of such a clinically relevant threshold demonstrates the importance of a homogeneous treatment. However, excessive drug and thermal doses can also lead to treatment side effects, as shown in the PRODIGE-7 trial. CRS + HIPEC using a high dose of oxaliplatin (360 mg/m2 via closed vs 460 mg/m2 via open techniques) and high treatment temperatures (43 °C) for a short treatment duration (30 min) was associated with a high incidence of post-treatment adverse events compared to CRS alone [Citation11].
Adverse effects may occur during or after hyperthermia treatments if an excessive thermal dose is administered. A quantitative measure to assess the risk of thermal injury is the cumulative equivalent exposure time in minutes at 43 °C (CEM43) dose. High CEM43 values are known to result in irreversible thermal damage. The CEM43 threshold at which thermal damage may occur depends on the tissue type [Citation12]. Achieving a homogeneous thermal distribution, i.e., achieving sufficiently high treatment temperatures while limiting thermal damage, is therefore important for the safe and effective use of HIPEC.
Treatment parameters such as catheter position and number, flow rate, and inflow temperature have a significant impact on the distributions achieved. In current clinical practice, a constant inflow temperature is used during HIPEC. More advanced treatment strategies that may be able to increase treatment efficacy are step-down and step-up heating approaches. In step-up heating, a treatment (e.g., radiation, brachytherapy, chemotherapy etc.) is delivered combined with hyperthermia at a relatively mild temperature. Toward the end or after the treatment, a sensitizing thermal boost is given at a higher temperature. In step-down heating, the order is reversed and the treatment is preceded by or begins with the thermal boost. In the 1980s and 1990s, step-up and step-down heating approaches were investigated in combination with various modalities. In 1991, Lindegaard et al. published a study in which C3H breast cancer was irradiated and simultaneously treated with a mild temperature (41 °C–43 °C) [Citation13]. A sensitizing treatment (43.5 °C–44.5 °C) was performed before or after irradiation for step-down and step-up approaches, respectively. The authors reported that the step-down approach resulted in significantly higher TERs, suggesting that the step-down approach has a larger radiosensitizing effect. Similar experiments were performed in combination with radiation and brachytherapy by Hiraoka et al. [Citation14] and Jones et al. [Citation15], respectively. Both studies reported results in favor of step-down heating. Although the treatment characteristics of HIPEC are very different from the experimental studies mentioned above, this type of approach may help to provide high treatment temperatures throughout the tumor target zone with a reduced risk of thermal damage to normal tissues compared to standard high-temperature treatment strategies.
Simulations can be very useful to gain more insight into the effect of different treatment strategies and to help determine strategies to improve the homogeneity of the heat distribution. To this end, we have developed treatment planning software based on the OpenFoam computational fluid dynamics (CFD) software package [Citation16]. The software is capable of simulating 3D thermal and drug distributions during HIPEC. In previous studies, we have shown that varying treatment parameters can help to optimize distributions in a rat model, as shown in [Citation17,Citation18]. Recently, we published an experimental validation study investigating the accuracy of the thermal module of the software, as shown in [Citation19]. A phantom of a female peritoneal cavity was printed in 3D at a scale of 1:1. Several treatment strategies were evaluated by varying the catheter setup, flow rate, and inflow temperature. The results showed that the software has an accuracy of well below 0.5 °C for steady-state situations, which, considering the uncertainties in the biological and clinical data, is accurate enough to provide estimates of heterogeneities in the thermal distribution and to help determine the optimal treatment strategy for HIPEC. The phantom used was representative of the female peritoneal cavity, but some clinically relevant phenomena such as organ perfusion and interaction with the systemic compartment could not be included.
This study was designed to address two research objectives. The first objective was to make a comparison with clinically measured data. The second objective was to vary several key treatment parameters to evaluate the effect of these parameters on the thermal distribution and CEM43. First, the treatment strategies used in the closed HIPEC treatments of Rettenmaier et al. were simulated to compare the predictions with the measurements reported in the reference [Citation8]. Second, several different treatment strategies, including catheter adjustment, flow reversal, and step-up and step-down strategies, were simulated to determine the influence on thermal distribution at the peritoneal surface. Evaluation of the different strategies included both temperature homogeneity and CEM43 values in the peritoneal organs to assess the likelihood of efficacy and the risk of adverse events, respectively.
Materials and methods
In this section, we describe the methodology of the simulations performed by the treatment planning, based on the OpenFoam software package. The numerical methods, thermal and drug modules, computational geometry, case setup, and boundary conditions are discussed. Finally, the methods of evaluation of the simulations and the comparison with the literature are described.
Numerical methods
The software was based on the OpenFoam chtMultiRegionFoam solver, which is capable of solving the heat, drug, and fluid dynamics in connected solid and fluid regions [Citation16,Citation20]. Several extensions were added to account for the thermal and drug dynamics, as will be discussed in the next section. A combination of the Semi-Implicit Method for Pressure-Linked Equations (SIMPLE) and the Pressure Implicit with Splitting of Operator (PISO) algorithms was used, referred to as the PIMPLE solver. Discretization schemes used were CrankNicolson, cellLimited and linearUpwind for time, finite volume, and all other fields. Organs were modeled as solids with fixed densities and thermal conductivity, based on values reported by IT’IS [Citation21]. gives a list of the physical constants for the organs. Three equations govern the fluid dynamics in the peritoneal cavity: the energy equation, momentum conservation, and mass conservation, given by [Citation20]:
(1)
(1)
(2)
(2)
(3)
(3)
respectively. In EquationEquations (1)–(3)
, h ,
,
are the heat flux [W/m2], enthalpy [m2/s2], specific kinetic energy [m2/s2], velocity [m/s], density [kg/m3], shear-rate tensor [kg/m/s2], pressure [Pa], and the gravitational vector [m/s2], respectively. Additionally, the transport of chemotherapeutic agents in the peritoneal cavity was calculated using
(4)
(4)
where C is the concentration of chemotherapeutics in [mol/m3] and D is the diffusion coefficient [m2/s]. For a more complete and detailed description of the governing equations, we refer to [Citation20]. In the next section, the tissue thermal and drug modules are described.
Table 1. Values are obtained from [Citation21].
Thermal and drug modules
In tissue, the Pennes bioheat equation determines the heat distribution [Citation22]. For the distribution of the chemotherapeutic agent, we used a particle transport equation. These two equations can be written as:
(5)
(5)
(6)
(6)
assuming an isotropic and homogeneous medium. In EquationEquations (5)
(5)
(5) and Equation(6)
(6)
(6) ,
T, t, k,
C, D and
are the tissue density [kg/m3], tissue-specific heat [J/kg/K], temperature [K], time [s], thermal conductivity [J/s/K/m], heat sink [J/m3/s], chemotherapy concentration [mol/m3], apparent diffusion constant [m2/s] and chemotherapy sink [mol/m3/s], respectively. Both heat and chemotherapeutic agents can be carried into the systemic compartment and redistributed through the peritoneal tissues.
The heat sink, due to perfusion, is given by [Citation22]:
(7)
(7)
where
and
are the mass flow rate per unit volume of tissue [kg/s/m3], blood specific heat [J/kg/K ], core temperature [K] and local tissue temperature [K], respectively. The core temperature was updated continuously during simulations and the local heat was redistributed according to EquationEquation (5)
(5)
(5) . The perfusion can vary significantly per organ and therefore organ specific perfusion terms were used, as listed in . Metabolic heat generation and cutaneous heat loss were included with a volumetric and core component to account for the body parts not explicitly modeled. Therefore, the core temperature was updated at each iteration using the following equation:
(8)
(8)
where q represents the heat added or removed by a specific process [J/s],
the density of blood [kg/m3],
the total volume of blood in the body [m3], and
the time-step [s].
Chemotherapeutic agents are transported by both diffusion and convection. However, it is impossible to explicitly model microscopic convective flow patterns in a model at this scale. Furthermore, interstitial convection does not have a predetermined direction. Therefore, EquationEquation (6)(6)
(6) only features a diffusion term and not a convection term similar to the second term in EquationEquation (4)
(4)
(4) . During the experimental determination of diffusion coefficients in tissues, a solute flux is measured and fitted to a diffusion equation. A major drawback of this approach is that it is impossible to separate the contribution of convection and diffusion to the transport of a solute, resulting in the determination of an apparent or effective diffusion coefficient [Citation23]. In the application presented in this study, using an apparent diffusion coefficient in EquationEquation (6)
(6)
(6) is an effective way to include both the contribution of convection and diffusion in the diffusion EquationEquation (6)
(6)
(6) . The apparent diffusion coefficient depends on the molecular weight
of the solute, given by [Citation23,Citation24]
(9)
(9)
resulting in an apparent diffusion coefficient of
for a molecular weight of 397
(oxaliplatin).
The chemotherapeutic sink was defined based on the work of Baxter and Jain [Citation25], given by:
(10)
(10)
(11)
(11)
where
and
are the first-order elimination constant [
] representing cellular uptake, the permeability of the capillary wall [m/s], surface area per unit volume [
] and the Péclet number, reflecting the ratio between convective and diffusive transport [−], respectively. In EquationEquation (11)
(11)
(11) , we assumed that the vascular concentration is negligible compared to the interstitial concentration, which is generally the case in the first part of HIPEC treatments. The Péclet number is given by
(12)
(12)
where
and
are the reflection coefficient [−], hydraulic conductivity [
], and pressure gradient over the capillary wall [Pa], respectively. The pressure gradient is a balance of the interstitial pressure
[Pa], blood pressure
[Pa], and the osmotic pressure gradient
(13)
(13)
with c being a non-dimensional osmotic reflection constant. The chemotherapeutic agents extracted from the tissues are added to the systemic concentration, which is calculated every time-step by:
(14)
(14)
where
is the elimination constant from the system [
]. The physical constants that are used in this study for both the thermal and drug modules in tissues are presented in and .
Table 2. Parameters used for the thermal and drug modules, obtained from literature.
Computational geometry and case setup
The human model used in this study was based on the XCAT phantoms, provided by Duke University [Citation29]. These models provide high-resolution segmented anatomical data sets, based on segmentations of patients and the Visible Male and Female anatomical datasets from the National Library of Medicine [Citation30]. In total, fifteen different regions were defined in the computational geometry: peritoneal surrounding, ascending colon, descending colon, rectum, small intestine, liver, stomach, spleen, left and right ovaries, vasculature, bladder, uterus, pancreas, and free flow region. show the anatomy of the peritoneal organs and the vasculature. For simplicity, all regions were modeled as solid except for the free flow region (peritoneal cavity). Organ-specific definitions were made for thermal conductivity, perfusion, specific heat, and density. Several catheter setups were modeled, as shown in . For simplicity and to increase computational speed, single-hole square catheters were modeled instead of circular catheters, which would require more and smaller elements to accurately represent the surface area of the catheter tip. Near the catheters, flow velocities are at a maximum with Reynolds numbers of around 3000–6000, depending on flow rate and catheter setup. Flow velocities and Reynolds numbers decrease rapidly with increasing distance from the catheters. To account for this, the model was used, applicable for high and low Reynolds numbers. In total, meshes consisted of 100.000–150.000, mostly hexahedral, elements. Elements varied in size depending on the level of detail needed to correctly represent a region.
Figure 1. Anatomical model used in this study, based on the organ models generated by the XCAT phantoms. Panels (A) and (B) show the front and back of the model, visualizing the organs and vasculature. Panel (C) visualizes the location of the inflow (red) and outflow (blue) catheters used in this study. The two inflow two outflow catheter setup was based on that used by Rettenmaier et al. [Citation8].
![Figure 1. Anatomical model used in this study, based on the organ models generated by the XCAT phantoms. Panels (A) and (B) show the front and back of the model, visualizing the organs and vasculature. Panel (C) visualizes the location of the inflow (red) and outflow (blue) catheters used in this study. The two inflow two outflow catheter setup was based on that used by Rettenmaier et al. [Citation8].](/cms/asset/de63d2b0-4974-4ba6-8a9f-0b2e7ebfdf08/ihyt_a_2218627_f0001_c.jpg)
Nine cases were considered in this study, as summarized in . The first three cases reflect treatment strategies based on the treatment characteristics reported by Rettenmaier et al. and were used for comparison with clinical data. The catheter configurations (two inflow/outflow catheters), flow rates (1600–1800 ml/min) and inflow temperatures (41.3 °C–43.5 °C) were similar as during closed HIPEC treatments described by Rettenmaier et al. [Citation8] to represent mild (lowest flow rate and inflow temperature reported), moderate (median flow rate and inflow temperature reported) and severe (highest flow rate and inflow temperature reported) treatment strategies, referred to as cases #1–3. For these cases, a two-inflow/two-outflow catheter configuration was used. Inflow catheters were placed in each hemidiaphragm and the outflow catheters were placed in the pelvis, see .
Table 3. Case setup representing the treatment strategies used in this study.
In cases #4–9, other treatment strategies were used to evaluate their influence on the homogeneity throughout the peritoneal surface, thereby assessing which treatment strategy could be used to achieve the most homogeneous distribution while limiting the risk of thermal damage. For cases #4, #5, and #6, 1, 4, and 4 catheters were used as inflow, respectively. Case #7 was identical to case #2 for the first 20 min after which the flow direction was reverted. Cases #8 and #9 were defined to simulate a step-up heating or step-down heating strategy by switching the mild strategy (case #1) to a severe strategy and the severe strategy to a mild strategy after 20 min, respectively. The thermal distributions generated by these treatment strategies were used to calculate the TER distribution for three combinations of cell type and chemotherapy based on in vitro data extracted from [Citation4]. All cases are summarized in .
Boundary conditions
In total, four boundaries were defined in the model: inter-organ boundaries (1), free flow region to tissues (2), tissue-to-environment boundaries (3), and a boundary representing the interaction between the closed abdominal opening and the environment (4).
At the inter-organ boundaries, for example, the boundary between liver and stomach, and the free flow to tissue boundaries, all fields were continuous. The boundary conditions for the thermal field ensured that an appropriate thermal gradient is calculated, based on the thermal conductivity of both organs or based on the conductivity of the fluid and organ. The chemotherapeutic agents are free to travel into and between organs according to EquationEquation (6)(6)
(6) .
Between tissues and the environment, no drug transport takes place. However, heat is lost to the environment. To account for this, the externalWallHeatFluxTemperature boundary condition was used, which calculates the heat loss by either a fixed heat flux or by an overall heat transfer coefficient h and the temperature difference between the boundary and ambient temperatures
(15)
(15)
where
k,
and r are the boundary temperature [K], ambient temperature [K], total heat resistance [Wm−2K−1], conductivity [W/K], the temperature at the nearest cell center [K], and the distance to that cell center [m]. The total heat resistance is given by
(16)
(16)
where
is the thickness [m] of layer i with conductivity
Between tissue and surroundings, no additional layers are required, and therefore
However, for the interaction between the fluid region and surroundings, an intermediary layer is required to correctly calculate the heat transfer through the closed abdomen. During a closed HIPEC, the abdominal cavity is closed and a layer of fat and skin separates the free-flowing region from the environment, creating an insulating layer incorporated in EquationEquation (16)
(16)
(16) .
The velocity field was initiated by a forced flow condition called flowRateInletVelocity at the in- and outflow catheters according to the flow rate given in . Velocity was assumed to be zero at the walls. At the inflow catheters, the turbulence module was initiated with the boundary conditions turbulentIntensityKineticEnergyInlet and TurbulentMixingLengthFrequencyInlet for k and
respectively. Wall functions were used to satisfy the turbulent physics near walls. These wall functions switch between laminar and turbulent approaches so that they are applicable for a wide range of Reynolds numbers. At the inflow, the drug concentration was determined based on the values reported in [Citation31]. The average perfusate concentration was interpolated and used as input. For a complete overview of the boundary conditions provided by OpenFoam, we refer to [Citation32].
Model assumptions
Several assumptions had to be made regarding governing equations and boundary conditions to reduce the computation time. These assumptions were discussed above and are listed below. The consequences and future strategies regarding these assumptions are considered in the ‘Discussion’ section. Summarizing, in this study we made the following assumptions:
Tissues were modeled as a solid medium. Veins and capillaries were assumed isotropic and heterogeneous throughout tissues. Only large structures were modeled explicitly. This can affect sink terms in EquationEquations (5)
(5)
Only intraperitoneal organs were modeled explicitly.
Vascular concentration during a HIPEC treatment was considered negligible.
No convective particle transport was modeled. An effective diffusion coefficient was used, based on experimental data.
Heat loss through the closed abdomen was modeled using a heat resistance factor. No explicit diffusion between the fluid and surroundings was modeled.
Cellular uptake was modeled using a first-order elimination constant. Back flow was not taken into account.
A single geometry was modeled, excluding possible anatomical variations between patients.
Evaluation and data comparison
For the first three cases, five temperature assessment regions similar to those reported by Rettenmaier et al. were used to compare measured and predicted thermal distributions. The peritoneal cavity was divided into five different regions: right-upper abdomen, left-upper abdomen, left-mid abdomen, right-mid abdomen, and suprapubic regions. In these regions, the simulated median and interquartile ranges were compared with the minimum, maximum, and median temperatures measured in that region, as reported by [Citation8]. Several key treatment parameters in cases #4–9, see . The purpose of comparing these treatment strategies was to assess the degree of homogeneity and possible thermal injury to the peritoneal surface. A comparison of all nine cases was made based on the thermal dose to the peritoneal surface and the percentage of the surface that had reached 41 °C. The thermal dose was evaluated using cumulative equivalent minutes at 43 °C (CEM43). This method is often used in hyperthermia treatments to quantify a time-integrated thermal dose by expressing an equivalent duration of exposure at 43 °C. The CEM43 can be calculated by:
(17)
(17)
where
R,
N,
and
are the start-time (min), end-time (min), an experimentally determined constant [−], the time-dependent local temperature [°C], the number of time-steps [−], and the temperature at that time-step, respectively. The constant term R is typically set to 0.5 for temperatures above 43 °C and 0.25 °C for temperatures below 43 °C. The CEM43 measure can also be used to evaluate potential thermal damage in normal tissue. For this purpose, we defined the
value where 10% of the surface or volume was observed to have a CEM43 value above this level.
Results
The first part of this section gives the results of a comparison between the simulated data and the data measured by Rettenmaier et al. [Citation8], using similar evaluation regions. The remainder of this section presents the results of various treatment strategies aimed at improving the thermal distribution, including flow reversal, removing and adding inflow catheters and changing the heating strategies, i.e., step-up and step-down heating. These treatment strategies are divided into two subsections. The results section is concluded with a results of a comparison of TER distributions per treatment strategy using preclinical in vitro data from Helderman et al. [Citation4].
Comparison of simulations with clinical data
shows the time-dependent temperature profiles in the 5 different peritoneal regions. The mild and moderate cases, reached a steady-state temperature after approximately 15 and 10 min, respectively. The thermal profile for the severe case, using higher temperatures and flow rates, increased toward the end of the treatment. The good agreement between the median experimental values and the thermal distribution produced by the moderate treatment strategy indicates that the software was able to accurately predict the steady-state temperature for all regions. Minimizing and maximizing the flow rate and inflow temperature in the mild and severe cases explained some of the variation measured during the treatments. Near the inflow, regions A and B, the severe and mild strategies were close(r) to the minimum and maximum measured values. Especially low measurement values could not be explained by the variations. This could be due to organ movement that (partially) covers the thermal probe, resulting in a lower temperature that is not accounted for in the simulations.
Figure 2. Comparison between the simulated mild, moderate and severe treatment strategies compared to the clinically measured mean minimum, maximum and average values, extracted from 34. Panels (A–E) show the thermal profile for the upper abdominal (right and left), mid-abdominal (right and left) and suprapubic regions, respectively. The median values are represented by the solid black line with symbols and the red, orange and yellow shaded areas represent the interquartile ranges in that region for the severe, moderate and mild treatment strategies, respectively. The gray shaded area and black horizontal lines reflect the measured ranges and the average steady state value. Overall, the steady-state temperature values reported by Rettenmaier et al. [Citation8] and the simulated temperature were similar. The increased flow rate and high(er) inflow temperature may account for some of the fluctuations that occurred during the treatment.
![Figure 2. Comparison between the simulated mild, moderate and severe treatment strategies compared to the clinically measured mean minimum, maximum and average values, extracted from 34. Panels (A–E) show the thermal profile for the upper abdominal (right and left), mid-abdominal (right and left) and suprapubic regions, respectively. The median values are represented by the solid black line with symbols and the red, orange and yellow shaded areas represent the interquartile ranges in that region for the severe, moderate and mild treatment strategies, respectively. The gray shaded area and black horizontal lines reflect the measured ranges and the average steady state value. Overall, the steady-state temperature values reported by Rettenmaier et al. [Citation8] and the simulated temperature were similar. The increased flow rate and high(er) inflow temperature may account for some of the fluctuations that occurred during the treatment.](/cms/asset/0c9a9a17-06a1-47f2-be45-dd4148424031/ihyt_a_2218627_f0002_c.jpg)
The chemotherapy and heat in the peritoneal tissues can be transferred to the systemic compartment by perfusion, and then partially redistributed. The systemic exposure to chemotherapy and the core body temperature were continuously monitored during the simulation. The change of core body temperature, the perfusate drug concentration, plasma drug concentration and the ratio of perfusate concentration to plasma concentration over time is shown in . Core body temperature is visualized for the mild (yellow), moderate (orange) and severe (red) treatment strategies, demonstrating the effect of treatment strategy on the core body temperature. (top) shows a comparison of the predicted systemic values and those reported in literature. Since the core body temperature is dependent on treatment characteristics, core body temperatures from the literature were compared to the case that matched the treatment characteristics in the respective study. Core body temperatures were in good agreement with literature values. A similar comparison was made for plasma concentrations of chemotherapeutic agents. Since studies use different doses, the maximum perfusate concentration to the maximum plasma concentration, was compared (see lower ). The values in the literature vary widely (
) but are comparable to the predicted value (
).
Figure 3. Visualization of the change in core body temperature (A), perfusate drug concentration (B), plasma drug concentration (C) and ratio of perfusate concentration over plasma concentration (D). Core body temperatures are visualized for the mild (yellow), moderate (orange) and severe (red) treatment strategies. Dashed lines (A) and the blue shaded region (D) represent literature values, as shown in . The inflow concentration, and therefore the perfusate curve (B), was determined based on the average values presented in [Citation31]. A more detailed comparison between the predicted core values and those reported in the literature is shown in .
![Figure 3. Visualization of the change in core body temperature (A), perfusate drug concentration (B), plasma drug concentration (C) and ratio of perfusate concentration over plasma concentration (D). Core body temperatures are visualized for the mild (yellow), moderate (orange) and severe (red) treatment strategies. Dashed lines (A) and the blue shaded region (D) represent literature values, as shown in Table 4. The inflow concentration, and therefore the perfusate curve (B), was determined based on the average values presented in [Citation31]. A more detailed comparison between the predicted core values and those reported in the literature is shown in Table 4.](/cms/asset/c43437e4-efa5-4ac2-b368-52e6389cd8ea/ihyt_a_2218627_f0003_c.jpg)
Table 4. Comparison of simulated core temperatures and chemotherapy concentration with literature values.
Flow inversion and catheter optimization
In most cases, a steady state situation was reached after 10–15 min. After this time, regions that are undertreated will not receive a sufficient (thermal) dose unless adjustments are made. One possible adjustment is to apply a flow reversal, i.e., changing the inflow to outflow and vice-versa. shows the thermal dose which is the lower limit of the upper 10% of the CEM43 values at the peritoneal surface. This value was approximately 10% lower for the reversed flow (Case #7) compared to Case #2, indicating that the thermal dose could be reduced by reversing the flow, potentially reducing the likelihood of thermal injury. shows that reversing the flow has no effect on the median surface temperature; regions that were more heated after flow reversal compensated regions that were less heated after the reversal. shows the percentage of the surface that reached 41 °C during the treatment as a function of treatment duration. Case #2 reached a plateau at 67% of the peritoneal surface. When the flow was reversed after 20 min (case #7), an additional 6% reached 41 °C.
Figure 4. Influence of treatment strategies on the peritoneal surface. Panel (A) shows the CEM43 level of which 10% of the peritoneal surface is above (). Panel (B) shows the median temperature on the peritoneal surface. Panel (C) shows the percentage of the peritoneal surface that reached 41 °C during the treatment. Aggressive treatment strategies, including heating (for a period of time) at 43 °C, increase both the thermal dose and the percentage that has been treated with 41 °C.
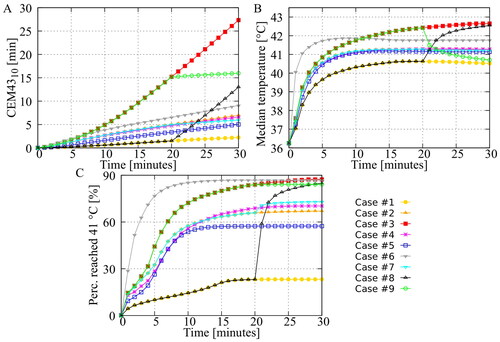
Additional catheters also affect flow patterns in the peritoneal cavity. Cases #2, #4, #5 and #6 used 2/2, 1/1, 4/1 and 4/1 as inflow/outflow catheter setups. In the first three, the total flow rate was kept constant, so the flow rate per catheter could vary. As shown by , there no significant differences between cases #2 and #4. However, when four catheters were used (case #5), and the flow rate for each catheter was reduced by half (compared to case #2), a significantly lower percentage reached 41 °C. This underscores the importance of a sufficiently high flow rate per catheter, which influences the ‘reach’ of the flow. For Case #6, the total flow rate was doubled so that the flow rate per catheter was the same as for Case #2. Both the median temperature and the percentage reaching 41 °C increased significantly, while the thermal dose remained relatively low ().
Heating strategies
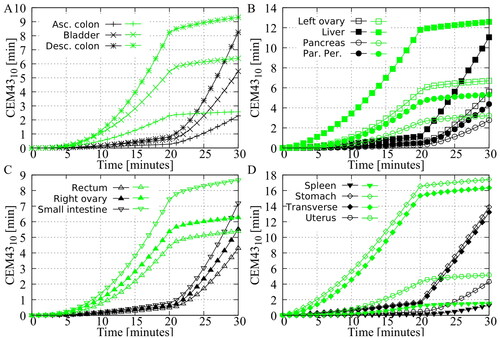
In Cases #8 and #9, step-up heating (20 min mild and 10 min severe) and step-down heating (20 min severe and 10 min mild) were used to achieve high treatment temperatures while limiting the risk of thermal injury. The median temperature and the percentage of the surface area reaching 41 °C are high for both the step-up and step-down approaches and are comparable to the severe treatment strategy, as shown in . However, shows that the cumulative is significantly lower for these two approaches. compare the volumetric
doses per organ for both approaches. For all organs, the
values are significantly higher for step-down heating, indicating that this approach would result in an increased likelihood of thermal injury. These results suggest that step-up heating may be a more effective and safer approach.
Figure 5. Predicted volumetric value in the different peritoneal organs. The green curves represent the step-down approach and the black curves represent the step-up approach. All curves show that the step-down approach results in a higher thermal dose, indicating a higher risk of thermal damage in the various peritoneal organs.
Patient specific optimization
Thermal enhancement ratios can vary widely between cell types and chemotherapeutic agents. To demonstrate the clinical relevance of the thermal distribution on the peritoneal surface, the cumulative thermal enhancement ratio [min] is visualized in . In , the thermal enhancement curves for three cell types and chemotherapeutics are visualized, based on the work by Helderman et al. In , the translation to the peritoneal surface is made. The thermal distributions of all cases were used to calculate the cumulative thermal enhancement ratio. shows that the use of an optimized treatment strategy is more important for certain combinations of cell type and chemotherapy. For example, the use of an optimized treatment strategy was more relevant for the combination of RKO and carboplatin than for the combination of HUTU80 and oxaliplatin, where the differences between treatment strategies were much smaller. Ultimately, the optimal treatment strategy should provide a homogeneous distribution for all cell types and chemotherapy combinations. Case #6 (i.e., using four inflow catheters and a high flow rate of 3400 ml/min) was the best treatment strategy, with a high mean thermal enhancement and closely grouped percentiles, indicating a homogeneous thermal enhancement distribution.
Figure 6. Demonstration of the need for patient specific optimization by combining preclinical in vitro data, based on the work of Helderman et al. [Citation4], with the thermal distributions generated in this study. The cumulative thermal enhancement ratio (TER) is visualized for all cases. Whiskers represent the 10th and 90th percentiles, boxes represent the interquartile range, and the mean is represented by the black bar. Differences between the cases may increase or decrease depending on cell type and chemotherapy. Overall, Case #6 provides the most homogeneous distribution of thermal enhancement.
![Figure 6. Demonstration of the need for patient specific optimization by combining preclinical in vitro data, based on the work of Helderman et al. [Citation4], with the thermal distributions generated in this study. The cumulative thermal enhancement ratio (TER) is visualized for all cases. Whiskers represent the 10th and 90th percentiles, boxes represent the interquartile range, and the mean is represented by the black bar. Differences between the cases may increase or decrease depending on cell type and chemotherapy. Overall, Case #6 provides the most homogeneous distribution of thermal enhancement.](/cms/asset/882b2cbe-06c8-4e59-abec-8a1ff2494777/ihyt_a_2218627_f0006_c.jpg)
Discussion
The aim of this study was to compare simulations with clinical data and to evaluate the effect of different treatment strategies on the thermal distribution over the peritoneal surface. Nine strategies were studied. The first three strategies were based on the work of Rettenmaier et al. [Citation8]. Minimum, median, and maximum flow rates and inflow temperatures were used to define mild, moderate, and severe treatment strategies. In addition, three catheter setup variations, flow inversion, and step-up/step-down heating strategies were used to investigate the effect of different treatment strategies on effective heating of the peritoneal surface.
The model used in this study is similar to the model used in [Citation19]. The purpose of the study in [Citation19] was to validate the thermal distribution in an open-HIPEC peritoneal 3D-printed phantom. Accuracy was found to be less than 0.5 °C for steady-state situations. The purpose of the present study was to evaluate HIPEC in a closed abdomen, so insulating boundary conditions were incorporated at the open abdomen boundary to mimic the insulating effect of a closed abdomen. A limitation of this study is that anatomical variations between patients were not taken into account, since a single geometry was used to simulate thermal distributions for different treatment strategies, which were compared to the thermal distributions of eleven patients that were presented in [Citation8]. However, on average, inter-patient variations in geometry would be expected to cancel each other out and not substantially affect the comparison. The measured minimum and maximum values in the different regions may be partially due to geometric variations. These variations may explain the discrepancy between the severe and mild cases compared to the minimum and maximum measured values, as shown in . Additional models are required to account for geometric variations. Ideally, patient-specific models should be generated based on the imaging of individual patients. At present, this is very time consuming and requires extensive post-processing and would therefore not be clinically feasible. Instead, as an alternative, standard patient models could be categorized based on characteristics such as BMI or body-surface area. Although this may affect the clinical validation of cases #1–3, the comparison between the experimental cases is not substantially affected by the use of a single realistic patient geometry. By eliminating inter-patient variation, the differences in thermal distribution found are purely due to variations in treatment strategy, which is important for determining the effects of different treatment strategies.
Furthermore, the complexity and size of the patient model required for HIPEC simulations demanded several simplifications. In EquationEquation (6)(6)
(6) , only a diffusive term was included and an apparent diffusion coefficient was used to account for chemotherapeutic transport by convection and diffusion. In tumor nodules, convection drives the chemotherapeutic agents outward because of increased interstitial fluid pressure. In healthy peritoneal tissue, however, the direction of the interstitial flow cannot be determined. The use of an apparent diffusion coefficient is therefore a justified approximation. In addition, the parameters governing the transport of chemotherapeutic agents are not well understood and are difficult to measure experimentally. The literature values for reported hydraulic conductivity
capillary surface area to volume ratio
and vascular permeability
vary widely and are often estimated based on experimental work with other, larger molecules that are easier to track [Citation23,Citation25]. Specifically, the values used for apparent diffusion coefficient and permeability are based on experimental work using dextran as a trace molecule with a molecular weight varying between 3.500 and 200.000 g/mol [Citation24]. Values are then extrapolated to the molar weight of chemotherapeutic agents
Because of these assumptions, approximations, and extrapolations, simulated tissue concentrations and systemic chemotherapeutic agents should be interpreted as a qualitative estimation. Nevertheless, despite these uncertainties, the temperature distribution in the peritoneal cavity can still be simulated quite accurately.
Another simplification is that the model used in this study was designed with stationary organs, and the mesentery was disregarded. This was required because of model complexity and computational costs. Nonetheless, these modifications can potentially impact the anticipated flow patterns in the peritoneal cavity. To improve heat dispersion, it is commonly recommended to massage the abdomen during HIPEC, and this technique was not included in the simulations. It should be noted, however, that original flow patterns can swiftly reoccur after a reset, rendering the effects of massaging only short-term. In addition, Rettenmaier et al. demonstrated that manual agitation of the abdomen did not produce a significant change in thermal distributions [Citation8].
The thermal module of the software implemented in this study underwent testing and validation under two controlled experimental settings for both natural and forced convection. For natural convection, the software accurately predicted the thermal profile within a 0.2 °C deviation for the temperature range applicable to hyperthermia treatments [Citation38]. Furthermore, the software exhibited an accuracy of 0.5 °C in steady-state situations, as demonstrated in a dedicated 3D-printed phantom including peritoneal structures [Citation19]. To further ensure the credibility of the software for clinical use, a broad range of experiments, such as the Verification and Validation (V&V) 40 standard recommended by the American Society of Mechanical Engineers (ASME) [Citation39], need to be conducted. As described in AME VVUQ 40, credibility requirements are determined by model risk, which is established by decision consequence and model influence. Although the model risk is relatively low for this application, credibility evaluation via grid and sensitivity analyses remains quite relevant. Due to the complexity of the model, further grid refinement is currently impractical since the computation time for the model in this study was already approximately one week on a AMD Ryzen Threadripper 1950X CPU (3.4 GHz, 40MB cache, sTR4). A grid analysis and mesh independence study requires significantly better computing power, which is currently unfeasible, but may in future studies be conducted through additional parallelization or faster GPU calculations. Furthermore, since this model involves a large number of parameters, a parameter sensitivity study is necessary to guarantee model credibility. Ongoing studies exploring both approaches aim to ensure the safe clinical application of the software.
Several clinically relevant results were presented in this study. In , we have shown that reversing the flow direction can increase the peritoneal surface area that is treated with adequate therapeutic temperatures >41 °C while helping to reduce high thermal doses that could lead to thermal injury. In current clinical practice, flow reversal is primarily used to relieve flow obstruction. Reverse flow in the absence of obstruction may result in occlusion at the new outlet and should be done with caution. Additional catheters may also be an effective way to improve homogeneity, as was shown in a rat model in [Citation18]. However, the results presented in this study show that a sufficiently high flow rate is equally important for the optimal treatment of a human peritoneum. The catheters used in this study were placed at the extremities of the peritoneal cavity, maximizing the distance between inflow and outflow. Theoretically, this would result in a more homogeneous flow pattern. However, the four-inflow approach (Case #5) resulted in significantly less coverage. This can be seen in and , which show approximately 12% less surface-reaching 41 °C and almost no thermal enhancement for 10% of the surface. This can be explained by the lower flow rate per catheter, which greatly reduces the size of the effective flow area per catheter. Using a higher flow rate for all four catheters (Case #6) resulted in a significantly better distribution, emphasizing that adding catheters should be accompanied by maintaining a high flow rate per catheter, resulting in an increase in total volumetric flow rate.
High thermal doses can cause undesired (permanent) thermal injury to normal tissue. The threshold for this thermal dose is highly species and tissue dependent. Experimental data have been collected mostly in small animals, occasionally in large animals and sporadically in humans [Citation12]. This makes it difficult to define a clinical threshold above which thermal injury occurs. In addition, data collected in small animals are difficult to translate to humans. In a small animal, it is relatively easy to heat a certain tissue uniformly, which allows for accurate determination of the thermal dose thresholds. In humans, especially during HIPEC, an organ is not uniformly heated and large thermal gradients can occur across tissues, resulting in large variations in thermal doses, making it difficult to determine clear relationships between thermal dose and thermal damage. The software presented in this study is able to provide detailed predictions of thermal dose distributions on the peritoneal surface and in the peritoneal organs. If a small surface or volume is treated with an excessive thermal dose, thermal damage will most likely not occur. Therefore, we have adapted a more robust measure using the dose, where 10% of a volume or surface is treated with a thermal dose above this value, as used in EquationEquation (17)
(17)
(17) . Experimental data are available that provide CEM43 dose values that have resulted in thermal damage. These thresholds are summarized and used by van Rhoon et al. to provide guidelines that should result in ‘no or minimal risk’ of adverse effects, specifically for the use of magnetic resonance (MR) systems. For rodents and other small animals, a lower limit of CEM43 = 2 min (eye lens) may already result in thermal damage. Considering only large(r) animals, this lower limit increases toward CEM43 = 9 min (brain). Both limits have been used to define maximum CEM43 exposures for patients with compromised and uncompromised thermoregulation, respectively [Citation40]. For the application of HIPEC, all non-peritoneal tissues can be excluded to define similar guidelines. Including only peritoneal tissues, a lower limit of CEM43 = 7 min (spleen) and CEM43 = 10 min (liver) was found for small and large animals, respectively. If we compare this value with the curves shown in , we see that the severe treatment strategy significantly exceeds this value and would probably cause thermal injury. The percentage that reached 41 °C during treatment is also at a maximum for this approach. To achieve a similar coverage, while limiting the risk of thermal damage, the step-up and step-down approaches were tested.
In a step-up or step-down approach, a treatment is followed or preceded by a thermal boost using high temperatures. Like the studies discussed in the introduction, most experimental studies have combined radiotherapy or brachytherapy with hyperthermia by immersing the tumor in the hind leg of a rodent in a heated water bath [Citation13–15]. Both the radiotherapy/brachytherapy and the application of hyperthermia are almost instantaneous in these animal models, where both treatment temperature and treatment dose are established rather quickly. This is also because of the small size of the tumor. The dynamics during a HIPEC treatment are very different from this approach. To compare these experimental studies with step-up and step-down heating in HIPEC, we need to define a ‘starting point’ for the treatment to see if the thermal boost precedes or follows this ‘starting point’. During HIPEC, drug penetration is slow and tissue concentrations increase almost linearly with time during a HIPEC treatment, reaching a maximum at the end of HIPEC or even later [Citation41]. Since tissue concentrations are highest near the end of HIPEC delivery, the logical ‘starting point’ of treatment will be near the end of HIPEC. Therefore, a step-down approach during a HIPEC treatment will result in applying a thermal boost when drug concentrations in tissue are still low, effectively creating an interval between the thermal boost and the logical ‘starting point’ of the treatment. With a step-up approach during HIPEC, the thermal boost is applied near the end of HIPEC, just before or at the ‘starting point’ of the treatment. A step-up approach during HIPEC thus mimics the characteristics of a step-down approach as used in in vivo experiments combining radiation and water bath immersion.
The timing of the thermal boost would suggest that the step-up approach used in this study (Case #8) may be more effective. Furthermore, the results presented in this study suggest that a step-down approach results in an undesirably higher volumetric thermal dose to all organs (see ) while achieving similar coverage (see ). The values for organs such as the transverse colon and stomach are well above the thresholds at which thermal injury has been reported in the literature, suggesting a risk of thermal damage. Considering both experimental studies and the results presented in this study, step-up heating would be preferable to step-down heating for HIPEC applications. When a thermal boost is given at the end of HIPEC, a moderate hyperthermia treatment is not given afterwards. Whether this moderate hyperthermic extension is necessary to achieve the positive effects of step-down heating would be useful to investigate further in preclinical HIPEC-specific experiments. The software tool presented in this study may help assist in the further design of in vivo experiments needed to determine the best strategies for applying step-up heating.
The thermal enhancement of chemotherapeutic agents is highly dependent on the tumor cell type and the type of chemotherapy used. Combining all possible cell types and all chemotherapeutic agents that can be used during HIPEC would result in an enormous amount of experimental work. Although in vitro experiments are not fully representative of clinical situations because they lack the tumor microenvironment and interaction with surrounding tissues, they do provide a relatively inexpensive model and a well-controlled environment to accurately quantify the potential for thermal enhancement. For , we have adapted data from Helderman et al. [Citation4] to visualize the importance of patient-specific optimization. The TER curves can have different shapes (see ), resulting in different TER distributions for the same thermal distributions. Ideally, a robust treatment strategy should be used that produces homogeneous TER distributions for all TER curve types. Case #6 was able to produce homogeneous and high thermal enhancement distributions and should be regarded as the optimal setup considered in this study. However, the use of an optimized setup may not be possible due to clinical feasibility issues or other circumstances during treatment. Therefore it is important to incorporate preclinical in vitro data to obtain an estimate of the extent to which TER heterogeneities might have occurred during HIPEC. The software presented in this study can be used to generate a library of thermal distributions based on treatment and patient characteristics such as catheter setup, flow rate, inflow temperature, and patient geometry (e.g., based on BMI). Preclinicial data can be used to generate TER distributions based on chemotherapy type and tumor pathology. Once an optimal treatment strategy has been selected, extensive thermometry can help to ensure proper delivery. General locations where hot or cold spots may occur could be identified from the library of plans. Thermal monitoring at these locations during treatment can be helpful to improve the homogeneity of the steady-state temperature distribution. The generation of such a library of treatment plans, clinical testing, and sensitivity analysis are the next steps in translating the software into clinical use.
Conclusion
In this study, simulated temperature and drug distributions in the peritoneal cavity were compared with clinical data from HIPEC treatments to evaluate the impact of different treatment strategies on thermal and drug distributions and the risk of thermal injury. Thermal distributions, plasma concentration, and core body temperature compared well with clinical data for mild, moderate, and severe treatment strategies. The evaluation of different treatment strategies showed that the use of additional catheters is an excellent tool to increase treatment homogeneity, provided that the flow rates per catheter are sufficiently high. The use of high inflow temperatures may result in thermal damage that could be avoided by more advanced heating strategies such as step-up and step-down heating. Step-up and step-down heating approaches can result in high treatment temperatures while limiting the risk of thermal damage. The treatment planning software can be used to generate a library of treatment plans to help optimize HIPEC treatments.
Disclosure statement
No potential conflict of interest was reported by the author(s).
Data availability statement
The raw data supporting the conclusions of this article will be made available by the authors upon request.
Additional information
Funding
References
- Li X-F, Carlin S, Urano M, et al. Visualization of hypoxia in microscopic tumors by immunofluorescent microscopy. Cancer Res. 2007;67(16):7646–7653.
- Verwaal V, van Ruth S, de Bree E, et al. Randomized trial of cytoreduction and hyperthermic intraperitoneal chemotherapy versus systemic chemotherapy and palliative surgery in patients with peritoneal carcinomatosis of colorectal cancer. J Clin Oncol. 2003;21(20):3737–3743.
- Baronzio GF, Seta RD, D’Amico M, et al. Effects of local and whole body hyperthermia on immunity. Austin (TX): Landes Bioscience; 2000–2013.
- Helderman RF, Löke DR, Verhoeff J, et al. The temperature-dependent effectiveness of platinum-based drugs mitomycin-c and 5-fu during hyperthermic intraperitoneal chemotherapy (hipec) in colorectal cancer cell lines. Cells. 2020;9(8):1775.
- Oei AL, Vriend LEM, Crezee J, et al. Effects of hyperthermia on DNA repair pathways: one treatment to inhibit them all. Radiat Oncol. 2015;10:165.
- Overgaard J. Formula to estimate the thermal enhancement ratio of a single simultaneous hyperthermia and radiation treatment. Acta Radiol Oncol. 1984;23(2–3):135–139.
- Urano M, Ling CC. Thermal enhancement of melphalan and oxaliplatin cytotoxicity in vitro. Int J Hyperthermia. 2002;18(4):307–315.
- Rettenmaier MA, Mendivil AA, Gray CM, et al. Intra-abdominal temperature distribution during consolidation hyperthermic intraperitoneal chemotherapy with carboplatin in the treatment of advanced stage ovarian carcinoma. Int J Hyperthermia. 2015;31(4):396–402.
- Ceelen W, De Somer F, Van Nieuwenhove Y, et al. Effect of perfusion temperature on glucose and electrolyte transport during hyperthermic intraperitoneal chemoperfusion (HIPEC) with oxaliplatin. Eur J Surg Oncol. 2013;39(7):754–759.
- Schaaf L, van der Kuip H, Zopf W, et al. A temperature of 40 °C appears to be a critical threshold for potentiating cytotoxic chemotherapy in vitro and in peritoneal carcinomatosis patients undergoing HIPEC. Ann Surg Oncol. 2015;22(Suppl 3):S758–S765.
- Quénet F, Elias D, Roca L, et al. Cytoreductive surgery plus hyperthermic intraperitoneal chemotherapy versus cytoreductive surgery alone for colorectal peritoneal metastases (PRODIGE 7): a multicentre, randomised, open-label, phase 3 trial. Lancet Oncol. 2021;22(2):256–266.
- Yarmolenko PS, Moon EJ, Landon C, et al. Thresholds for thermal damage to normal tissues: an update. Int J Hyperthermia. 2011;27(4):320–343.
- Lindegaard JC, Grau C, Overgaard J. Effect of step-down heating on the interaction between heat and radiation in a C3H mammary carcinoma in vivo. Int J Radiat Biol. 1991;60(4):707–721. PMID: 1680149.
- Hiraoka M, Miyakoshi J, Jo S, et al. Effects of step-up and step-down heating on a transplantable murine tumor. Jpn J Cancer Res. 1986;77(11):1102–1106.
- Jones EL, Douple EB. Effect of step-down heating on brachytherapy in a murine tumor system. Radiat Res. 1990;124(2):141–146.
- Weller HG, Tabor G, Jasak H, et al. A tensorial approach to computational continuum mechanics using object-oriented techniques. Comput Phys. 1998;12(6):620–631.
- Löke DR, Helderman RFCPA, Sijbrands J, et al. A four-inflow construction to ensure thermal stability and uniformity during hyperthermic intraperitoneal chemotherapy (HIPEC) in rats. Cancers. 2020;12(12):3516.
- Löke DR, Helderman RFCPA, Rodermond HM, et al. Demonstration of treatment planning software for hyperthermic intraperitoneal chemotherapy in a rat model. Int J Hyperthermia. 2021;38(1):38–54.
- Löke DR, Kok HP, Helderman RFCPA, et al. Validation of thermal dynamics during hyperthermic intraperitoneal chemotherapy simulations using a 3D-printed phantom. Front Oncol. 2023;13:1102242
- OpenFoamWiki. 2020. Available from: https://openfoamwiki.net/index.php/chtmultiregionfoam.
- Hasgall P, Di Gennaro F, Baumgartner C, et al. IT’IS database for thermal and electromagnetic parameters of biological tissues. Version 4.1, February 22. 2022.
- Valvano JW. Bioheat transfer. In: Encyclopedia of medical devices and instrumentation. New Jersy: John Wiley; 2006.
- Jain RK. Transport of molecules in the tumor interstitium: a review. Cancer Res. 1987;47(12):3039–3051.
- Nakamura Y, Wayland H. Macromolecular transport in the cat mesentery. Microvasc Res. 1975;9(1):1–21.
- Baxter LT, Jain RK. Transport of fluid and macromolecules in tumors I. Role of interstitial pressure and convection. Microvasc Res. 1989;37(1):77–104.
- Steuperaert M, Labate GFD, Debbaut C, et al. Mathematical modeling of intraperitoneal drug delivery: simulation of drug distribution in a single tumor nodule. Drug Deliv. 2017;24(1):491–501.
- Mahteme H, Wallin I, Glimelius B, et al. Systemic exposure of the parent drug oxaliplatin during hyperthermic intraperitoneal perfusion. Eur J Clin Pharmacol. 2008;64(9):907–911.
- Sessler D. Perioperative heat balance. Anesthesiology. 2000;92(2):578–596.
- Segars WP, Sturgeon G, Mendonca S, et al. 4D XCAT phantom for multimodality imaging research. Med Phys. 2010;37(9):4902–4915.
- Ackerman MJ. The visible human project: a resource for anatomical visualization. Stud Health Technol Inform. 1998;52(Pt 2):1030–1032.
- de Jong LAW, Elekonawo FMK, Lambert M, et al. Wide variation in tissue, systemic, and drain fluid exposure after oxaliplatin-based HIPEC: results of the GUTOX study. Cancer Chemother Pharmacol. 2020;86(1):141–150.
- The OpenFOAM Foundation. OpenFOAM user guide Vol. v2112. Berkshire, England: OFBC; 2022. Available from: https://www.openfoam.com/documentation/guides/latest/doc/index.html
- Goldenshluger M, Zippel D, Ben-Yaacov A, et al. Core body temperature but not intraabdominal pressure predicts postoperative complications following closed-system hyperthermic intraperitoneal chemotherapy (HIPEC) administration. Ann Surg Oncol. 2018;25(3):660–666.
- Hendrix RJ, Kassira JP, Lambert LA. Elevated maximum core body temperature during hyperthermic intraperitoneal chemoperfusion (HIPEC) is associated with increased postoperative complications. Ann Surg Oncol. 2020;27(1):232–239.
- Ba M, Cui S, Long H, et al. Safety and effectiveness of high-precision hyperthermic intraperitoneal perfusion chemotherapy in peritoneal carcinomatosis: a real-world study. Front. Oncol. 2021;11:674915
- Kamal JM, Elshaikh SM, Nabil D, et al. The perioperative course and anesthetic challenge for cytoreductive surgery with hyperthermic intraperitoneal chemotherapy. Egypt J Anaesth. 2013;29(4):311–318.
- Halkia E, Tsochrinis A, Vassiliadou D, et al. Peritoneal carcinomatosis: intraoperative parameters in open (coliseum) versus closed abdomen HIPEC. Int J Surg Oncol. 2015;2015:610597.
- Schooneveldt G, Löke DR, Zweije R, et al. Experimental validation of a thermophysical fluid model for use in a hyperthermia treatment planning system. Int J Heat Mass Transf. 2020;152:119495.
- ASME. Assessing credibility of computational modeling through verification and validation: application to medical devices. ASME Standard, V&V 40. New York (NY): American Society of Mechanical Engineers; 2018.
- van Rhoon GC, Samaras T, Yarmolenko PS, et al. Cem43 °c thermal dose thresholds: a potential guide for magnetic resonance radiofrequency exposure levels? Eur Radiol. 2013;23(8):2215–2227.
- Petersen EK, Bue M, Harlev C, et al. Abdominal tissue concentrations and penetration of carboplatin in a HIPEC procedure – assessment in a novel porcine model. Pleura Peritoneum. 2022;7(3):117–125.
- Koemans W, van der Kaaij R, Wassenaar E, et al. Systemic exposure of oxaliplatin and docetaxel in gastric cancer patients with peritonitis carcinomatosis treated with intraperitoneal hyperthermic chemotherapy. Eur J Surg Oncol. 2021;47(2):486–489.
- Zivanovic O, Abramian A, Kullmann M, et al. HIPEC ROC I: a phase I study of cisplatin administered as hyperthermic intraoperative intraperitoneal chemoperfusion followed by postoperative intravenous platinum-based chemotherapy in patients with platinum-sensitive recurrent epithelial ovarian cancer. Int J Cancer. 2015;136(3):699–708.