
 ?Mathematical formulae have been encoded as MathML and are displayed in this HTML version using MathJax in order to improve their display. Uncheck the box to turn MathJax off. This feature requires Javascript. Click on a formula to zoom.
Abstract
Purpose
The heating characteristics of water-filtered infrared-A (wIRA) radiation were investigated in vivo in two body regions of healthy humans according to the quality standards of the European Society for Hyperthermic Oncology (ESHO) using an irradiance (infrared-A) of 146 W m−2 as recommended for clinical superficial hyperthermia (HT).
Methods
wIRA was applied to the abdominal wall and lumbar region for 60 min. Skin surface temperature was limited to ≤43 °C. Tissue temperatures were measured invasively at 1-min intervals before, during and after wIRA exposure using five fiber-optical probes at depths of 1–20 mm.
Results
Significant differences between body regions occurred during the heating-up phase at depths of 5–15 mm. Thermal steady states were reached at depths ≤5 mm after exposures of 5–6 min, and ≤20 mm after 20 min. On average, the minimum requirements of ESHO were exceeded in both regions by the following factors: ≈3 for the heating rate, ≈2 for the specific absorption rate and ≈1.4 for the temperature rise. Tissue depths with T90 ≥ 40 °C and T50 > 41 °C were ≤10 mm, and ≤20 mm for Tmax ≤ 43 °C. The temperature decay time after termination of irradiation was 1–5 min. Corresponding temperatures were ≤42.2 °C for CEM43 and ≤41.8 °C for CEM43T90, i.e., they are inadequate for direct thermal cell killing.
Conclusions
Thermography-controlled wIRA-HT complies with the ESHO criteria for superficial HT as a radiosensitizer and avoids the risk of thermal skin toxicity.
1. Introduction
Localized mild hyperthermia using water-filtered infrared-A (wIRA-HT) radiation has been shown to be a potent radiosensitizer for superficial cancers and an effective treatment modality in dermatology, regenerative medicine, neurology, infectiology and physical therapy. Depending on the therapeutic aim, different steady state temperatures at different tissue depths are required (steady state temperatures between 38 and 43 °C for 30–60 min [Citation1–12]). In these settings, overheating of the tissue to temperatures >43 °C and ‘critical’ exposure times are usually avoided to prevent heat pain and unintended toxicity [Citation13–15].
The physical and photobiological basics of wIRA-HT have been previously described with reference to human skin exposure in vivo [Citation16–19]. It has been shown that water-filtered infrared-A (wIRA) fits into the optical window of the human skin, regardless of skin color [Citation19]. As a highly relevant physiological effect with therapeutic potential, mild wIRA-HT significantly improves the oxygenation status in the human skin and subcutaneous tissue in vivo [Citation20,Citation21].
In an earlier study, thermal field formation in the skin and subcutis upon skin exposure to wIRA was assessed in anesthetized piglets [Citation22]. In a subsequent analysis [Citation23], these data were used to prove the accordance of wIRA-HT with the quality assurance criteria for superficial hyperthermia defined by the European Society for Hyperthermic Oncology (ESHO) [Citation24,Citation25]. However, the transferability of these data to humans is limited because of significant differences in body core temperature, skin and subcutis morphology and thermoregulatory properties [Citation26–33].
In this study, the kinetics, magnitude, depth distribution and persistence of tissue heating by wIRA exposure were examined in the abdominal wall and lumbar region of healthy volunteers, i.e., in two body regions that differ in thickness of skin and subcutis, sweat gland densities and thermoregulatory properties.
Skin irradiation was applied at irradiance and exposure times recommended for locoregional hyperthermia in combination with radiotherapy (RT). Data were used to evaluate wIRA-HT in clinical settings, with special emphasis on the quality criteria of ESHO.
2. Materials and methods
2.1. Volunteers
Three healthy volunteers (one female and two males; age, 35–49 years) were included in the study. Each subject was irradiated twice. The first irradiation was performed on the lower abdominal wall, and the second on the lumbar region with a time interval of >1 week.
2.2. wIRA irradiations
wIRA irradiation was carried out using the TWH 1500 hyperthermia system (Hydrosun, Müllheim, Germany) equipped with two wIRA radiators of type hydrosun 750, each with a cutoff filter, type BTE 595 (BTE Elsoff, Germany).
The spectral distribution of the radiation emitted by this device has been described earlier: 73.1% of the total emission is attributable to the range of infrared-A (IR-A, 780–1400 nm), 26.3% to the visible range (590–780 nm) and 0.6% to wavelengths <590 nm and to wavelengths >1400 nm [Citation22].
The thermal effects of wIRA radiators originate almost exclusively from the spectral range of IR-A and only to a negligible extent from visible radiation (VIS) and infrared-B (IR-B). To ensure comparability of thermal effects with those of wIRA radiators equipped with different cutoff filters and other IR-A radiators, dosages are based on irradiance in the IR-A range. According to the instructions for performing superficial wIRA-HT using radiators (type hydrosun 750) in the clinical setting, a distance of 32 cm was chosen between the center of the radiator exit window and the center of the treated skin surface. This distance corresponds to 146 mW cm−2 in the IR-A range, i.e., ≈200 mW cm−2 in the entire measured spectral range (380–1700 nm).
2.3. Temperature measurements
The temperatures of the skin and subcutaneous tissue were measured at intervals of 10 s and analyzed in steps of 1 min before, during wIRA irradiation and after termination of wIRA-HT until the starting temperatures were reached again.
Noninvasive skin surface temperature measurements were performed using a thermography camera (TWH 1500, Hydrosun, Müllheim, Germany). Tissue temperatures were assessed minimally invasively using five fiber-optic probes vertically inserted into the tissue at depths of 1, 5, 10, 15 and 20 mm. Deviating from this was the depth distribution of the probes in the abdominal wall of the third subject at 1, 5, 8, 12 and 18 mm. Probes used: type PSC-D-N-N-N with Opsens-ProSensModul PSR-G1-N-100ST-L and type OTG-M600-10-62ST-3 (OPTE-XN-00PIT-M1, Solton Laser- und Messtechnik, Gilching, Germany). The calibration procedure and invasive thermometry have been previously described in detail [Citation20–23].
The positioning of the fiber-optic probes within the treatment area of the abdominal wall (left) and in the lumbar region (right) is shown in Figure S1 in the Supplement.
2.4. General procedure
Each volunteer was irradiated with wIRA for a total duration of 60 min. Within this period, irradiation was interrupted automatically by the control loop system of TWH 1500 as soon as thermography detected a hotspot of ≥43 °C on the skin surface within the treatment area. Irradiation resumed automatically when skin surface temperature dropped to ≤42.5 °C. Treatment areas were approximately 15 cm × 25 cm.
Before, during and after the termination of wIRA irradiation, the volunteers were at rest and lay on a treatment couch. The treatment room had no air ventilation, and air temperatures were between 22 and 24 °C (for detailed information, see [Citation20,Citation21]).
2.5. Definitions and calculations
To quantify wIRA heating of the tissues of interest under in vivo conditions according to the ESHO quality assurance requirements for superficial hyperthermia [Citation24,Citation25], the following parameters were calculated as a function of exposure time and tissue depths: (a) heating rate (HR); (b) specific absorption rate (SAR); (c) temperature rise (TR) after 6 min of exposure and during the thermal steady state (TSS); (d) 10th, 50th and 100th percentiles of temperature data, and T90 and T50 as temperatures exceeded by 90% and 50% of temperature data measured during total exposure time and during TSS; (e) 100th percentile and of maximum temperature Tmax; (f) tissue depths related to T90 ≥ 40 °C and to T50 > 41 °C; (g) thermal dose (TD) expressed as cumulative thermal equivalent minutes at 43 °C (CEM43) calculated for tissue temperatures measured as a function of time within the exposure period and (h) TD expressed as CEM43T90 calculated by using data of T90 upon achieving TSS [Citation24,Citation25].
Data for exposure times to reach a TR of 6 K (ET6K) were provided as a function of tissue depth to evaluate the kinetics of heating.
HR was determined using the following equation:
(1)
(1)
where δT(d) defines the temperature increase (δT) at the skin surface (d = 0) and in the tissue as a function of depth (d) during the first minute of irradiation (δt = 1 min).
SAR was estimated as a function of tissue depth (d) and tissue type, according to Wust et al. [Citation34,Citation35]:
(2)
(2)
Specific heat capacity cp was chosen as cp = 3.662 W s g−1 K−1 for skin, cp = 2.387 W s g−1 K−1 for adipose tissue and cp = 3.639 W s g−1 K−1 for muscle tissue [Citation36–38]. EquationEquation (2)(2)
(2) is the first estimation of SAR, neglecting the thermal effect of perfusion through superficial blood vessels. Such effects are considered in more accurate models, such as Pennes’ bioheat equation [Citation34,Citation35,Citation39,Citation40].
Effective penetration depth (EPD) and thermal effective penetration depth (TEPD) are tissue depths where SAR has decreased to 50% of its value at 10 mm depth (EPD), and where TR has dropped to 50% of its value at 10 mm depth and after 6 min of exposure (TEPD). (Both properties refer to the maximum incident irradiance within the exposed skin area [Citation25].)
CEM43 converts the various time–temperature exposures applied during the treatment into an equivalent exposure time, expressed in minutes at a reference temperature of 43 °C. The calculations were performed according to [Citation41,Citation42]:
(3)
(3)
T(t,d) is the temperature measured at time t and depth d throughout the treatment, and δt = 1 min is the time step (R = 0.5 for T(t,d) > 43 °C and R = 0.25 for T(t,d) ≤ 43 °C).
In addition, CEM43T90 describes the thermal dose as cumulative equivalent minutes at 43 °C exceeded by 90% of temperature data [Citation43–45]. Because CEM43(d) depends on the heating-up time during the treatment [Citation42], the data for CEM43T90(d) were related to the part of total exposure time after achieving a thermal steady state (where tissue temperature mainly depends on depth, and calculated per time step (δt = 1 min):
(4)
(4)
Data for HR, SAR, TR, EPD, TEPD, ET6K, CEM43, CEM43T90 and percentiles are presented as mean values and standard deviations (SD) and are fitted as functions of tissue depth using polynomial regressions. The differences between the abdominal wall and the lumbar region were checked for significance using Student’s t-test (significance level = 5%) [Citation46–48].
3. Results
3.1. Tissue temperatures as a function of tissue depth and of irradiation time
Before starting the wIRA exposure, no significant temperature differences between abdominal wall and lumbar region were registered at the skin surface (33.7 ± 0.8 vs. 31.7 ± 3.2 °C), and at 20 mm tissue depth (35.8 ± 0.3 vs. 35.2 ± 0.8 °C). Tissue temperatures increased almost linearly with depth and showed mean gradients of ≈0.10 vs. ≈0.17 K mm−1 (, curve 0).
Figure 1. Skin surface temperatures (‘depth’ = 0 mm), and temperatures at different tissue depths of the lower abdominal wall (panel A) and in the lumbar region (panel B) of healthy volunteers before wIRA heating (curve 0, black dots) and upon wIRA exposure times of 1 min (curve 1, green squares), 2 min (curve 2, green upward triangles), 4 min (curve 3, green downward triangles), 6 min (curve 4, blue diamonds), 10 min (curve 5, blue stars), 15 min (curve 6, blue hexagons) and 20–60 min (curves 7–9, red dots). Irradiance = 146 mW cm−2 (IR-A). Values are means ± SD.
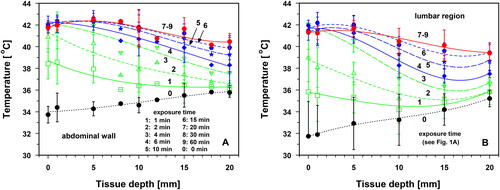
Immediately after the start of wIRA irradiation, the mean temperature increased in both body regions, depending on the exposure time and tissue depth (). During the first minute of exposure, the differences in the temperature rise between the two body regions were not significant. However, before thermal steady states (TSS) were reached after 15–20 min, the temperature rise by conductive heat transfer was significantly greater at a depth of 1–15 mm in the abdominal wall than at the corresponding depths in the lumbar region (p < 0.035; , curves 1–6).
Figure 2. Skin surface and tissue temperatures in the lower abdominal wall (panel A) and in the lumbar region (panel B) as a function of exposure time using an irradiance of 146 mW cm−2 (IR-A). measurements performed on the skin surface (curve 1, black squares), and at tissue depths of 1 mm (curve 2, red upward triangles), 5 mm (curve 3, blue downward triangles), 10 mm (curve 4, green hexagons), 15 mm (curve 5, blue diamonds) and 20 mm (curve 6, red stars). Dotted line: lower level of mild hyperthermia (=39 °C). Values are means ± SD.
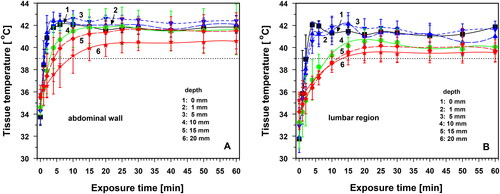
Statistically comparable heating kinetics in both body regions were found: (a) at 5 mm depth after 6 min of exposure, (b) at 20 mm depth during the entire exposure time, (c) at depths of 5–20 mm and exposure times ≥20 min and (d) on the skin surface and at all tissue depths (1–20 mm) and exposure times ≥25 min. This observation correlates with the occurrence of thermal steady states (TSS) in both body regions after ≈15 min of exposure at depths of 5–10 mm, and after ≈20 min at 15 mm depth. For this reason, the temperature profiles for irradiation times of 20–60 min coincide (, curves 7–9). Differences in TSS temperatures between the body regions were not significant.
After 20 min of irradiation, significant differences between the mean temperatures in the two body regions were observed on the skin surface and in the tissue depth of 1 mm (p < 0.05). This difference was evident only for a period of approximately 5 min and was caused by the earlier start of thermoregulation in the lumbar region than in the abdominal wall (, curves 7–9). Due to this situation, data from both body regions were pooled in in order to assess the characteristics of the heating, their evaluation according to the quality criteria of the ESHO for adequate superficial hyperthermia [Citation24,Citation25], and the time of temperature decay after termination of wIRA exposure.
3.2. Correlation between skin surface and tissue temperatures during wIRA heating
Thermography allows surface temperature mapping of the entire treatment field. The values were correlated to estimate the depth range in which thermography reflects tissue temperature. As shown in , the skin surface temperature and tissue temperature were highly correlated up to a depth of 5 mm in both body regions (r ≥ 0.86). Tissue temperatures varied by up to ±1 K from the synchronously measured skin surface temperatures at 1 mm depth and up to ±2 K at 5 mm depth. As can be seen from the data presented in , negative deviations occurred during the heating-up phase (curves 1–4), whereas positive deviations were observed during TSS, caused by thermoregulation in the near-surface skin layer (curves 7–9).
Figure 3. Temperatures at tissue depths of 1 mm (panel A), 5 mm (panel B), 10 mm (panel C) and 20 mm (panel D) in the lower abdominal wall (blue squares) and in the lumbar region (red dots) compared to corresponding skin surface temperatures during wIRA skin exposure using an irradiance of 146 mW cm−2 (IR-A). Central broken line: line of identity; dotted 1 and 2 K lines: deviations from identity of 1 and 2 K.
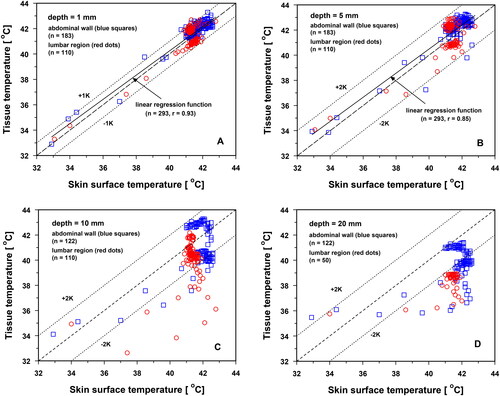
Tissue temperatures and skin surface temperatures were intermittently decoupled at depths of 10 and 20 mm during the heating-up period (). After reaching the TSS, tissue temperatures at 10 mm depth varied individually by up to ±2 K from the corresponding skin surface temperatures and were up to approximately 2 K lower at 20 mm depth ().
3.3. wIRA exposure times necessary to reach tissue temperatures of 39 °C
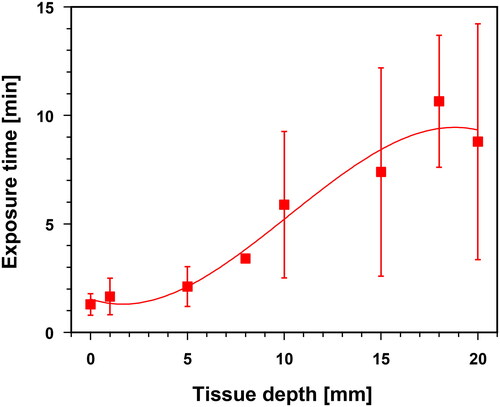
Using a wIRA irradiance of 146 mW cm−2, exposure times of ≈1.5–2.0 min are required in both body regions to reach hyperthermia (HT) levels of 39 °C (i.e., lower temperature level of mild hyperthermia) in tissue depths up to 5 mm. The necessary exposure time increased with tissue depth, reaching approximately 8–10 min at 20 mm (). It should be noted that the standard deviations of the data significantly increased at depths ≥10 mm. Therefore, the individual heating times under these conditions can deviate substantially from the mean values.
Figure 4. Exposure times needed to reach a hyperthermia level of 39 °C (lower limit of mild hyperthermia) as a function of tissue depth in the lower abdominal wall and in the lumbar region during wIRA skin exposure with an irradiance of 146 mW cm−2 (IR-A). Values are means ± SD. Line: best polynomial fit.
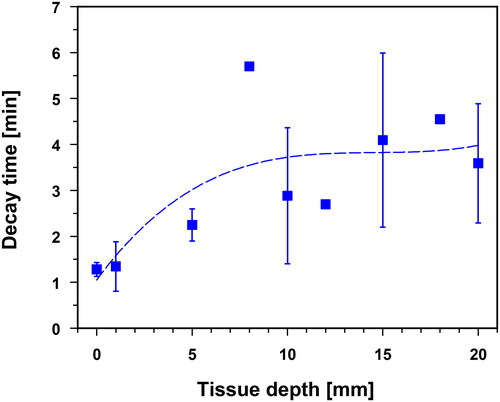
3.4. Decay time to reach tissue temperatures of 39 °C after termination of wIRA exposure
The tissue temperature decay times shown in were measured in uncovered skin (i.e., without thermal skin insulation) after the termination of wIRA skin exposure. On average, the temperature dropped to 39 °C within ≈1–2 min up to a tissue depth of 5 mm. At depths of up to 20 mm, the respective mean decay times were up to 3.5 min. However, the standard deviations increased significantly at depths ≥10 mm, i.e., individual decay times deviated substantially from the reported mean values.
Figure 5. Decay times to reach tissue temperatures of 39 °C (i.e., lower level of mild hyperthermia) after termination of wIRA-HT as a function of tissue depth in the lower abdominal wall and in the lumbar region (uncovered skin, without thermal isolation). Values are means ± SD. Line: best polynomial fit.
3.5. Characteristics of tissue heating upon wIRA-hyperthermia according to ESHO
3.5.1. Heating rate, SAR and EPD
According to the ESHO quality criteria for adequate tissue heating in superficial tissue hyperthermia, values of HR ≥ 1 K min−1 and SAR ≥ 60 mW g−1 are required after the first minute of irradiation at a reference tissue depth of 5 mm [Citation25]. Both criteria were met for both body regions. At 5 mm depth, HR was 3.0 ± 1.1 K min−1, and SAR was 121.0 ± 44.0 mW g−1. Mean HR ≥ 1 K min−1 and mean SAR ≥ 60 mW g−1 were proven up to tissue depths of 13–14 mm after 1 min of wIRA skin exposure using 146 mW cm−2 (IR-A; and ). The EPD reached a depth of approximately 18 mm ().
Figure 6. Heating rates (HR) in the lower abdominal wall and in the lumbar region as a function of tissue depth after 1 min of wIRA skin exposure using an incident irradiance of 146 mW cm−2 (IR-A). Solid line: best polynomial fit. Dotted horizontal line: lower limit of the ESHO-criterion HR ≥ 1 K min−1 for adequate superficial hyperthermia [Citation25]. Values are means ± SD.
![Figure 6. Heating rates (HR) in the lower abdominal wall and in the lumbar region as a function of tissue depth after 1 min of wIRA skin exposure using an incident irradiance of 146 mW cm−2 (IR-A). Solid line: best polynomial fit. Dotted horizontal line: lower limit of the ESHO-criterion HR ≥ 1 K min−1 for adequate superficial hyperthermia [Citation25]. Values are means ± SD.](/cms/asset/c9789d29-45d4-4564-8251-59394fd7d56f/ihyt_a_2244208_f0006_c.jpg)
Figure 7. Specific absorption rates (SAR) in the lower abdominal wall and in the lumbar region as a function of tissue depth after 1 min of wIRA skin exposure using an incident irradiance of 146 mW cm−2 (IR-A). Solid line: best polynomial fit. Dotted horizontal line: lower limit of the ESHO-criterion SAR ≥ 60 mW g−1 for adequate superficial hyperthermia [Citation25]. Values are means ± SD.
![Figure 7. Specific absorption rates (SAR) in the lower abdominal wall and in the lumbar region as a function of tissue depth after 1 min of wIRA skin exposure using an incident irradiance of 146 mW cm−2 (IR-A). Solid line: best polynomial fit. Dotted horizontal line: lower limit of the ESHO-criterion SAR ≥ 60 mW g−1 for adequate superficial hyperthermia [Citation25]. Values are means ± SD.](/cms/asset/bdd33105-96d8-45cb-a8f2-6db1dd13a83c/ihyt_a_2244208_f0007_c.jpg)
Considering that the heating rates originate from the period in which conductive heat transport by generated temperature gradients and thermoregulation by increased blood flow can be neglected, the data shown in confirm the effectiveness and extent of direct tissue heating using wIRA irradiation in human tissues [Citation19].
3.5.2. TR and TEPD
Temperature rises at different exposure times and different tissue depths (), and temperature changes within selected time intervals of the total exposure time () are shown for an incident irradiance of 146 mW cm−2. Mean increases in temperature were up to ≈9 K at the skin surface and in the skin after reaching TSS, and decreased continuously in the subcutis to ≈4.3 K at a tissue depth of 20 mm (, curves 7 and 8).
Figure 8. Temperature rises (TR) as a function of tissue depth after exposure times of 1 min (curve 1, green squares), 2 min (curve 2, green upward triangles), 4 min (curve 3, green downward triangles), 6 min (curve 4, red squares), 10 min (curve 5, blue upward triangles), 15 min (curve 6, blue downward triangles) and 20–60 min (curves 7–8, red diamonds). Dotted horizontal line: lower limit of the criterion TR ≥ 6 K for adequate superficial hyperthermia according to ESHO after 6 min of exposure [Citation25]. Values are means ± SD.
![Figure 8. Temperature rises (TR) as a function of tissue depth after exposure times of 1 min (curve 1, green squares), 2 min (curve 2, green upward triangles), 4 min (curve 3, green downward triangles), 6 min (curve 4, red squares), 10 min (curve 5, blue upward triangles), 15 min (curve 6, blue downward triangles) and 20–60 min (curves 7–8, red diamonds). Dotted horizontal line: lower limit of the criterion TR ≥ 6 K for adequate superficial hyperthermia according to ESHO after 6 min of exposure [Citation25]. Values are means ± SD.](/cms/asset/480c6abb-d4f2-4a66-a0fc-0937182efbc9/ihyt_a_2244208_f0008_c.jpg)
Figure 9. Mean temperature changes ΔT(Δt) as a function of tissue depth (lower abdominal wall, lumbar region) assessed for the following exposure times: up to 1st min (curve 1, green squares), 1st–2nd min (curve 2, green upward triangles), 2nd–4th min (curve 3, green downward triangles), 4th–6th min (curve 4, red squares), 6th–10th min (curve 5, blue upward triangles), 10th–15th min (curve 6, blue downward triangles), 15th–20th min (curve 7, red diamonds) and 25th–30th min (curve 8, stars). Irradiance: 146 mW cm−2 (IR-A). Horizontal parting line: limit between temperature increase (positive values) and temperature decrease (negative values).
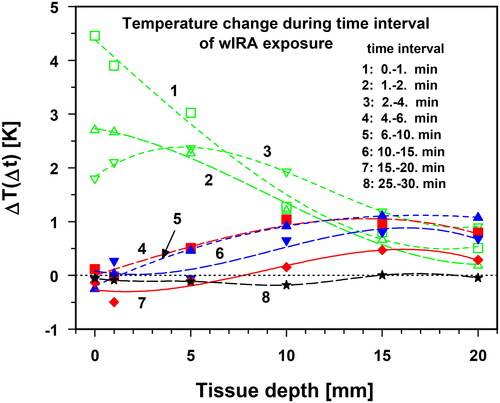
During the first 2 min of exposure, the temperature rise was maximal, but was mainly confined to the skin layer and then steadily decreased with depth (, curves 1 and 2). However, starting from the second to fourth minute, the maximum increase in temperature no longer occurred on the skin surface but at a depth of 5 mm, probably due to the onset of thermoregulation in the skin (, curve 3). With increasing exposure time, the maximum temperature increase shifted deeper into the tissue, however, with decreasing amplitude, because of a more effective thermoregulation in the upper layers and decreasing temperature gradients (, curves 4–6). Thus, the maximum temperature increase was measured after 15–20 min at a depth of 15 mm with a smaller amplitude (, curve 7). Finally, curve 8 in indicates the end of the temperature change as a result of reaching TSS.
During the heating phase, the ESHO quality criterion for adequate heating (TR values ≥6 K after 6 min of irradiation [Citation25]) was exceeded up to depths of ≈9 mm (, curve 4). Upon reaching TSS, the mean TR values exceeded 6 K up to a depth of 15 mm (, curves 7 and 8). TEPD reached a depth of approximately 16 mm.
To quantify the kinetics of the temperature rise at different tissue depths, shows the exposure times required to obtain TR values of 6 K (ET6K). The mean ET6K values ranged from 2 to 6 min up to tissue depths of 10 mm and increased to about 20 min at a depth of 15 mm.
Figure 10. Exposure times needed to achieve temperature rises of 6 K (ET6K) in the abdominal wall and in the lumbar region as a function of tissue depth upon wIRA skin exposure using an incident irradiance of 146 mW cm−2 (IR-A). Values are means ± SD. Line: best polynomial fit.

3.5.3. Thermal dose
To quantify the thermal doses achieved in the tissue during mild hyperthermia in clinical settings, tissue temperatures T90, T50 and Tmax for a specified duration, and CEM43 and CEM43T90 are recommended by ESHO [Citation24].
T90, T50 and Tmax were derived from the 10th, 50th and 100th percentiles of tissue temperature data assessed at 1-min intervals during exposure time and were defined by tissue temperatures at which 10%, 50% and 100% of data showed smaller values, whereas Tmax defines maximum tissue temperature, and T90 and T50 are tissue temperatures that were exceeded by 90% and 50% of all temperature data measured during the exposure time [Citation24].
According to the ESHO guidelines for superficial hyperthermia, values of T90 ≥ 40 °C and of T50 > 41 °C are required for a treatment duration of 60 min at a target depth within the tissue, and data for CEM43T90 ≈ 1 min [Citation24]. In addition to these criteria, Tmax has proven to be a direct measure for assessing the risk of tissue toxicity [Citation49–53].
(a) Temperatures T90, T50 and Tmax
Temperatures T90, T50 and Tmax are provided in for total exposure time, and exposure time after achieving thermal steady states (TSS). The differences in the three temperatures measured within both time periods were not significant.
Figure 11. Temperatures T90 (panel A), T50 (panel B) and Tmax panel (C) as a function of tissue depth during total exposure times of 60 min (curve 1) and during thermal steady state (TSS) within the 20th–60th minute of exposure (curve 2). Solid and broken lines: best polynomial fits. Dotted horizontal lines: lower limits for the criteria T90 (=40 °C, panel A) and T50 (=41 °C, panel B) for adequate superficial hyperthermia according to ESHO. In panel C, dotted horizontal line indicates the threshold for cytotoxicity risk at Tmax = 43 °C. There is clear indication that all data are within the range of mild hyperthermia (39–43 °C). Values are means ± SD.
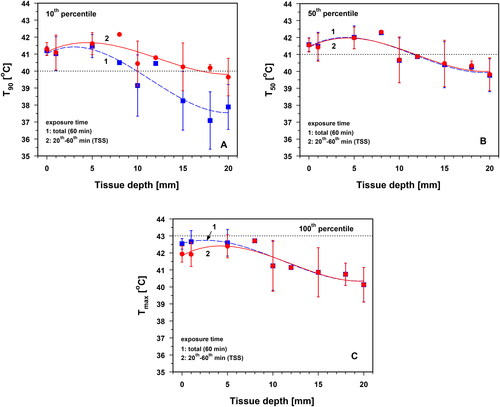
With respect to the total exposure time, Tmax reached a maximum of 42.7 ± 0.7 °C at a depth of 1 mm, and dropped to 41.9 ± 0.7 °C in the TSS (). After reaching the TSS, all three quantities showed maximum values at a tissue depth of approximately 5 mm (). The following processes are responsible for this phenomenon: (a) heat loss at the skin surface to the environment due to a negative radiation balance according to Stefan–Boltzmann’s law, as well as convective and latent heat transfer to the room air; (b) thermoregulation in the near-surface layer through sweating and an increase in regional blood circulation and (c) divergence of the conductive heat flow in the subcutis and muscle tissue, as well as convective heat transport to the body core via blood flow.
Maximum values for T90 at a depth of 5 mm were 41.6 ± 0.7 °C, 42.0 ± 0.7 °C for T50 and 42.6 ± 0.8 °C for Tmax. Generally, the criterion Tmax < 43 °C to avoid cytotoxicity was thus met [Citation49–53]. However, owing to the large scale of the respective standard deviations, this critical value may be exceeded in individual cases. Values of T90 ≥ 40 °C were achieved on average at tissue depths ≤10 mm () and mean values of T50 > 41 °C at tissue depths ≤10 mm (). The specified lower level of mild HT of 39 °C) was exceeded over the entire depth range of Tmax investigated ().
(b) CEM43 and CEM43T90
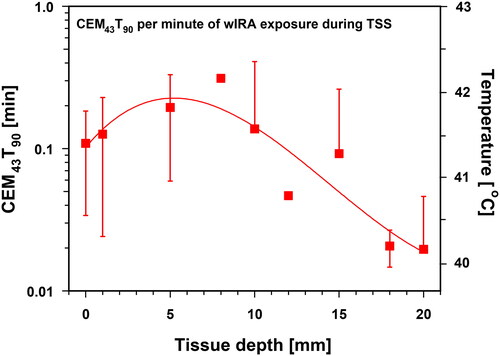
Based on a wIRA exposure time of 60 min, the maximum of CEM43 reached 20.3 ± 12.7 min at a depth of 5 mm. At smaller and larger depths, these values decreased significantly (). To assess the thermal dose after reaching TSS, CEM43 and CEM43T90 were normalized to 1 min of irradiation [Citation24]. CEM43 = 1 min and CEM43T90 = 1 min, corresponding to the tissue temperatures of 43 °C. The maximum values for both CEM43 and CEM43T90 occurred at a depth of 5 mm. Measured values were 0.33 ± 0.19 min for CEM43 and 0.20 ± 0.14 min for CEM43T90, and corresponded to mean tissue temperatures of 42.2 °C for CEM43 and of 41.8 °C for CEM43T90 ( and ).
Figure 12. Thermal doses expressed as cumulative equivalent minutes at 43 °C (CEM43) at different tissue depths. Data are related to total exposure time (60 min, panel A) and to 1 min of exposure during the thermal steady state (panel B). Right ordinate in panel B: corresponding tissue temperatures. CEM43 = 1 min corresponds to a tissue temperature of 43 °C. Values are means ± SD. Lines: best polynomial fits.
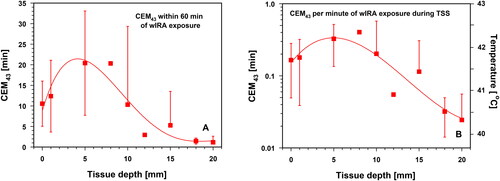
Figure 13. Thermal doses expressed as cumulative equivalent minutes at 43 °C exceeded by 90% of temperature data (CEM43T90) as a function of tissue depth and related to 1 min of wIRA exposure during thermal steady state (TSS). Right ordinate: corresponding tissue temperatures. CEM43T90 = 1 min corresponds to a tissue temperature of 43 °C. Values are means ± SD. Line: best polynomial fit.
3.5.4. Compliance with the ESHO quality standards for superficial hyperthermia
The data used to evaluate the compliance of wIRA heating in both body regions are listed in . Due to the assessment under in vivo conditions, data include individual differences regarding the thicknesses of skin and subcutis, as well as thermoregulatory responses. In contrast, the quality standards of ESHO are related to a muscle-tissue equivalent phantom [Citation25]. Under these conditions, the mean heating rate (HR) and SAR exceeded the requested minima (HR ≥ 1 K min−1 and SAR ≥ 60 mW g−1) up to a depth of ≈10 mm. At a reference depth of 5 mm the respective factors were ≈3 for HR and ≈2 for SAR ( and ).
Table 1. Summary of key data assessed upon wIRA heating of the abdominal wall and the lumbar region of healthy volunteers using an irradiance of 146 mW cm−2 (IR-A) to document compliance with the ESHO quality standards for superficial hyperthermia [Citation24,Citation25], and to protect from cytotoxicity (Tmax) [Citation49–53].
On average, temperature rises of TR ≥ 6 K were measured up to depths of 9 mm after 6 min of exposure. At a reference depth of 5 mm TR was 8.8 ± 1.1 K, and at 10 mm TR was 5.5 ± 1.1 K (, curve 4).
After reaching TSS, TR values ≥6 K were, on average, assessed up to a tissue depth of 15 mm (, curves 7 and 8). On average, the ESHO criteria T90 ≥ 40 °C and T50 ≥ 41 °C were met up to a tissue depth of 10 mm ().
CEM43T90 values were associated with mean tissue temperatures of ≤41.8 °C during TSS and failed to meet the requirements of ESHO to a large extent (). As expected, this is due to the thermographic control, which limits skin surface temperature to values ≤43 °C (see Chapter 2.Citation4).
Mean Tmax values were below 43 °C up to a depth of 20 mm. Only during the heating-up period (1st–20th min of exposure), standard deviations reached beyond 43 °C (by up to 0.4 K at depths of 0–5 mm, ).
4. Discussion
Heating the lower abdominal wall and the lumbar region of healthy volunteers was carried out using an irradiance of 146 mW cm−2 in the spectral range of IR-A (780–1400 nm), delivered by the wIRA radiator used in this study which additionally emits VIS (see Chapter 2.Citation2). Thus, the total irradiance of this device (≈200 W m−2, often used as a basis for clinical dosimetry) not only includes the emission in the IR-A range but also the thermally ineffective portion in the visible range between 590 and 780 nm. Therefore, dosimetry based on the irradiance in the IR-A range offers the advantage of comparability of thermal effects if other cutoff filters or other IR-A spectra are used. The choice of 146 W m−2 for irradiance (IR-A) is suitable to enable effective heating of the tissue receiving wIRA irradiation, initially through direct radiation absorption and in the course of irradiation through conductive heat transport processes.
Direct heating by absorption of radiation was shown by a comparable decrease in the relative heating rate during the first minute of irradiation and relative wIRA irradiance with increasing tissue depth in both body regions (). Because the first minute of exposure is too short to stimulate conductive (molecular) heat flows, the similarity of the slopes of the two curves can be taken as direct evidence of tissue heating solely through radiation absorption. Evidence of conductive heating is provided in , where the depth profiles of the relative temperature rise and relative wIRA irradiance were decoupled after reaching the TSS. This was due to the intermittent onset of conductive heat flow directed into deeper tissue layers, which more effectively contributed to the heating of both tissues, even considering convective heat dissipation by blood flow.
Figure 14. Relative heating rate (HR) after 1 min of wIRA skin exposure (panel A, curve 1, red squares), and of relative temperature rise (TR) during wIRA skin exposure after achieving TSS (panel B, curve 1, red dots) and relative wIRA irradiance (panels A and B, curve 2) plotted as a function of tissue depth. Calculations of HR and TR were performed for both body regions, based on irradiations using an incident irradiance of 146 mW cm−2 (IR-A) at the skin surface. Relative irradiance of wIRA was calculated as a function of tissue depth in human fair skin and subcutis [Citation16,Citation54]. Values describing the relative heating rate and the relative temperature rise are means ± SD. Solid and broken lines: best polynomial fits.
![Figure 14. Relative heating rate (HR) after 1 min of wIRA skin exposure (panel A, curve 1, red squares), and of relative temperature rise (TR) during wIRA skin exposure after achieving TSS (panel B, curve 1, red dots) and relative wIRA irradiance (panels A and B, curve 2) plotted as a function of tissue depth. Calculations of HR and TR were performed for both body regions, based on irradiations using an incident irradiance of 146 mW cm−2 (IR-A) at the skin surface. Relative irradiance of wIRA was calculated as a function of tissue depth in human fair skin and subcutis [Citation16,Citation54]. Values describing the relative heating rate and the relative temperature rise are means ± SD. Solid and broken lines: best polynomial fits.](/cms/asset/11511c74-cf99-4470-b1f2-ec951af2b76c/ihyt_a_2244208_f0014_c.jpg)
Significant differences between the mean tissue temperatures of both body regions occurred during the heating-up period at 1–5 mm depth between the 1st and 2nd minute of exposure, at 10 mm depth between the 6th and 10th minute, at 15 mm depth between the 6th and 15th minute, and after 20 min of exposure at 0–1 mm depth. These effects resulted from slightly increased heat dissipation through blood flow in the lumbar region compared to heat dissipation in the abdominal wall. This is substantiated by comparing the temperature curves 1–5 of both body regions at depths of 5–15 mm in .
However, with regard to the reference exposure times and depths defined by ESHO [Citation24,Citation25], the mean temperatures of both body regions did not show any significant differences. Therefore, the pooling of data from both body regions to assess the effectiveness of wIRA-hyperthermia is justified. Because the data were derived from two different body regions in vivo in terms of thermal response, they are considered more realistic for evaluating superficial hyperthermia in humans than the respective values derived from phantom models and from anesthetized piglets as well, as already stated above. The latter is demonstrated by comparing HR, SAR and TR assessed for the upper thigh of piglets and both body regions in humans as a function of wIRA irradiance (). While all three parameters have met ESHO’s quality assurance standards at a reference depth of 5 mm in humans, compliance was limited to HR and SAR in the anesthetized piglets (), but was not achieved for TR, even when the highest tolerated irradiance was applied ().
Figure 15. Heating rate (HR, panel A), specific absorption rate (SAR, panel B) after 1 min exposure and temperature rise (TR, panel C) after 6 min exposure as a function of wIRA irradiance (IR-A). Comparison of data previously assessed in piglets in vivo ([Citation23], blue diamonds) with human data (this study) in the abdominal wall and lumbar region (red dots) at a reference depth of 5 mm. Dotted horizontal lines indicate the minimum values [HR = 1 K min−1 (A), SAR = 60 mW g−1 (B) and TR = 6 K (C)] to comply with ESHO’s quality assurance standards for adequate tissue heating [Citation25].
![Figure 15. Heating rate (HR, panel A), specific absorption rate (SAR, panel B) after 1 min exposure and temperature rise (TR, panel C) after 6 min exposure as a function of wIRA irradiance (IR-A). Comparison of data previously assessed in piglets in vivo ([Citation23], blue diamonds) with human data (this study) in the abdominal wall and lumbar region (red dots) at a reference depth of 5 mm. Dotted horizontal lines indicate the minimum values [HR = 1 K min−1 (A), SAR = 60 mW g−1 (B) and TR = 6 K (C)] to comply with ESHO’s quality assurance standards for adequate tissue heating [Citation25].](/cms/asset/65a94fce-7371-448f-bd59-1eaeafa0e474/ihyt_a_2244208_f0015_c.jpg)
Besides HR, SAR and TR, the compliance of wIRA-HT with the quality assurance standards of ESHO was also demonstrated for T90 and T50. In contrast, verification failed for CEM43T90. This resulted from the selected limitation of skin surface temperatures ≤43 °C implemented in the TWH 1500 system used. Thus, the corresponding temperatures assigned to the calculated equivalence minutes remained at ≤41.8 °C for CEM43T90 (and at ≤42.2 °C for CEM43, see and ) and were not applicable for direct thermal cell killing. In contrast, CEM43T90 (and CEM43) are based on a reference temperature of 43 °C. To optimally exploit wIRA-HT as a radiosensitizer, temperatures >43 °C are not desirable, as improved tumor perfusion and oxygenation develop in the range of mild HT (39–43 °C), while higher temperatures are likely to deteriorate tumor oxygenation [Citation51].
As discussed earlier, the Bunsen–Roscoe law of reciprocity cannot be applied to the thermal effects that are affected by overriding factors such as heat dissipation and thermoregulation. Therefore, achieving a thermal effect equivalent to 43 °C is possible only for non-significant temperature deviations. However, an extension of the exposure time or a series of treatments at significantly lower temperatures cannot yield the expected thermal effect [Citation19,Citation23,Citation45,Citation54,Citation55]. In this context, the maximum temperature Tmax calculated from the 100th percentile must be evaluated. Mean values for both body regions were below 43 °C up to depth of 20 mm (). During the heating-up phase (≤15 min), maximum tissue temperatures only occasionally (and only shortly) may reach 44.0 °C at tissue depths of 1–5 mm. Therefore, the risk of a cytotoxic thermal effect when using wIRA-HT with the selected irradiance can be excluded [Citation49–53].
The exposure times to reach the ‘prescribed’ lower HT level of 39 °C () and temperature rise of 6 K (ET6K, ) showed considerable standard deviations, but were within the heating times in order to reach a TSS. Therefore, it is recommended that any necessary extension of hyperthermia application times be based on the heating-up time to reach the TSS over the entire depth range of the heated tissue.
From the rapid drop in tissue temperatures after termination of wIRA-HT (), it can be concluded that the persistence of therapeutically relevant HT levels in the tissue is quite short-term. Therefore, it is recommended to cover the heated tissue with a thermal isolator, such as a heated bolus, immediately after wIRA-HT, and to ensure short transit times to subsequent RT of <1–5 min. This is particularly important when tissue temperatures >39 °C are required because skin coverage reduces heat loss through the skin surface to the environment, but not heat dissipation through convection (blood flow) and thermal conduction within the tissue [Citation4,Citation5,Citation56].
Note: Following the treatment schedule at the Department of Radiation Oncology, Lindenhofspital Bern (Switzerland), using mild HT + re-irradiation (re-RT) for recurrent breast cancer in 17 patients, the mean surface temperature was 41.3 °C immediately after termination of wIRA irradiation, the mean transit time was 1.5 min, and the average surface temperature at start of re-irradiation of recurrent breast cancers was 39.2 °C (personal communication: Dr. med. Markus Notter, November 28, 2022).
5. Conclusions
Despite the relatively small sample size and large standard deviations in our study, the data communicated for superficial wIRA-HT demonstrate the following:
Compliance with the ESHO standards for adequate superficial hyperthermia in terms of HR, SAR, TR and thermal doses T90 and T50 up to a tissue depth of 10 mm has been demonstrated.
A direct thermal tumor cell killing due to cytotoxic thermal doses CEM43 and CEM43T90 can be ruled out due to the limitation of the skin surface temperature to ≤43 °C and of the exposure time to a maximum of about 60 min.
The risk of burns is prevented because tissue temperature is limited to ≤43 °C (see above), with only short or minor deviations during the heating phase in individual cases.
The described correlation between skin surface temperature and tissue temperature during wIRA heating suggests that thermography is sufficient to prevent thermal hotspots in tissues with normal blood perfusion. Concomitant invasive temperature measurement may be of use to monitor heating in deeper tissue layers.
Results demonstrated the reliability of wIRA-induced mild hyperthermia (39–43 °C) in superficial human tissues. Importantly, the present conditions are quite close to clinical settings and are more realistic than those prevailing when using in vitro phantoms or preclinical animal models.
Ethical approval
This study was found to be ethically sound by the local ethics authority (EK-Freiburg 21-1158).
Consent form
After having received an explanation of the study, all volunteers signed an informed consent.
Supplemental Material
Download PDF (84.2 KB)Acknowledgments
The authors greatly appreciate Michael R. Saalmann’s valuable support during the experimental procedures and data acquisition and Dr. Mark Gainey, Medical Physicist, Department of Radiation Oncology, University Medical Center, University of Freiburg/Breisgau, Germany for linguistic support.
Disclosure statement
The authors declare that the research was conducted in the absence of any commercial or financial relationships that could be constructed as a potential conflict of interest.
Data availability statement
The data sets used and analyzed during this study are available from the corresponding author on reasonable request.
Additional information
Funding
References
- Verein Licht- und Wärmetherapie.Abbreviated English Review; [cited 2020]. Available from: www.waermetherapie.org/infos-und-fachliteratur/wira-therapie/english-abstract.
- Vaupel P, Kelleher DK, Krüger W. Water-filtered infrared-A-radiation: novel technique to heat superficial tumors. Strahlenther Onkol. 1992;168(11):633–639.
- Seegenschmiedt MH, Klautke G, Walther E, et al. Water-filtered infrared-A-hyperthermia combined with radiotherapy in advanced and recurrent tumors. Initial Results of a Multicenter Phase I-II Study. Strahlenther Onkol. 1996;172:475–484.
- Notter M, Piazena H, Vaupel P. Hypofractionated re-irradiation of large-sized recurrent breast cancer with thermography-controlled, contact-free water-filtered infra-red-A hyperthermia: a retrospective study of 73 patients. Int J Hyperthermia. 2017;33(2):227–236. doi: 10.1080/02656736.2016.1235731.
- Notter M, Thomsen AR, Nitsche M, et al. Combined wIRA-hyperthermia and hypofractionated re-irradiation in the treatment of locally recurrent breast cancer: evaluation of therapeutic outcome based on a novel size classification. Cancers. 2020;12:606. doi: 10.3390/cancers12030606.
- Hartel M, Hoffmann G, Wente MN, et al. Randomized clinical trial of the influence of local water-filtered infrared-A irradiation on wound healing after abdominal surgery. Br J Surg. 2006;93(8):952–960. doi: 10.1002/bjs.5429.
- Hoffmann G, Hartel M, Mercer JB. Heat for wounds – water-filtered infrared-A (wIRA) for wound healing – a review. Ger Med Sci. 2016;14:doc08. doi: 10.3205/000235.
- Künzli BM, Liebl F, Nuhn P, et al. Impact of preoperative local water-filtered infrared-A irradiation on postoperative wound healing: a randomized patient – and observer – blinded controlled clinical trial. Ann Surg. 2013;258(6):887–894. doi: 10.1097/SLA.0000000000000235.
- Rutkowski R, Straburzyńska-Lupa A, Korman P, et al. Thermal effectiveness of different IR radiators employed in rheumatoid hand therapy as assessed by thermovisual examination. Photochem Photobiol. 2011;87(6):1442–1446. doi: 10.1111/j.1751-1097.2011.00975.x.
- Lange U, Müller-Ladner U, Dischereit G. Effectiveness of whole-body hyperthermia by mild water-filtered infrared-A radiation in ankylosing spondylitis – a controlled, randomized, prospective study. Akt Rheumatol. 2017;42:122–128.
- Klemm P, Eichelmann M, Aykara I, et al. Serial locally applied water-filtered infrared-A radiation in axial spondyloarthritis – a randomized controlled trial. Int J Hyperthermia. 2020;37(1):965–970. doi: 10.1080/02656736.2020.1804079.
- Xu J, Deng Y, Yu C, et al. Efficacy of wIRA in the treatment of sacroiliitis in male patients with ankylosing spondylitis and its effect on serum VEGF levels. J Orthop Surg Res. 2019;14(1):313. doi: 10.1186/s13018-019-1322-7.
- Moritz A, Henriques F. Studies of thermal injury. II. The relative importance of time and surface temperature in the causation of cutaneous burns. Am J Pathol. 1947;23:695–720.
- Dewhirst MW, Viglianti BL, Lora-Michiels M, et al. Thermal dose requirement for tissue effect: experimental and clinical findings. Proc SPIE Int Soc Opt Eng. 2003;4954:37. doi: 10.1117/12.476637.
- Viglianti BL, Dewhirst MW, Abraham JP, et al. Rationalization of thermal injury quantification methods: application to skin burns. Burns. 2014;40(5):896–902. doi: 10.1016/j.burns.2013.12.005.
- Piazena H, Meffert H, Uebelhack R. Spectral remittance and transmittance of visible and infrared-A radiation in human skin – comparison between in vivo measurements and model calculations. Photochem Photobiol. 2017;93(6):1449–1461. doi: 10.1111/php.12785.
- Piazena H, Meffert H, Uebelhack R. Physikalische und photobiologische Grundlagen prophylaktischer und therapeutischer Infrarotanwendungen. Akt Dermatol. 2014;40(08/09):335–339. doi: 10.1055/s-0034-1365750.
- Vaupel P, Piazena H, Müller W, et al. Biophysical and photobiological basics of water-filtered infrared-A hyperthermia of superficial tumors. Int J Hyperthermia. 2018;35(1):26–36. doi: 10.1080/02656736.2018.1469169.
- Piazena H, Müller W, Vaupel P. Physical and photobiological basics of wIRA-hyperthermia. In: Vaupel P, editor. Water-filtered infrared-A radiation: from basics to practice. Cham: Springer Nature Switzerland; 2022. p. 35–53. doi: 10.1007/978-3-030-92880-3_3.
- Thomsen AR, Saalmann MR, Nicolay NH, et al. Temperature profiles and oxygenation status in human skin and subcutis upon thermography-controlled wIRA-hyperthermia. In: Vaupel P, editor. Water-filtered infrared-A radiation: from basics to practice. Cham: Springer Nature Switzerland; 2022. p. 69–80. doi: 10.1007/978-3-030-92880-3_5.
- Thomsen AR, Saalmann MR, Nicolay NH, et al. Improved oxygenation of human skin, subcutis and superficial cancers upon mild hyperthermia delivered by wIRA-irradiation. Adv Exp Med Biol. 2022;1395:255–261. doi: 10.1007/978-3-031-14190-4_42.
- Piazena H, Müller W, Pendl W, et al. Thermal field formation during wIRA-hyperthermia: temperature measurements in skin and subcutis of piglets as a basis for thermotherapy of superficial tumors and local skin infections caused by thermosensitive microbial pathogens. Int J Hyperthermia. 2019;36:938–952.
- Piazena H, Müller W, Vaupel P. wIRA-heating of piglet skin and subcutis in vivo: proof of accordance with ESHO criteria for superficial hyperthermia. Int J Hyperthermia. 2020;37(1):887–896. doi: 10.1080/02656736.2020.1792562.
- Trefná HD, Crezee H, Schmidt M, et al. Quality assurance guidelines for superficial hyperthermia clinical trials: I. Clinical requirements. Int J Hyperthermia. 2017;33(4):471–482. doi: 10.1080/02656736.2016.1277791.
- Dobsicek Trefna H, Crezee J, Schmidt M, et al. Quality assurance guidelines for superficial hyperthermia clinical trials: II. Technical requirements for heating devices. Strahlenther Onkol. 2017;193(5):351–366. doi: 10.1007/s00066-017-1106-0.
- Krackowizer P, Brenner E. Thickness of human skin: 24 points of measurement. Phlebologie. 2008;37:82–92.
- Jain SM, Pandey K, Lahoti A, et al. Evaluation of skin and subcutaneous tissue at insulin injection sites in Indian, insulin naive, type-2 diabetic adult population. Indian J Endocrinol Metab. 2013;17(5):864–870. doi: 10.4103/2230-8210.117249.
- Oltulu PO, Ince B, Kokbudak N, et al. Measurement of epidermis, dermis, and total skin thickness from six different body regions with a new ethical histometric technique. Turk J Plast Surg. 2018;26(2):56–61. doi: 10.4103/tjps.TJPS_2_17.
- Coull NA, West AM, Hodder SG, et al. Body mapping of regional sweat distribution in young and older males. Eur J Appl Physiol. 2021;121(1):109–125. doi: 10.1007/s00421-020-04503-5.
- Inoue Y, Shibasaki M, Hirata K, et al. Relationship between skin blood flow and sweating rate, and age- related regional differences. Eur J Appl Physiol Occup Physiol. 1998;79(1):17–23. doi: 10.1007/s004210050467.
- Machado-Moreira CA, Smith FM, van den Heuvel AMJ, et al. Sweat secretion from the torso during passively-induced and exercise-related hyperthermia. Eur J Appl Physiol. 2008;104(2):265–270. doi: 10.1007/s00421-007-0646-x.
- Taylor NAS, Machado-Moreia CA. Regional variations in transepidermal water loss, eccrine sweat gland density, sweat secretion rates and electrolyte composition in resting and exercising humans. Extreme Physiol Med. 2013;2(1):4. doi: 10.1186/2046-7648-2-4.
- Park SJ, Tamura T. Distribution of evaporation rate on human body surface. Ann Physiol Anthropol. 1992;11(6):593–609. doi: 10.2114/ahs1983.11.593.
- Wust P, Stahl H, Löffel J, et al. Clinical, physiological and anatomical determinants for radiofrequency hyperthermia. Int J Hyperthermia. 1995;11(2):151–167. doi: 10.3109/02656739509022453.
- Wust P. Thermotherapy in oncology. Bremen: Uni-Med Science; 2017.
- van Leeuwen GM, Lagendijk JJ, van Leersum BJ, et al. Calculation of change in brain temperature due to exposure to a mobile phone. Phys Med Biol. 1999;44(10):2367–2379. doi: 10.1088/0031-9155/44/10/301.
- Cetingül MP, Herman C. A heat transfer model of skin tissue for the detection of sessions: sensitivity analysis. Phys Med Biol. 2010;55(19):5933–5951. doi: 10.1088/0031-9155/55/19/020.
- Vaupel P, Piazena H. Strong correlation between specific heat capacity and water content in human tissues suggests preferred heat deposition in malignant tumors upon electromagnetic irradiation. Int J Hyperthermia. 2022;39(1):987–997. doi: 10.1080/02656736.2022.2067596.
- Pennes HH. Analysis of tissue and arterial blood temperature in the resting human forearm. J Appl Physiol. 1948;1(2):93–122. doi: 10.1152/jappl.1948.1.2.93.
- Chou CK. Use of heating rate and specific absorption rate in the hyperthermia clinic. Int J Hyperthermia. 1990;6(2):367–370. doi: 10.3109/02656739009141144.
- Sherar M, Liu FF, Pintilie M, et al. Relationship between thermal dose and outcome in thermoradiotherapy treatments for superficial recurrences of breast cancer: data from phase III trial. Int J Radiat Oncol Biol Phys. 1997;39(2):371–380. doi: 10.1016/s0360-3016(97)00333-7.
- Sapareto AS, Dewey WC. Thermal dose determination in cancer therapy. Int J Radiat Oncol Biol Phys. 1984;10(6):787–800. doi: 10.1016/0360-3016(84)90379-1.
- Ohguri T, Harima Y, Imada H, et al. Relationships between thermal dose parameters and the efficacy of definitive chemotherapy plus regional hyperthermia in the treatment of locally advanced cervical cancer: data from a multicentre randomised clinical trial. Int J Hyperthermia. 2018;34(4):461–468. doi: 10.1080/02656736.2017.1352105.
- Jones EL, Oleson JR, Prosnitz LR, et al. Randomized trial of hyperthermia and radiation for superficial tumors. J Clin Oncol. 2005;23(13):3079–3085. doi: 10.1200/JCO.2005.05.520.
- Lee S-Y, Szigeti GP, Szasz AM. Oncological hyperthermia: the correct dosing in clinical applications. Int J Oncol. 2019;54(2):627–643. doi: 10.3892/ijo.2018.4645.
- Gaus W, Muche R. Medizinische Statistik. Stuttgart: Schattauer; 2014. ISBN: 978-3-7945-2931-5.
- Cavalli-Sforza L. Biometrie – Grundzüge biologisch-medizinischer Statistik. Stuttgart: Gustav Fischer; 1974. ISBN: 3-437-00123-X.
- Available from: https://matheguru.com/stochastik/t-test.hrml.
- Yarmolenko PS, Moon EJ, Landon C, et al. Thresholds for thermal damage to normal tissues: an update. Int J Hyperthermia. 2011;27(4):320–343. doi: 10.3109/02656736.2010.534527.
- Dewhirst MW, Viglianti BL, Lora-Michiels M, et al. Basic principles of thermal dosimetry and thermal thresholds for tissue damage from hyperthermia. Int J Hyperthermia. 2003;19(3):267–294. doi: 10.1080/0265673031000119006.
- Griffin JG, Dings RPM, Jamshidi-Parsian A, et al. Mild temperature hyperthermia and radiation therapy: role of tumor vascular thermotolerance and relevant physiological factors. Int J Hyperthermia. 2010;26(3):256–263. doi: 10.3109/02656730903453546.
- Bakker A, Kolff MW, Holman R, et al. Thermal skin damage during reirradiation and hyperthermia is time-temperature dependent. Int J Radiat Oncol Biol Phys. 2017;98(2):392–399. doi: 10.1016/j.ijrobp.2017.02.009.
- Bakker A, van der Zee J, van Tienhoven G, et al. Temperature and thermal dose during radiotherapy and hyperthermia for recurrent breast cancer are related to clinical outcome and thermal toxicity: a systemic review. Int J Hyperthermia. 2019;36(1):1024–1039. doi: 10.1080/02656736.2019.1665718.
- Piazena H, Kelleher DK. Effects of infrared-A irradiation on skin: discrepancies in published data highlight the need for an exact consideration of physical and photobiological laws and appropriate experimental settings. Photochem Photobiol. 2010;86(3):687–705. doi: 10.1111/j.1751-1097.2010.00729.x.
- van Rhoon GC. Is CEM43 still a relevant thermal dose parameter for hyperthermia treatment monitoring? Int J Hyperthermia. 2016;32(1):50–62. doi: 10.3109/02656736.2015.1114153.
- Notter M, Thomsen AR, Grosu AL, et al. Thermography-controlled, contact-free wIRA-hyperthermia combined with hypofractionated radiotherapy for large-sized lesions of unresectable, locally recurrent breast cancer. In: Vaupel P, editor. Water-filtered infrared-A radiation: from basics to practice. Cham: Springer Nature Switzerland; 2022. p. 83–95. doi: 10.1007/978-3-030-92880-3_6.