
 ?Mathematical formulae have been encoded as MathML and are displayed in this HTML version using MathJax in order to improve their display. Uncheck the box to turn MathJax off. This feature requires Javascript. Click on a formula to zoom.
Abstract
Objective: Heat shock proteins (HSPs) play key roles in the malignant transformation and progression of many tumors. However, the effectiveness of using HSP-related genes to predict the prognosis of patients with cervical cancer (CC) remains elusive. We aimed to delineate the prognosis and biological significance of HSP-related genes in CC. Methods: We collected the transcriptional and clinical data of CC patients from The Cancer Genome Atlas (TCGA) and searched for HSP-related genes in the literature. LASSO and univariate/multivariate Cox regression analyses were utilized to screen genes; 12 genes were found to be related to CC survival, and a prediction model was built. The effectiveness of the model was confirmed using TCGA and GEO, and it was found to be an independent predictor of CC. The nomogram is plotted. The prognostic model was further visualized using calibration curves, which showed good agreement with the predicted outcomes at 1-, 3, and 5 years. Results: We found that low-risk patients had higher immune cell infiltration and stronger immune function, and according to the immunophenoscore and TIDE scores, the low-risk group tended to respond more to immunotherapy. Additionally, we used the GDSC database to predict drug sensitivity in patients with different prognostic risks. Conclusion: In summary, we built a good model to help predict the prognosis of CC patients and provide a reference for personalized treatment and medication for different patients.
1. Introduction
Cervical cancer (CC) is the second most prevalent cancer in women globally. According to statistics, there are 604,127 incidences of CC and 341,831 deaths from CC every year [Citation1]. HPV is the primary risk factor for the development of this disease [Citation2]. In developed countries, the incidence and fatality of CC have decreased because of screening programs [Citation3]. However, the 5-year overall survival (OS) rate of locally advanced CC patients after radiotherapy and chemotherapy is only approximately 70%, and the prognosis of recurrent or metastatic patients is still relatively poor [Citation4]. Recent studies have identified several carcinogenic factors that promote CC progression, including G6PC, Claudin-12, and CYP4Z1 [Citation5–7]. Gene-based prognostic signatures are more accurate than conventional cancer markers [Citation8]. Based on this, screening for prognostic-related genes to develop new prognostic models may have guiding significance in the prognosis and treatment of CC.
Heat shock proteins (HSPs) resist external stress and maintain the stability of cells and proteins, which is crucial for cell survival and proliferation [Citation9]. Cancer cells require regulation of HSPs to sustain their progression and invasion. Highly proliferating tumor cells need to synthesize folded mutant and/or abnormal proteins for tumors to grow and become malignant, which requires HSPs to stabilize, fold, and aggregate [Citation10]. Some HSPs are pivotal in CC. HSP90α is significantly higher in plasma samples from patients with CC, and its combination with SCC-Ag may be a diagnostic marker for CC [Citation11]. Another study showed that downregulation of HSP90 in a CC mouse model can effectively inhibit the proliferation and migration of CC cells [Citation12]. Liu et al. [Citation13] found that inhibition of HSP70 elevates the sensitivity of CC cells to cisplatin by promoting cell apoptosis, implying that HSP70 is a potential therapeutic target for CC. Based on these studies, HSPs may play a critical role in CC prognosis. Thus, we aimed to delineate the significance of HSP-related genes in the prognosis of CC.
We downloaded CC samples from The Cancer Genome Atlas (TCGA), searched for HSP-related genes in the literature, and developed a CC prognostic riskscore model with HSP-related genes. To demonstrate the reliability of the model, we verified it using the GEO dataset. In addition, to explore the reasons for different prognoses in patients, we analyzed the biological functions and immune status of patients with different prognoses. Overall, this study provides a reference for the treatment and prognosis of CC.
2. Materials and methods
2.1. Data download
The CC training set of patient data was obtained from TCGA (https://portal.gdc.cancer.gov/), which included 309 samples (3 normal and 306 cancer samples). The validation set data of CC, GSE52903 [Citation14], and GSE44001 [Citation15] were obtained from GEO (https://www.ncbi.nlm.nih.gov/geo/), which included 72 patient samples using the GPL6244 gene chip and 300 patient samples using the GPL14951 gene chip. The clinical information and demographic characteristics of the samples in TCGA, GSE52903, and GSE44001 datasets are presented in Table S1.
2.2. HSP-related gene analysis
A total of 97 HSP-related genes [Citation16] are placed in Table S2. In addition, abbreviations and full names of the genes involved in this paper are summarized in Table S3. To understand their relationships, STRING (https://cn.string-db.org/cgi/input.pl) was used to build a PPI network of HSP-related genes. We also used the R package ‘corrplot’ [Citation17] to draw a correlation heatmap.
2.3. Establishment of prognostic model
To identify HSP-related genes linked to CC OS in TCGA training set, we performed univariate Cox analysis using the open-source software package ‘survival’ (https://github.com/therneau/survival). During the analysis, we selected genes with p < 0.05 as significant prognostic factors. Then, to further narrow down the candidate genes, we used LASSO regression analysis with ‘glmnet’ [Citation18] and ‘survival’ packages to build a risk model and further evaluate their contributions as prognostic factors in the CC cohort. Finally, we performed multivariate Cox regression analysis using the ‘survival’ package to construct a comprehensive risk model that included all significant prognostic factors. This model can predict survival and offer guidance for decision-making by physicians.
The mathematical formula for riskscore was:
where n, Xi, and βi represented the total number of genes, FPKM values, and regression coefficients, respectively.
2.4. Performance evaluation and validation of the prognostic model
Following the patients’ gene expression profiles, we computed the risk score and used the median value of all patients’ risk scores as the cutoff point to divide patients into high-and low-risk groups. The patients in the validation set were also divided into two risk groups. We utilized K-M analysis to evaluate the differences in OS. We also utilized ‘timeROC’ [Citation19] and ‘survival’ packages to assess the diagnostic performance of the model, including the receiver operating characteristic (ROC) curve for testing 1, 3, and 5-year survival. In addition, we created a risk score curve, gene expression heatmap, and survival curve to show differences between the different groups. We further validated the model performance using the external GSE52903 and GSE44001 datasets.
2.5. KEGG and GO analyses
We applied the ‘edgeR’ package [Citation20] to calculate the differentially expressed genes (DEGs) (|logFC| > 1, FDR < 0.05) between two risk groups. We used the R package ‘clusterProfiler’ [Citation21] to complete GO analysis to study the biological functions of DEGs and used the R package ‘ggplot2’ (https://ggplot2.tidyverse.org) for visualization. We also performed KEGG pathway analysis using the R package ‘clusterProfiler’ to further study the biological significance of the DEGs. We visualized the results using the R package ‘ggplot2’ to better demonstrate our research findings.
2.6. Construction and validation of nomogram based on prognostic model
To comprehensively analyze the survival of patients with CC, we combined clinical information and used ‘survival’ and ‘forestplot’ packages in R software (https://cran.r-project.org/web/packages/forestplot/vignettes/forestplot.html) to perform univariate and multivariate Cox regression analyses. The analyses evaluated the effects of other features such as risk score, age, and pathological stage on patient survival. Through this approach, we can more accurately predict patient survival rates and provide personalized treatment plans. Additionally, we used the R package ‘rms’ [Citation22] to construct nomogram and calibration curves. The nomogram could predict patient survival rates at 1, 3, and 5 years based on the risk score and other clinical factors, which could help physicians to better assess a patient’s survival status and take appropriate treatment measures. Furthermore, the calibration curve could assess the model’s accuracy and reliability, further optimizing the predictive results.
2.7. Exploration of the immune landscape of high/low-risk CC patients
We utilized the R package ‘estimate’ [Citation23] to evaluate the tumor microenvironment (TME) of each sample in two risk groups to assess patients’ tumor immune status. During the evaluation process, we computed immune, stromal, ESTIMATE, and tumor purity scores, which provided basic information on the TME and immune status. Next, we used the Wilcoxon test to compare the TME scores between the two risk groups. This helped us determine the differences between the two groups and identify which scores significantly affected prognosis. The ssGSEA method could not only evaluate the expression of immune-related genes, but also the relative abundance of cell subsets and the activity level of immune function pathways. Using ssGSEA, we compared the gene expression data of each sample with a predefined set of immune-related genes and obtained the enrichment levels of immune-related gene expression in the sample, thereby reflecting the immune status of the sample. We compared the differences in immune status and visualized the results using the R package ‘ggpubr’ (http://www.sthda.com/english/rpkgs/ggpubr).
2.8. Prediction of immunotherapy response
To dissect the potential immunotherapy response of the patients, we computed the expression of immune checkpoint (IC) markers in the two groups and compared the differences using the Wilcoxon test [Citation24]. We calculated the immunophenoscore (IPS) and TIDE scores for the two groups and performed a t-test on the scores to explore the potential immunotherapy response of the patients. To present these results more clearly, we utilized the R package ‘ggpubr’ to create box plots comparing the IPS and TIDE scores between the two groups.
2.9. Drug sensitivity analysis
By analyzing the transcriptome and drug sensitivity data in the GDSC database, we can understand the effects and mechanisms of drugs on cancer cells in different tumor types and chemical categories [Citation25]. To predict the drugs that may be suitable for high/low-risk groups, we used the data from CCLE and the ‘oncoPredict’ package [Citation26] to predict the correlation between the transcriptome data and drug sensitivity and performed a t-test on related drug IC50 values.
3. Results
3.1. Analysis of HSP-related genes
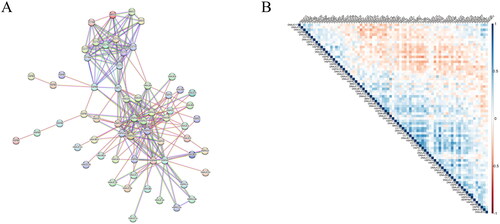
We presented the interactions and regulatory mechanisms of proteins in biological systems through a PPI network () and plotted correlations across 97 HSP-related genes (). These genes interact with or influence each other in various stages of life processes, such as biological signal transduction, energy and substance metabolism, gene expression regulation, and cell cycle regulation.
Figure 1. Analysis of HSP-related genes. (A) PPI network constructed by HSP-related genes, where each node represents a protein and edges indicate possible interactions between them. (B) Correlation heatmap of HSP-related genes, where different shades of blue represent positive correlation and different shades of red represent negative correlation.
3.2. Building of a CC prognostic model
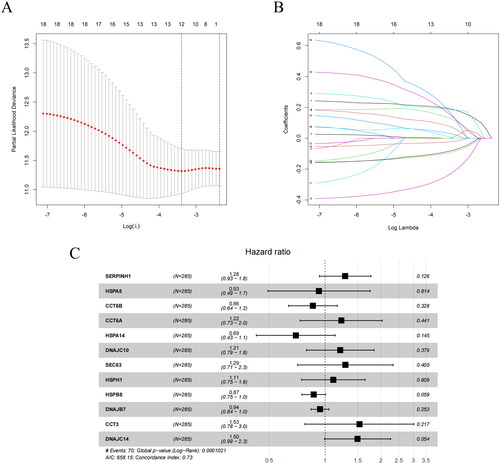
We performed a univariate Cox regression analysis on HSP-related genes to explore the genes that may notably influence the survival time of patients with CC. We identified 18 HSP-related genes that were significantly associated with CC survival (p < 0.05). We then used LASSO to narrow the range of prognostic genes. We took the log (λ) value corresponding to the minimum partial likelihood bias and mean square error as the optimal value (). The log (λ) value was used to determine the prognostic feature genes. Subsequently, candidate prognostic feature genes were determined according to the coefficient corresponding to this optimal log (λ) value, with one line representing one prognostic feature gene, and finally 12 genes were screened (). We ultimately selected 12 prognostic factors to construct a prognostic model through multivariate Cox regression analysis and created a forest plot. The results showed that SERPINH1, CCT6A, DNAJC10, SEC63, HSPH1, CCT3 and DNAJC14 were risk factors, while HSPA5, DNAJB7, CCT6B, HSPA14 and HSPB8 were protective factors (). The formula for the prognostic model is as follows:
Figure 2. Identification of factors affecting the prognosis of CC patients. (A) Coefficient distribution plot. The x-axis represents the logarithmic value of λ, and the y-axis represents the corresponding coefficient estimate value. (B) LASSO coefficient plot. The colored lines represent the coefficient values for different independent variables. (C) Forest plot of prognostic genes and coefficients, where each black dot represents a gene and the coefficient refers to the weight of each gene in the prediction model. HR > 1, risk factor. HR < 1, protective factor.
3.3. Performance evaluation of CC prognostic model in TCGA training set
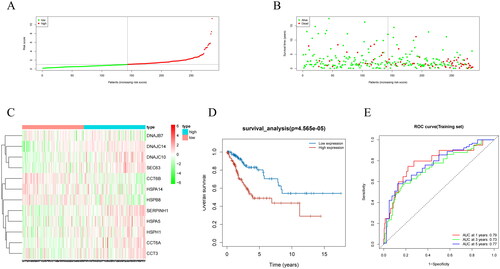
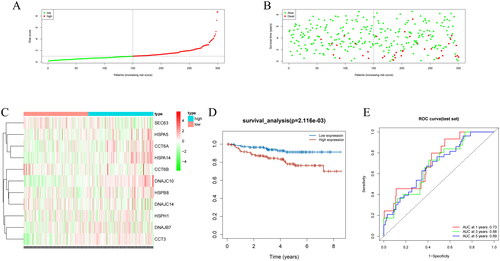
We used a model to compute the risk scores of clinical samples from TCGA and plotted the risk score distribution and survival status distribution. The results presented that samples were assigned to high/low-risk groups (). We also found that the lower the risk score, the more the number of surviving patients, while the higher the risk score, the more the number of deceased patients (). To further investigate the expression of the prognostic model genes, we created a heatmap of gene expression levels. We observed that DNAJC14, DNAJC10, SEC63, SERPINH1, HSPA5, HSPH1, CCT6A, and CCT3 were upregulated in the high-risk group, whereas DNAJB7, CCT6B, HSPA14, and HSPB8 were upregulated in the low-risk group (). The K-M survival analysis showed that the survival rate of low-risk patients was markedly higher than that of high-risk patients (). To evaluate the predictive ability of the prognostic model, we created ROC curves for 1, 3, and 5 years, and calculated the AUC values. The AUC values for 1, 3, and 5 years were 0.79, 0.73, and 0.77, respectively, implying that the prognostic model had a good predictive ability (). These findings suggest that the prognostic model we developed can effectively evaluate the risk of clinical samples from TCGA and may provide important clinical references for tumor prognosis.
Figure 3. Performance evaluation and validation of the CC prognostic model in TCGA dataset. (A) Distribution of riskscore for high/low-risk group patients in TCGA. (B) Distribution of survival status for high/low-risk group patients in TCGA. (C) Heatmap showing the expression levels of prognostic genes for high/low-risk group patients in TCGA. (D) Survival curve analysis for high/low-risk group patients in TCGA. (E) ROC curves show the accuracy of the model in predicting 1-year, 3-year, and 5-year survival of CC patients.
3.4. Validation of the prognostic model using GEO datasets GSE52903 and GSE44001
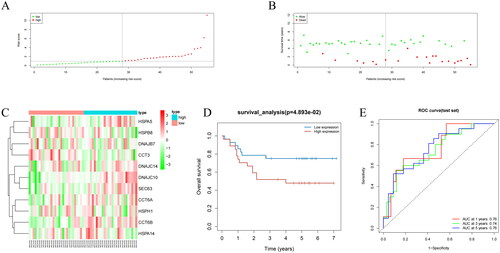
To demonstrate the universality and stability of the model, we analyzed samples from the GSE52903 dataset. We grouped the samples into high- and low-risk groups based on the median risk score [Citation27] and created a risk score distribution plot, a survival status distribution plot, and a gene expression heatmap. Prognostic models distinguished between the two groups based on the risk score and survival status. The lower the risk score, the more the number of surviving patients, while the higher the risk score, the more the number of deceased patients (). We also performed survival analysis of the two groups, and the survival rates were significantly different (). We created ROC curves for different periods (1, 3, and 5 years) and calculated AUC values for each period. The model showed considerable predictive accuracy for 1, 3, and 5 years with AUC values of 0.76, 0.74, and 0.76, respectively (). Overall, these results suggest that our model can provide valuable prognostic information for patients with cancer.
Figure 4. Performance evaluation and validation of the CC prognostic model in the GSE52903 dataset. (A) Distribution of riskscore for high/low-risk group patients in GSE52903. (B) Distribution of survival status for high/low-risk group patients in GSE52903. (C) Heatmap showing the expression levels of prognostic genes for high/low-risk group patients in GSE52903. (D) Survival curve analysis for high/low-risk group patients in GSE52903. (E) ROC curves show the accuracy of the model in predicting 1-year, 3-year, and 5-year survival of CC patients.
We also validated the model using the GSE44001 dataset. We created risk score distribution plots, survival status distribution plots, gene expression heatmaps, and survival curves, and the prognostic model still distinguished between the two groups, with the high-risk group having a lower survival rate (). We created ROC curves for different periods (1, 3, and 5 years) and calculated AUC values for each period. The model showed considerable predictive accuracy for 1, 3, and 5 years with AUC values of 0.73, 0.68, and 0.69 (). Hence, our predictive model can effectively forecast survival rates in different datasets and provide valuable clinical guidance for patients.
Figure 5. Performance evaluation and validation of the CC prognostic model in the GSE44001 dataset. (A) Distribution of riskscore for high/low-risk group patients in GSE44001. (B) Distribution of survival status for high/low-risk group patients in GSE44001. (C) Heatmap showing the expression levels of prognostic genes for high/low-risk group patients in GSE44001. (D) Survival curve analysis for high/low-risk group patients in GSE44001. (E) ROC curves for the accuracy of survival at 1, 3, and 5 years in CC patients.
3.5. Significant differences in biological functions and pathways
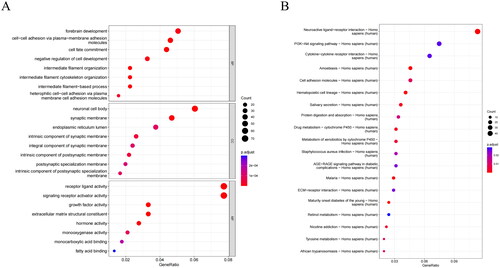
We performed differential analysis and identified 1016 DEGs between the two groups (Table S4). To further dissect the biological differences between the two groups and explore the possible mechanisms underlying the different prognoses, we conducted GO and KEGG analyses. GO analysis revealed that DEGs were mainly enriched in biological processes (cell-cell adhesion via plasma-membrane adhesion molecules, forebrain development, and cell fate commitment), cellular components (neuronal cell body), and molecular functions (receptor ligand activity and signaling receptor activator activity) (). KEGG presented the main enrichment of DEGs in the neuroactive ligand-receptor interaction, PI3K-AKT signaling pathway, and cytokine-cytokine receptor interaction pathways (). Hence, forebrain development, biological function, and the neuroactive ligand-receptor interaction pathway may have a significant influence on the prognosis of CC patients.
Figure 6. Analysis of biological differences between high/low-risk groups. (A) GO annotation of DEGs between high/low-risk groups. (B) KEGG enrichment analysis of DEGs between high/low-risk groups. The bubbles represent different functions or pathways, where the color changes from red to dark blue, indicating the P-value of the corresponding function from low to high.
3.6. Clinical significance and nomogram of prognostic features
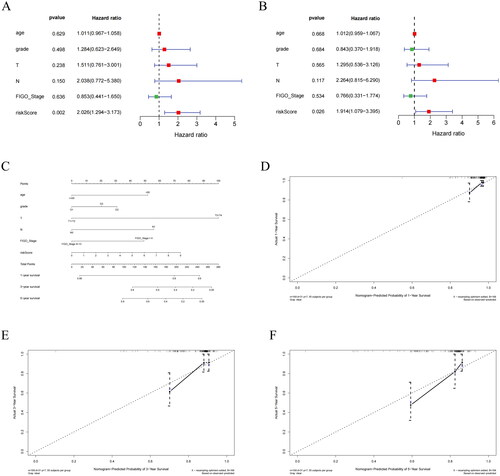
To determine whether the prognostic model with HSP-related genes can be an independent predictor of survival in CC patients, we analyzed the clinical information of CC samples from TCGA (risk score, age, and pathological stage) and performed regression analysis to assess the impact of each factor on survival time. In the univariate Cox regression analysis, the risk score had a substantial influence on survival time (). In multivariate Cox regression analysis, the risk score was a significant factor (). The risk score could serve as an independent prognostic indicator for patients with CC. To determine the clinical application of the prognostic model, we created nomogram and calibration curves for risk score and clinical pathological factors for 1, 3, and 5 years, and found that calibration curves displayed consistency between predicted and actual OS for 1, 3, and 5 years (). Based on the results and data analysis, we concluded that the nomogram we constructed had excellent predictive ability.
Figure 7. Independent prognostic analysis of riskscore and construction of nomogram. (A) Univariate Cox regression analysis of riskscore combined with clinical indicators. (B) Multivariate Cox regression analysis of riskscore combined with clinical indicators. (C) Nomogram showing the combination of riskscore and clinicopathological factors. (D) Calibration curve for 1-year risk prediction. (E) Calibration curve for 3-year risk prediction. (F) Calibration curve for 5-year risk prediction.
3.7. Differential analysis of immune scores and immune cell abundance
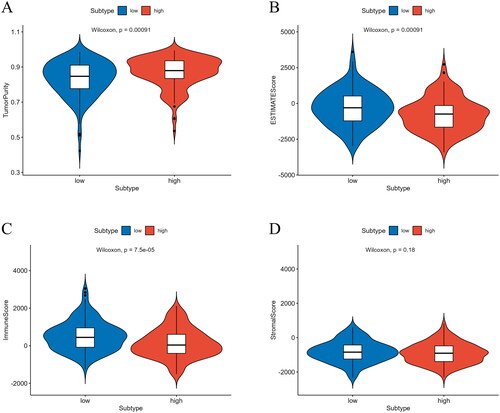
Prognosis is significantly influenced by the proportion of immune and stromal cells, and in the TME, they are the two primary non-tumor components involved in tumor growth and metastasis [Citation28]. To predict the infiltration of immune cells, we calculated the immune, tumor purity, and stromal scores. Using these scores, we accurately predicted the proportion of immune and stromal cells in the TME. The ESTIMATE and immune scores of the high-risk group were noticeably lower, indicating that the infiltration of immune and stromal cells in the high-risk group was lower. In addition, the tumor purity score of the high-risk group was notably higher, indicating that the proportion of tumor cells was higher in the high-risk group (). Thus, the high-risk group had higher tumor purity and lower immune cell infiltration, which may be associated with poor prognosis.
Figure 8. Analysis of differences in immune scores between high/low-risk groups. (A) Analysis of differences in tumor purity scores between high/low-risk groups. (B) Analysis of differences in ESTIMATE scores between high/low-risk groups. (C) Analysis of differences in immune scores between high/low-risk groups. (D) Analysis of differences in stromal scores between high/low-risk groups.
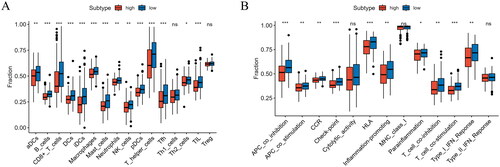
To understand the immune landscape of patients with different prognoses, we analyzed the levels of immune cells and immune-associated functions in the two groups. The expression of T helper cells, CD8+ T cells, aDCs, and macrophages in the low-risk group was significantly higher (p < 0.05) (). Most immune functions, including HLA, Type I IFN response, and APC co-inhibition, were also notably higher in the low-risk group (p < 0.05) (). Therefore, the low-risk group exhibited a high immune status, and based on survival analysis, we speculated that CC patients with a high immune status may exhibit a good prognosis.
Figure 9. Analysis of immune cell abundance and immune function in high/low-risk groups. (A) Expression levels of immune cells in high/low-risk groups. (B) Immune function levels in high/low-risk groups (*p < 0.05, **p < 0.01, ***p < 0.001).
3.8. IC And immunotherapy analysis
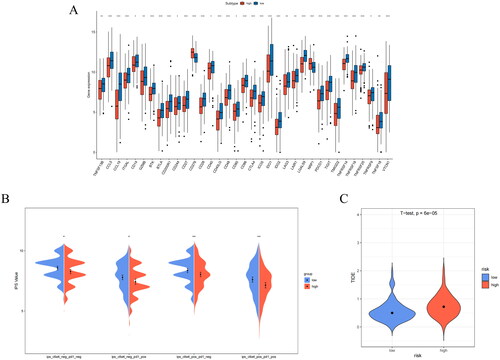
Tumor immunotherapy is a promising new treatment method following surgery, radiotherapy, and chemotherapy and has great potential to improve patient prognosis [Citation29]. Using the reported IC gene set, we detected differences in IC between the two groups. All the ICs exhibited significant differences. The expression of ICs in the low-risk group was generally higher (p < 0.05) (). The expression levels of immune checkpoints are higher, which means that when immune checkpoint treatment is targeted with immunity inhibitor, the treatment effect of the low-risk group may be better. Immune checkpoint, IPS, and TIDE score are three ways to predict the response of patients in the high- and low-risk groups to immunotherapy, respectively. To assess the possible response of patients to immunotherapy, we performed analyses using these different approaches. To assess the possible immunotherapy response of the patients, we analyzed the IPS and TIDE scores of the two groups using various methods. IPS score is an indicator of tumor immunogenicity, and high IPS score indicates that the sample is more immunogenic. Immunogenicity refers to the ability to elicit an immune response, and the stronger the performance, the better the effect of immunotherapy. PD1 and CTLA-4 are the most common indexes for calculating IPS scores. IPS is introduced by the expression of PD1 or CTLA-4 in immune cells as an index to distinguish the population who will benefit from immunotherapy. The TIDE score is used to assess the possibility of immune escape. A low TIDE score indicates that the patient is less likely to have immune escape while undergoing immunotherapy and is more suitable for immunotherapy. The IPS was higher () and the TIDE score was lower in the low-risk group than in the high-risk group (). The research further indicated that for patients in the high-risk group, the use of immunotherapy should be carefully considered, whereas for patients in the low-risk group, immunotherapy may be an effective treatment option that could help patients achieve better treatment outcomes and survival rates.
Figure 10. Analysis of IC expression and prediction of immunotherapy response in high/low-risk groups. (A) IC expression levels in high/low-risk groups. (B) IPS score in high/low-risk groups. (C) TIDE score prediction in high/low-risk groups (*p < 0.05, **p < 0.01).
3.9. Drug sensitivity analysis
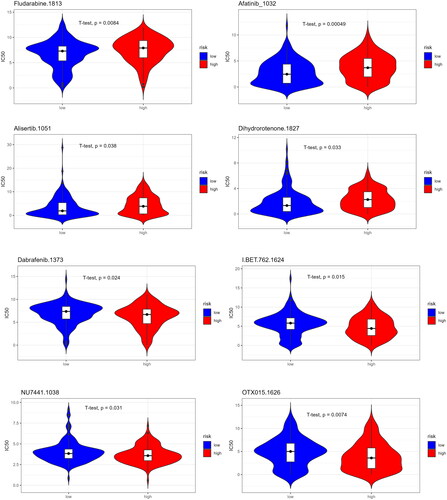
To provide drug references for patients with different prognoses, we predicted drug sensitivity based on the IC50 value of a patient population to a drug. If the IC50 value of a drug is significantly lower in the low-risk group than in the high-risk group, it indicates that patients in the low-risk group are generally more sensitive to the drug. As can be seen from the figure, low-risk CC patients were more sensitive to Fludarabine, Afatinib, Alisertib, and Dihydrorotenone and were more suitable for treatment with these four drugs. High-risk CC patients were more sensitive to Dabrafenib, BET.762, NU7441, and OTX015 () and were more suitable for treatment with these four drugs.
Figure 11. Prediction of drug sensitivity in high/low-risk groups.
4. Discussion
The interaction between HSP and various oncogenes drives cancer progression and is linked to tumor cell survival, invasion, metastasis, and chemotherapy resistance [Citation10]. For example, HSP90 overexpression significantly enhances glycolysis and proliferation of liver cancer cells [Citation30]. HSP27 induces SUMOylation modification of HSPB8, upregulates HSPB8, and enhances the proliferation and metastasis of breast cancer cells [Citation31]. The characteristics of HSPs provide cancer cells with unique survival and proliferation gains, promoting malignant growth. Therefore, we focused on the relationship between HSP-related genes and the survival of CC patients and created a CC prognostic model of HSP-related genes through LASSO regression analysis. Finally, we demonstrated that the model had excellent predictive performance and is expected to play a greater role in future research and practice.
Our analysis revealed a strong association between the expression of 12 genes and the survival of CC patients, and a prognostic model was constructed based on these 12 genes. SERPINH1, also known as HSP47, is upregulated in various cancers and is implicated in poor prognosis [Citation32]. Studies have shown that SERPINH1 is significantly upregulated in CC, and downregulation of SERPINH1 expression significantly inhibits the proliferation, migration, and invasion of CC cells [Citation33]. HSPA5 has an important anti-apoptotic function, and some cancer cells adapt to chronic stress in the TME by upregulating HSPA5 [Citation34]. Luo et al. [Citation35] found that HSPA5 contributes to CC progression and drug resistance, is increased in some patients with CC, and is implicated in poor prognosis. CCT6A is a key regulator of cytoskeleton organization and cell cycle [Citation36]. Ma et al. [Citation37] found that CCT6A high levels are associated with larger tumors, lymph node metastasis, higher FIGO stage, and poorer prognosis in patients with CC. CCT6B and CCT6A have been implicated in the prognosis of liver cancer [Citation38]. Hu and Meng et al. [Citation39,Citation40] found that HSPA14 and HSPB8 can serve as prognostic markers for CC. Members of the CCT family are involved in cell migration and cell cycle progression and interact with proteins related to cancer [Citation41]. Dou et al. [Citation42] found that silencing of CCT3 inhibits CC cell malignant behaviors in vitro and that high expression of CCT3 is implicated in dismal prognosis in CC. Currently, research on the prognostic role of DNAJC10, SEC63, HSPH1, DNAJB7, and DNAJC14 in CC is limited, and further research may help to understand the role of these genes in CC development and provide theoretical support for prognostic and treatment strategies. Existing research supports our conclusion that genes in the model contribute to the progression and invasion of CC and could be used together to forecast the clinical outcomes of CC patients.
We examined immune cell infiltration in patients with various prognoses to acquire a broader knowledge of the mechanisms influencing CC prognoses. We found that the low-risk group had higher levels of T helper cells, CD8+ T cells, aDCs, and macrophage infiltration. T helper cells play a crucial role in the adaptive immune system by releasing cytokines and chemokines that promote the activity of other immune cells [Citation43] and have been shown to have a direct cytotoxic effect on tumors in various types of cancer [Citation44]. High levels of T helper cells have been associated with prolonged OS in CC [Citation22]. CD8+ T cells are one of the most important cells in the immune system and are responsible for recognizing and clearing abnormal cells in the body, including cancer and virus-infected cells. In tumor immunotherapy, the primary effector cells are CD8+ T cells that can kill tumor cells and effectively enhance the body’s anti-tumor function [Citation45]. An increase in CD8+ T cells may be linked to better immunotherapy outcomes in CC [Citation46], which is similar to our finding that patients at low risk may be more suitable for immunotherapy based on the IPS and TIDE scores. Mature aDCs can infiltrate tumors, activate immune responses, and recruit immune effector cells [Citation47]. Tumor-associated macrophages are key drivers of tumor progression, metastasis, and treatment resistance, with the M1 subset having anti-tumor effects [Citation48]. Our results suggest that low-risk CC patients had better immune function, as evidenced by higher levels of HLA and other immune function markers compared to high-risk patients. These findings indicate that higher immune cell infiltration is associated with better anti-tumor responses and may be a contributing factor to the better prognosis observed in low-risk CC patients. Therefore, the better prognosis of low-risk CC patients may be related to higher immune cell infiltration and immune function of T helper cells, CD8+ T cells, and aDCs.
We performed drug sensitivity predictions for the two groups to provide drug references for patients with different prognoses. We found that Fludarabine, Afatinib, Alisertib, and Dihydrorotenone were more suitable for low-risk patients, whereas Dabrafenib, BET.762, NU7441, and OTX015 were more suitable for high-risk patients. Alisertib is an Aurora A kinase, a cell cycle and mitosis inhibitor [Citation49]. Studies have shown that alisertib combined with chemotherapy reduces CC tumor progression and improves survival in CC mice [Citation50]. Our drug sensitivity predictions provide preliminary drug references for patients with different prognoses, but further research is warranted to determine drug efficacy in treating CC.
We constructed a CC gene prognostic model using HSP-related genes. We used a multi-gene prognostic model to validate the internal and external datasets and demonstrated its prognostic value in CC patients. We then combined clinical factors such as age and tumor stage with a gene model to create a nomogram that could predict the survival outcome of CC patients more conveniently. Additionally, we studied the immune landscape of patients with different prognoses and predicted treatment drugs to provide important evidence for personalized treatment plans. However, to validate these results, experimental data are required to confirm the relationships between them. Through experiments, we could more accurately assess the effectiveness and reliability of our gene model and prediction methods.
Authors’ contributions
Min Wang contributed to study design, data analysis, and manuscript preparation. Zhizun Li acquired data and revised the manuscript.
Supplemental Material
Download Zip (44.5 KB)Disclosure statement
No potential conflict of interest was reported by the author(s).
Data availability statement
The data and materials used in this study are available from the corresponding author upon reasonable request.
Additional information
Funding
Reference
- Sung H, Ferlay J, Siegel RL, et al. Global cancer statistics 2020: GLOBOCAN estimates of incidence and mortality worldwide for 36 cancers in 185 countries. CA Cancer J Clin. 2021;71(3):209–249. doi: 10.3322/caac.21660.
- Bedell SL, Goldstein LS, Goldstein AR, et al. Cervical cancer screening: past, present, and future. Sex Med Rev. 2020;8(1):28–37. doi: 10.1016/j.sxmr.2019.09.005.
- Canfell K. Towards the global elimination of cervical cancer. Papillomavirus Res. 2019;8:100170. doi: 10.1016/j.pvr.2019.100170.
- Cohen PA, Jhingran A, Oaknin A, et al. Cervical cancer. Lancet. 2019;393(10167):169–182. doi: 10.1016/S0140-6736(18)32470-X.
- Zhu K, Deng C, Du P, et al. G6PC indicated poor prognosis in cervical cancer and promoted cervical carcinogenesis in vitro and in vivo. Reprod Biol Endocrinol. 2022;20(1):50. doi: 10.1186/s12958-022-00921-6.
- Rahman A, Kobayashi M, Sugimoto K, et al. Reduced claudin-12 expression predicts poor prognosis in cervical cancer. Int J Mol Sci. 2021;22(7):3774. doi: 10.3390/ijms22073774.
- Al-Saraireh YM, Alshammari F, Youssef AMM, et al. Cytochrome 4Z1 expression is correlated with poor prognosis in patients with cervical cancer. Curr Oncol. 2021;28(5):3573–3584. doi: 10.3390/curroncol28050306.
- Turashvili G, Wen HY. Multigene testing in breast cancer: what have we learned from the 21-gene recurrence score assay? Breast J. 2020;26(6):1199–1207. doi: 10.1111/tbj.13859.
- Multhoff G, Hightower LE. Distinguishing integral and receptor-bound heat shock protein 70 (Hsp70) on the cell surface by Hsp70-specific antibodies. Cell Stress Chaperones. 2011;16(3):251–255. doi: 10.1007/s12192-010-0247-1.
- Calderwood SK, Gong J. Heat shock proteins promote cancer: it’s a protection racket. Trends Biochem Sci. 2016;41(4):311–323. doi: 10.1016/j.tibs.2016.01.003.
- Han S, Cheng Z, Zhao X, et al. Diagnostic value of heat shock protein 90alpha and squamous cell carcinoma antigen in detection of cervical cancer. J Int Med Res. 2019;47(11):5518–5525. doi: 10.1177/0300060519865634.
- Zeng J, He SL, Li LJ, et al. Hsp90 up-regulates PD-L1 to promote HPV-positive cervical cancer via HER2/PI3K/AKT pathway. Mol Med. 2021;27(1):130. doi: 10.1186/s10020-021-00384-2.
- Liu J, Liu J, Li SZ, et al. Inhibiting HSP70 expression enhances cisplatin sensitivity of cervical cancer cells. Nan Fang Yi Ke Da Xue Xue Bao. 2016;37(4):475–481.
- Medina-Martinez I, Barrón V, Roman-Bassaure E, et al. Impact of gene dosage on gene expression, biological processes and survival in cervical cancer: a genome-wide follow-up study. PLoS One. 2014;9(5):e97842. doi: 10.1371/journal.pone.0097842.
- Lee YY, Kim TJ, Kim JY, et al. Genetic profiling to predict recurrence of early cervical cancer. Gynecol Oncol. 2013;131(3):650–654. doi: 10.1016/j.ygyno.2013.10.003.
- Aolymat I, Hatmal MM, Olaimat AN. The emerging role of heat shock factor 1 (HSF1) and heat shock proteins (HSPs) in ferroptosis. Pathophysiology. 2023;30(1):63–82. doi: 10.3390/pathophysiology30010007.
- Ploner A. maCorrPlot: visualize artificial correlation in microarray data. R package version 1.70.0. 2023. Available from: https://www.bioconductor.org/packages/devel/bioc/manuals/maCorrPlot/man/maCorrPlot.pdf
- Friedman J, Hastie T, Tibshirani R. Regularization paths for generalized linear models via coordinate descent. J Stat Softw. 2010;33(1):1–22.
- Blanche P, Dartigues JF, Jacqmin-Gadda H. Estimating and comparing time-dependent areas under receiver operating characteristic curves for censored event times with competing risks. Stat Med. 2013;32(30):5381–5397. doi: 10.1002/sim.5958.
- Robinson MD, McCarthy DJ, Smyth GK. edgeR: a bioconductor package for differential expression analysis of digital gene expression data. Bioinformatics. 2010;26(1):139–140. doi: 10.1093/bioinformatics/btp616.
- Yu G, Wang LG, Han Y, et al. clusterProfiler: an R package for comparing biological themes among gene clusters. OMICS. 2012;16(5):284–287. doi: 10.1089/omi.2011.0118.
- Chi Y, Xue J, Huang S, et al. CapG promotes resistance to paclitaxel in breast cancer through transactivation of PIK3R1/P50. Theranostics. 2019;9(23):6840–6855. doi: 10.7150/thno.36338.
- Yoshihara K, Shahmoradgoli M, Martinez E, et al. Inferring tumour purity and stromal and immune cell admixture from expression data. Nat Commun. 2013;4(1):2612. doi: 10.1038/ncomms3612.
- Li Y, Feng J, Wang T, et al. Construction of an immunogenic cell death-based risk score prognosis model in breast cancer. Front Genet. 2022;13:1069921. doi: 10.3389/fgene.2022.1069921.
- Yang W, Soares J, Greninger P, et al. Genomics of drug sensitivity in cancer (GDSC): a resource for therapeutic biomarker discovery in cancer cells. Nucleic Acids Res. 2013;41(Database issue):D955–61. doi: 10.1093/nar/gks1111.
- Maeser D, Gruener RF, Huang RS. oncoPredict: an R package for predicting in vivo or cancer patient drug response and biomarkers from cell line screening data. Brief Bioinform. 2021;22(6):bbab260.
- Pei JP, Zhang CD, Yusupu M, et al. Screening and validation of the Hypoxia-Related signature of evaluating tumor immune microenvironment and predicting prognosis in gastric cancer. Front Immunol. 2021;12:705511. doi: 10.3389/fimmu.2021.705511.
- Arneth B. Tumor microenvironment. Medicina. 2019;56(1):15. doi: 10.3390/medicina56010015.
- Cogdill AP, Andrews MC, Wargo JA. Hallmarks of response to immune checkpoint blockade. Br J Cancer. 2017;117(1):1–7. doi: 10.1038/bjc.2017.136.
- Xu Q, Tu J, Dou C, et al. HSP90 promotes cell glycolysis, proliferation and inhibits apoptosis by regulating PKM2 abundance via thr-328 phosphorylation in hepatocellular carcinoma. Mol Cancer. 2017;16(1):178. doi: 10.1186/s12943-017-0748-y.
- Wang S, Zhang X, Wang H, et al. Heat shock protein 27 enhances SUMOylation of heat shock protein B8 to accelerate the progression of breast cancer. Am J Pathol. 2020;190(12):2464–2477. doi: 10.1016/j.ajpath.2020.04.012.
- Wang Y, Gu W, Wen W, et al. SERPINH1 is a potential prognostic biomarker and correlated with immune infiltration: a pan-cancer analysis. Front Genet. 2021;12:756094. doi: 10.3389/fgene.2021.756094.
- Yamamoto N, Kinoshita T, Nohata N, et al. Tumor-suppressive microRNA-29a inhibits cancer cell migration and invasion via targeting HSP47 in cervical squamous cell carcinoma. Int J Oncol. 2013;43(6):1855–1863. doi: 10.3892/ijo.2013.2145.
- Lee AS. Glucose-regulated proteins in cancer: molecular mechanisms and therapeutic potential. Nat Rev Cancer. 2014;14(4):263–276. doi: 10.1038/nrc3701.
- Luo C, Qiu J. miR-181a inhibits cervical cancer development via downregulating GRP78. Oncol Res. 2017;25(8):1341–1348. doi: 10.3727/096504017X14867268787969.
- Yam AY, Xia Y, Lin HT, et al. Defining the TRiC/CCT interactome links chaperonin function to stabilization of newly made proteins with complex topologies. Nat Struct Mol Biol. 2008;15(12):1255–1262. doi: 10.1038/nsmb.1515.
- Ma J, Yang L, Feng H, et al. CCT6A may act as a potential biomarker reflecting tumor size, lymphatic metastasis, FIGO stage, and prognosis in cervical cancer patients. J Clin Lab Anal. 2021;35(8):e23793.
- Li W, Liu J, Zhao H. Prognostic power of a chaperonin containing TCP-1 subunit genes panel for hepatocellular carcinoma. Front Genet. 2021;12:668871. doi: 10.3389/fgene.2021.668871.
- Hu YX, Zheng MJ, Zhang WC, et al. Systematic profiling of alternative splicing signature reveals prognostic predictor for cervical cancer. J Transl Med. 2019;17(1):379. doi: 10.1186/s12967-019-02140-x.
- Meng D, Jin H, Zhang X, et al. Identification of autophagy-related risk signatures for the prognosis, diagnosis, and targeted therapy in cervical cancer. Cancer Cell Int. 2021;21(1):362. doi: 10.1186/s12935-021-02073-w.
- Vallin J, Grantham J. The role of the molecular chaperone CCT in protein folding and mediation of cytoskeleton-associated processes: implications for cancer cell biology. Cell Stress Chaperones. 2019;24(1):17–27. doi: 10.1007/s12192-018-0949-3.
- Dou L, Zhang X. Upregulation of CCT3 promotes cervical cancer progression through FN1. Mol Med Rep. 2021;24(6):856. doi: 10.3892/mmr.2021.12496.
- Murphy KM, Reiner SL. The lineage decisions of helper T cells. Nat Rev Immunol. 2002;2(12):933–944. doi: 10.1038/nri954.
- Oh DY, Fong L. Cytotoxic CD4(+) T cells in cancer: expanding the immune effector toolbox. Immunity. 2021;54(12):2701–2711. doi: 10.1016/j.immuni.2021.11.015.
- Han J, Khatwani N, Searles TG, et al. Memory CD8(+) T cell responses to cancer. Semin Immunol. 2020;49:101435. doi: 10.1016/j.smim.2020.101435.
- Xu F, Zhang F, Wang Q, et al. The augment of regulatory T cells undermines the efficacy of anti-PD-L1 treatment in cervical cancer. BMC Immunol. 2021;22(1):60. doi: 10.1186/s12865-021-00451-7.
- Lei X, Lei Y, Li JK, et al. Immune cells within the tumor microenvironment: biological functions and roles in cancer immunotherapy. Cancer Lett. 2020;470:126–133. doi: 10.1016/j.canlet.2019.11.009.
- Wu K, Lin K, Li X, et al. Redefining Tumor-Associated macrophage subpopulations and functions in the tumor microenvironment. Front Immunol. 2020;11:1731. doi: 10.3389/fimmu.2020.01731.
- Vagiannis D, Zhang Y, Budagaga Y, et al. Alisertib shows negligible potential for perpetrating pharmacokinetic drug-drug interactions on ABCB1, ABCG2 and cytochromes P450, but acts as dual-activity resistance modulator through the inhibition of ABCC1 transporter. Toxicol Appl Pharmacol. 2022;434:115823. doi: 10.1016/j.taap.2021.115823.
- Tayyar Y, Idris A, Vidimce J, et al. Alpelisib and radiotherapy treatment enhances alisertib-mediated cervical cancer tumor killing. Am J Cancer Res. 2021;11(6):3240–3251.