
 ?Mathematical formulae have been encoded as MathML and are displayed in this HTML version using MathJax in order to improve their display. Uncheck the box to turn MathJax off. This feature requires Javascript. Click on a formula to zoom.
Abstract
Introduction
Hyperthermia (HT) induces various cellular biological processes, such as repair impairment and direct HT cell killing. In this context, in-silico biophysical models that translate deviations in the treatment conditions into clinical outcome variations may be used to study the extent of such processes and their influence on combined hyperthermia plus radiotherapy (HT + RT) treatments under varying conditions.
Methods
An extended linear-quadratic model calibrated for SiHa and HeLa cell lines (cervical cancer) was used to theoretically study the impact of varying HT treatment conditions on radiosensitization and direct HT cell killing effect. Simulated patients were generated to compute the Tumor Control Probability (TCP) under different HT conditions (number of HT sessions, temperature and time interval), which were randomly selected within margins based on reported patient data.
Results
Under the studied conditions, model-based simulations suggested a treatment improvement with a total CEM43 thermal dose of approximately 10 min. Additionally, for a given thermal dose, TCP increased with the number of HT sessions. Furthermore, in the simulations, we showed that the TCP dependence on the temperature/time interval is more correlated with the mean value than with the minimum/maximum value and that comparing the treatment outcome with the mean temperature can be an excellent strategy for studying the time interval effect.
Conclusion
The use of thermoradiobiological models allows us to theoretically study the impact of varying thermal conditions on HT + RT treatment outcomes. This approach can be used to optimize HT treatments, design clinical trials, and interpret patient data.
1. Introduction
Hyperthermia (HT) is a well-known radiosensitizer that aims to heat the tumors to 39–43 °C for a certain period (usually an hour). The benefits of combining HT with radiotherapy (RT) have been clinically proven for different cancer locations [Citation1–7]. Furthermore, several in-vitro studies have demonstrated that HT induces various biological mechanisms that may explain the obtained clinical improvement, such as repair impairment [Citation8–10], direct HT cell killing [Citation10–13] or reoxygenation of hypoxic cells [Citation14–16].
Nevertheless, in-vitro studies correspond to simplified scenarios (isolated 2D cell cultures) with well-controlled conditions (constant temperature and oxygen level, known number of initial cells, etc.). Patients constitute a more complex scenario with heterogeneous conditions and processes simultaneously occurring at the molecular [Citation17–19], cellular [Citation20, Citation21] and tissue level [Citation22–24]. Moreover, patients treated with HT in combination with RT exhibit variations in the conditions (e.g., temperature, number of HT sessions or time interval between HT and RT) that may affect HT-related biological processes. Therefore, identifying how each biological process affects treatment outcomes in conventional clinical studies is challenging.
In addition to patient data analyses, biophysical models may investigate the translation of deviations in treatment conditions into outcome variations (e.g., Scheidegger et al. [Citation25] presented a model to study the immune system response under different HT + RT schedules). These models can be used to study the theoretical impact of altered conditions on treatment outcome [Citation25–29], design clinical trials [Citation30–33] and to test the required model complexity [Citation34] and model parameter resolution [Citation35–37].
Diverse in-silico models have been proposed to study the cellular effects of HT + RT [Citation38–43]. For example, van Leeuwen et al. [Citation44] developed an extended linear-quadratic (LQ) model to optimize and evaluate the quality of different HT + RT treatment plans using Equivalent Dose (EQD) calculations. Additionally, several publications from this research group evaluate HT + RT plans for individual patients by performing 3D voxel-based EQD calculations to account for heterogeneous radiation dose and temperature distributions [Citation44–49].
Our study primarily focused on inter-patient heterogeneities in treatment conditions instead of those among individual patients. Therefore, in a model-based simulation, we studied how variations in HT-related treatment conditions (number of HT sessions, temperature, and time interval) can influence the outcome of HT + RT cervical cancer treatments. To this end, the extended LQ model presented by van Leeuwen et al. [Citation44] was used to perform Tumor Control Probability (TCP) calculations. First, four HT + RT schedules were simulated as examples to study the impact of low-/high-temperature HT sessions on the treatment outcome. Additionally, we examined the TCP dependence on the temperature, time interval, and total thermal dose (CEM43). Finally, the importance of including inter-patient heterogeneity was investigated.
2. Material and methods
2.1. In-silico radiosensitization and direct HT cell killing model
Van Leeuwen et al. [Citation44] defined a model to fit clonogenic data (i.e., measurements of the cell’s ability to duplicate after exposure to a specific stress [Citation50]) at different temperatures and time intervals. This model redefines the parameters of the LQ model [Citation51, Citation52] to describe RT cell killing including the HT radiosensitization effect (SFRT):
(1)
(1)
with
(2)
(2)
(3)
(3)
where
,
,
,
, T (°C) is the temperature,
(h−1) is the rate at which the radiosensitization effect of HT disappears,
(h) is the time interval between HT and RT and D (Gy) is the radiation dose per fraction.
Assuming an Arrhenius relationship [Citation20] and a first-order reaction, direct HT cell killing (SFHT) is given by
(4)
(4)
where tHT (s) is the heating time, and k(T) is the rate of direct hyperthermic cytotoxicity, defined as
(5)
(5)
where T (°C) is the temperature, ΔS (cal/°C/mol) is the entropy of inactivation and ΔH (cal/mol) is the inactivation energy of the critical rate-limiting molecules that cause cell lethality.
Therefore, the final survival after a HT + RT treatment (SF) is given by
(6)
(6)
2.2. Used model parameters
Van Leeuwen et al. [Citation44] used the SiHa and HeLa cervical cancer cell lines to perform cell survival experiments at diverse temperatures (39–42 °C), time intervals (10–240 min) and treatment sequences (HT before or after RT) to calibrate the model parameters (). These cell lines were selected because they represent one of the most complete data-sets available in the literature, and considering that both cell lines correspond to cervical cancer, our study is representative of this tumor location.
Table 1. Model parameters used in the presented simulations corresponding to the values obtained by van Leeuwen et al. [Citation44] for SiHa and HeLa cell lines. All the model parameters (except ΔH which was fixed) were obtained from a regression model analysis and, for simplicity, their confidence intervals were not considered in this study.
Additionally, van Leeuwen et al. [Citation44] stated that the obtained decay constants () are relatively low in comparison with other in-vitro [Citation53] and in-vivo [Citation54] data, where time decay constants around 0.5 h−1 were obtained. Therefore, a value of
was also considered to study the case where the time interval has a higher impact. and Supplementary Figure S1 present a graphical representation of the time interval effect at different temperatures.
Figure 1. Survival fraction of the SiHa cell line at diverse time intervals between HT and RT after a radiation fraction of 2 Gy and a HT treatment at 39 °C (blue line), 41 °C (orange line) or 43 °C (red line) and with a decay constant of (left) or
(right). Additionally, the survival baseline without HT (black line) is included and the time interval is positive or negative if HT is given before or after RT, respectively.
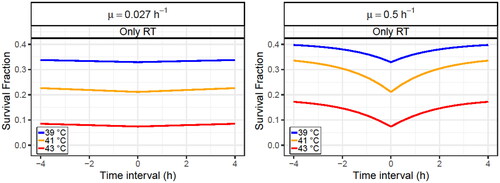
and Supplementary Figure S1 show that direct HT cell killing prevents survival from returning to the RT baseline when the radiosensitization effect fades away. Additionally, because of the absolute value included in the time interval term of EquationEquations (2)(2)
(2) and Equation(3)
(3)
(3) , the survival is independent of the treatment sequence (i.e., HT before or after RT). This assumption was consistent with the experimental data presented by van Leeuwen et al. [Citation44]. However, for other cell lines, applying HT before or after RT may have an impact on the radiosensitizing effect; therefore, this statement may not be generalizable to all cell lines.
2.3. Tumor control probability (TCP) calculation
Using the previously described thermoradiobiological model and assuming complete repair between consecutive irradiation fractions, the number of surviving cells after each fraction (N) was calculated as follows:
(7)
(7)
where N0 is the initial number of cells, D is the dose per fraction, and SF is the cell survival for a particular fraction calculated using the previously described model.
The final number of surviving cells (Nfinal) after treatment was calculated as follows:
(8)
(8)
where Nfractions is the total number of fractions, and SFi is the survival of the i-th fraction.
Finally, the TCP was calculated following a Poisson distribution [Citation34]:
(9)
(9)
2.4. Thermal dose CEM43 calculation
Sapareto et al. [Citation55] derived an equation to estimate a thermal dose that translates different time–temperature treatments to an equivalent exposure time at 43 °C with the same HT-related biological effect. The thermal dose is based on the Arrhenius relationship [Citation20] and is calculated as follows:
(10)
(10)
where T (°C) is the temperature and R is the factor to compensate for a 1 °C temperature change (R = 0.5 for T > 43 °C and R = 0.25 for T ≤ 43 °C).
2.5. Simulated treatment conditions
In the Cervical Cancer Dutch Deep Hyperthermia Trial [Citation1], most patients had tumor diameters between 60 and 80 mm. Hence, considering a spherical tumor shape with a 70 mm diameter, a tumor volume of 180 cm3 was used, and assuming an average volume of 210−9 cm3 per cell, the initial number of cells (N0) was equal to 9 × 10¹⁰.
Regarding the HT + RT treatments, two RT schedules consisting of 30 and 40 fractions of 2 Gy were assumed for the SiHa and HeLa cell lines, respectively. For each cell line, the same RT schedule was used for all simulated patients to obtain a baseline TCP (RT only) around 0.5. These RT schedules are clinically relevant when compared with the Cervical Cancer Dutch Deep Hyperthermia Trial [Citation1] (cumulative pelvic side wall dose up to 60 Gy) and German guidelines for cervical cancer treatment [Citation56] (at least an equivalent dose of 85 Gy should be achieved). For the HT treatment, the ranges of study for the HT treatment conditions () were established based on the data reported in the reviews of Carrapiço-Seabra et al. [Citation57] and Ademaj et al. [Citation58]. These margins were defined by considering data (number of HT sessions, all temperature metrics, and time intervals) from diverse cancer locations treated with deep HT to cover most of the reported patients. Finally, a one-hour steady state was assumed for all HT sessions.
Table 2. Margins established for the thermal treatments based on patient data reported in the reviews of Carrapiço-Seabra et al. [Citation57] and Ademaj et al. [Citation58].
2.6. Impact of low/high temperature HT sessions
From the temperatures reported in , the minimum (39 °C), the mean (41 °C) and the maximum (43 °C) temperature values were used to define a low, medium and high temperature HT session, respectively. Four different schedules were used as examples to study the impact of low- and high-temperature HT sessions ():
Figure 2. Graphical scheme of the four different schedules used to study the impact of low/high temperature HT sessions for a diverse number of HT sessions. Each circle corresponds to a HT session at 39 °C (blue), 41 °C (green) or 43 °C (red).
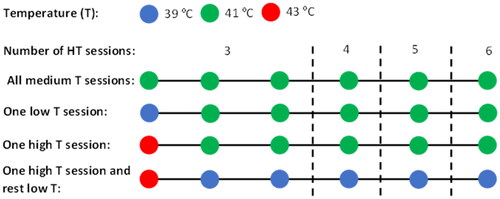
Baseline schedule with all HT sessions at a medium temperature (41 °C).
Schedule with one HT session at a low temperature (39 °C) and the rest at a medium temperature (41 °C).
Schedule with one HT session at a high temperature (43 °C) and the rest at a medium temperature (41 °C).
Schedule with a HT session at a high temperature (43 °C) and the rest at a low temperature (39 °C).
It is essential to highlight that the calculations presented in this manuscript do not depend on the frequency (e.g., once or twice a week) or order of HT sessions.
2.7. TCP dependencies
Diverse simulated patients were generated to study the TCP dependencies on the treatment conditions.
2.7.1. Temperature dependence
104 simulated patients were included in the simulation. Each patient was treated with four HT sessions, and in each session, the temperature was randomly selected from a uniform distribution between 39 and 43 °C (). A fixed time interval between HT and RT of 30 min was considered for all simulated patients.
2.7.2. Time interval dependence
104 simulated patients were included in the simulation. Each patient was treated with four HT sessions; in each session, the time interval was randomly selected from a uniform distribution between 10 and 240 min (). This procedure was repeated at three fixed temperatures (39, 41, and 43 °C).
2.7.3. Temperature and time interval dependence
Simulated patients were generated with 3–6 HT sessions, and in each session, the temperature and time intervals were randomly chosen from uniform distributions within the limits shown in . Ultimately, 104 simulated patients were selected for each number of HT sessions.
2.7.4. Thermal dose dependence
Simulated patients were generated with 3–6 HT sessions, and in each session, the temperature was randomly selected from a uniform distribution between 37 and 43 °C. In this case, the minimum allowed temperature was set as 37 °C (instead of the 39 °C reported in ) to obtain thermal doses closer to 0 and to better show the TCP rise at low thermal doses. Four cases were studied, considering fixed time intervals of 10, 60, 120, and 240 min. Finally, to ensure sufficient statistics for all the thermal doses,106 simulated patients were generated for each number of HT sessions and time interval. The TCP and CEM43 values were calculated, and the simulated patients were divided into total thermal dose (CEM43) intervals to calculate the mean TCP value.
2.8. Inter-patient heterogeneity
Two sources of inter-patient heterogeneity were considered: tumor volume and radiosensitivity. For the former one, a Gaussian distribution (µ = 201.6 cm3 and σ = 119.7 cm3) was defined from the tumor diameters reported in the Cervical Cancer Dutch Deep Hyperthermia Trial [Citation1] and considering a spherical shape to calculate the tumor volumes. Conversely, regarding radiosensitivity heterogeneities, higher stability is observed in model parameter ratios (e.g., α/β) than in the individual parameters (e.g., α or β) [Citation59]. Hence, for simplicity, only a variation in the parameter was considered and the other radiosensitivity-related parameters (i.e.,
,
and
) were adjusted to maintain constant ratios concerning
. Therefore, the values of
were randomly selected from a Gaussian distribution with a mean value as presented in and a coefficient of variation (
) of 5% or 50% to simulate scenarios of low or high inter-patient heterogeneity, respectively. Additionally, from in-vitro experiments with cervical cancer cell lines [Citation44, Citation60–67],
values between 0.2 and 0.74 Gy−1 were obtained. Hence, only
values within this range were considered in this study.
demonstrates that the radiosensitivity heterogeneity had a greater impact on the dose-control relationship than tumor volume heterogeneity. Nevertheless, both inter-patient heterogeneities were considered to obtain more realistic results.
Figure 3. Obtained dose-control curves for simulated patients (without HT). A case without inter-patient heterogeneity (left) and with inter-patient heterogeneity (right) are presented. Two cases assume inter-heterogeneity only in the radiosensitivity (red line) and the tumor volume (green line). The SiHa cell line model parameters were considered for this analysis.
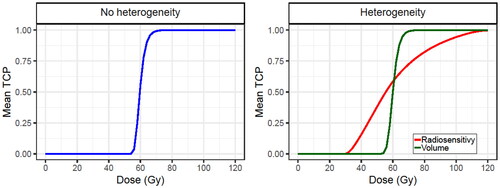
Finally, because of the lower radiosensitivity of the HeLa cell line, the dose-control curve is shifted to the right in comparison to the curve for SiHa cell line (Supplementary Figure S2). This is why a higher number of RT fractions should be delivered to HeLa cells to have a similar TCP.
2.9. Statistical analyses
The Spearman’s rank order correlation (ρ) and Kendall’s rank correlation coefficient (τ) were used to evaluate possible TCP dependencies on diverse treatment conditions (e.g., minimum, mean or maximum time interval/temperature). Finally, because of the large number of simulated patients, p-values smaller than 10−5 were obtained in all calculations; therefore, they are not reported in this manuscript.
3. Results
Various scenarios were evaluated to study the influence of different parameters on the TPC calculation for cervical cancer HT + RT treatments. First, the impact of low/high temperature HT sessions was simulated (Section 3.1). Second, the dependencies of TCP on the diverse treatment conditions and the total thermal dose (CEM43) were studied (Section 3.2). Finally, the inclusion of inter-patient heterogeneity (Section 3.3) was considered.
The analysis in this study focused on two cervical cancer cell lines, SiHa and HeLa. In light of the similar results obtained for both cell lines, the analysis for SiHa is presented in the main text and, most of the analysis for HeLa cells is included in the Supplementary Materials.
3.1. Impact of low/high temperature HT sessions
The schedules described in Section 2.6 were simulated to study the effects of the low-/high-temperature HT sessions.
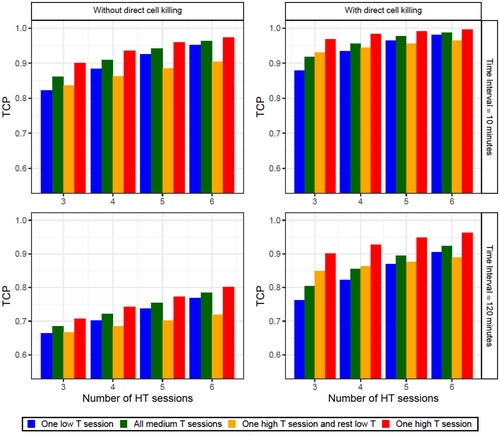
As expected, the best schedule was one that reached a high temperature (43 °C) in one HT session while maintaining reasonable temperatures (41 °C) in the rest of the sessions (red bars in and Supplementary Figure S3). Nevertheless, similar results were usually obtained by a schedule with a medium temperature (41 °C) in all HT sessions (green bars in and in Supplementary Figure S3). The main difference between these two schedules is the direct HT cell killing produced during the high temperature HT session. This is why the highest differences between both schedules correspond to cases with fewer HT sessions (i.e., individual HT sessions have a higher impact) or cases considering direct HT cell killing and a long time interval (i.e., when the radiosensitization effect has a smaller contribution). Thus, under these conditions, a schedule with a high-temperature HT session and low-temperatures in the remaining HT sessions (orange bars in and Supplementary Figure S3) can obtain a reasonably good outcome. However, when the number of low-temperature HT sessions was increased, the importance of the high temperature HT session is reduced, and this schedule resulted in a smaller TCP value than the other schedules studied. Finally, it was demonstrated that good treatments could still be performed with a low-temperature HT session as long as at least a medium temperature was obtained in the rest of the sessions (blue bars in and Supplementary Figure S3).
Figure 4. TCP obtained for the diverse number of HT sessions considering (right column) or not (left column) direct HT cell killing and with a time interval of 10 (upper row) or 120 (lower row) min. Four different schedules were considered: a schedule with one session at 39 °C and the rest of the sessions at 41 °C (blue bars), a schedule with all the sessions at 41 °C (green bars), a schedule with a session at 43 °C and the rest of the sessions at 39 °C (orange bars) and a schedule with a session at 43 °C and the rest of the sessions at 41 °C (red bars). Finally, in the legend the parameter T stands for the temperature. The SiHa cell line model parameters were considered for this analysis.
3.2. TCP dependencies
3.2.1. Temperature dependence
Simulated patients were generated under the conditions described in Section 2.7.1. to study the dependence of the TCP on the minimum, mean, and maximum temperatures when direct HT cell killing was considered or not (, , Supplementary Table S1, and Figure S4).
Figure 5. Obtained TCP values for 104 simulated patients (each point in the plots corresponds to a patient) after four HT sessions with 30 min time intervals, achieving a temperature randomly selected from a uniform distribution between 39 and 43 °C for each HT session. The minimum (left column), the mean (middle column) and the maximum (right column) temperatures are shown for each patient plotted when direct HT cell killing is considered (lower row) or not (upper row). The SiHa cell line model parameters were considered for this analysis.
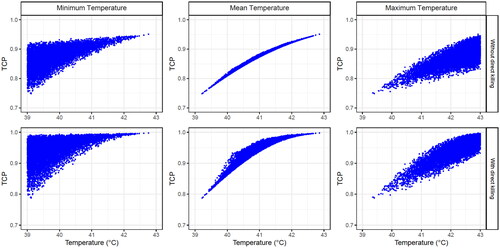
Table 3. Correlation coefficients obtained when comparing the TCP with the minimum, mean and maximum temperature. The values presented in this table correspond to when only radiosensitization is considered (outside parentheses) and direct HT cell kill is also included (inside parentheses). The SiHa cell line model parameters were considered for this analysis.
A robust correlation was obtained when the TCP was compared with the mean temperature of all HT sessions, whereas a moderate correlation was obtained for the minimum/maximum temperature. This means that the treatment outcome was more closely to the overall treatment (i.e., the combined effect of all HT sessions) than to a single HT session. Furthermore, this correlation usually worsened when direct HT cell killing was included.
3.2.2. Time interval dependence
Simulated patients were generated under the conditions described in Section 2.7.2. to study the dependence of the TCP on the minimum, mean, and maximum time interval ( and Supplementary Table S2).
Table 4. Correlation coefficients obtained when comparing the TCP with the minimum, mean and maximum time interval and considering diverse temperatures and decay constants.
For time-interval dependence, it can also be concluded that the treatment outcome is more closely related to the mean time interval of all HT sessions (overall treatment) than to the minimum/maximum value (single HT sessions). Therefore, only TCP dependence on the mean time interval is presented for low and high decay constants when direct HT cell killing is considered or not (, , Supplementary Figure S5 and Table S3).
Figure 6. Obtained TCP values for 104 simulated patients (each point in the plots corresponds to a patient) after four HT sessions at 39 (blue points), 41 °C (orange points) and 43 °C (red points) with time intervals randomly selected from a uniform distribution between 10 and 240 min for each HT session. The dependence on the mean time interval for each patient is plotted using a decay constant of (left column) or decay constant of
(right column) and considering (lower row) or not (upper row) direct HT cell killing. The SiHa cell line model parameters were considered for this analysis.
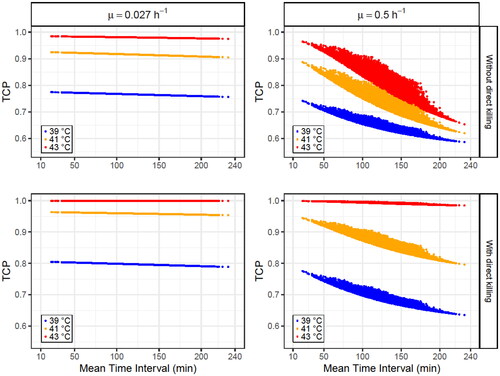
Table 5. TCP variations (ΔTCP = TCPmax – TCPmin) obtained for diverse temperatures and decay constants. The values presented in this table correspond to when only radiosensitization is considered (outside parentheses) and direct HT cell kill is also included (inside parentheses). The SiHa cell line model parameters were considered for this analysis.
The obtained results present a high dependence on the decay constant ( and Supplementary Table S3): TCP variations of the order of 10−6 − 10−2 are observed for low decay constants, while a higher decay constant () leads to variations one order of magnitude higher. Furthermore, the time interval effect is reduced when direct HT cell killing is considered because this biological effect is independent of the time interval (EquationEquation (4)
(4)
(4) ). Additionally, the time interval effect is usually more pronounced at higher temperatures, independent of the decay constant, which agrees with the results reported by Kok et al. [Citation49]. However, this statement is not true when direct HT cell killing is considered at 43 °C because, at this high temperature, most of the cells are directly killed by HT (TCP > 0.97 when radiosensitization is not considered) and, therefore, under these conditions, the time interval effect can only produce small TCP variations (<3 × 10⁻²).
3.2.3. Random patient results
Simulated patients were generated under the conditions described in Section 2.7.3. to study the dependence of the TCP on the temperature and time interval (, and , Supplementary Table S4 and Figures S6 and S7).
Figure 7. Obtained TCP values for 4 × 10⁴ simulated patients (each point in the plots corresponds to a patient) with different number of HT sessions (3–6). In each HT session, time interval and temperature were randomly selected from uniform distributions within the limits shown in . The dependence on the mean temperature (left column) and the mean time interval (right column) for each patient are plotted when direct HT cell killing is considered (low row) or not (up row). For these simulations, a decay constant of is considered. The SiHa cell line model parameters were considered for this analysis.
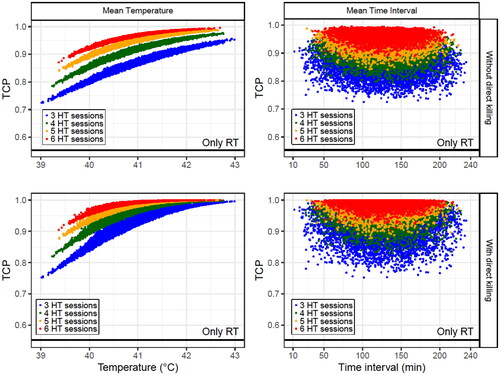
Figure 8. Obtained TCP values for 4 × 10⁴ simulated patients (each point in the plots corresponds to a patient) with different number of HT sessions (3–6). In each HT session, time interval and temperature randomly selected from uniform distributions within the limits shown in . The dependence on the mean temperature (left column) and the mean time interval (right column) for each patient are plotted when direct HT cell killing is considered (low row) or not (up row). For these simulations, a decay constant of is considered. The SiHa cell line model parameters were considered for this analysis.
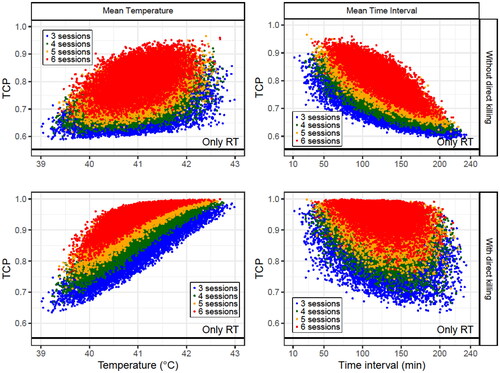
Table 6. Correlation coefficient ranges obtained when comparing the TCP for a given number of HT sessions with the mean temperature and time interval. The values presented in this table correspond to when only radiosensitization is considered (outside parentheses) and when direct HT cell killing is also included (inside parentheses). The SiHa cell line model parameters were considered for this analysis.
As expected, no correlation was observed with the mean time interval when the decay constant was low ( and Supplementary Table S4). Additionally, this correlation became moderate/strong with a higher decay constant. However, a weak correlation was obtained when direct HT cell killing was included because this biological process does not depend on the time interval.
However, when the decay constant was small, comparing the TCP with the mean temperature resulted in a robust correlation that was slightly worsened if direct HT cell killing was included in the calculations. Furthermore, when the decay constant increased, the correlation with the mean temperature weakened; however, this correlation increased when direct HT cell was considered.
3.2.4. CEM43 dependence
This procedure, as explained in Section 2.7.4, was used to study the dependence of the TCP on the total thermal dose.
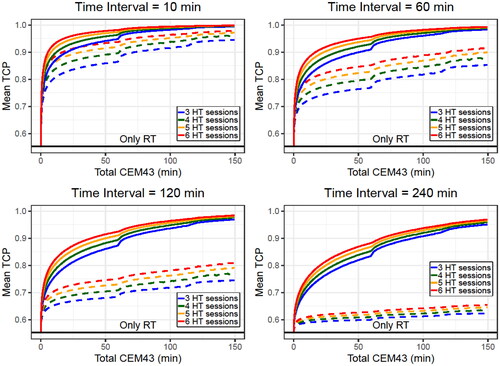
and Supplementary Figure S8 show that direct HT cell killing did not drastically change the TCP value when the time interval was short. Also, the TCP rapidly rises at small CEM43 values, showing a clear improvement with a total CEM43 of 10 min (this value can be obtained with 6 HT sessions at 40.5 °C). However, when the time interval increases (i.e., the radiosensitization effect is reduced), the direct HT cell killing becomes more important. A clear example is the case of the 240 min time interval: radiosensitization alone does not improve the outcome but, when direct HT cell killing is included, a clear improvement is observed for high total CEM43 values (i.e., high temperatures). Finally, schedules with more HT sessions had higher mean TCP values for similar thermal doses.
Figure 9. Mean TCP values obtained for diverse total CEM43 values when direct HT cell killing is considered (solid line) or not (dashed line). 106 simulated patients with different number of HT sessions were generated with temperatures randomly selected from a uniform distribution between 37 and 43 °C. In each plot the time interval was fixed for all the simulated patients and a decay constant of was considered. The SiHa cell line model parameters were considered for this analysis.
3.3. Inter-patient heterogeneity
First, a coefficient of variation of c.v. = 5% was assumed to study a case with small inter-patient heterogeneity, which might correspond to a case with patients at a similar cancer stage ( and Supplementary Figure S9B). In contrast, a c.v. = 50% was assumed to represent the case in which most patients were included ( and Supplementary Figure S9C).
Figure 10. Obtained TCP values for 104 simulated patients (each point in the plots corresponds to a patient) after four HT sessions with 30 min of time interval achieving a temperature randomly selected for each HT session (considering direct HT cell killing). A case without inter-patient heterogeneity (left column) and with inter-patient heterogeneity with a c.v. of 5% (middle column) and 50% (right column) are shown. The SiHa cell line model parameters were considered for this analysis.

The correlation obtained without heterogeneity ( and Supplementary Figure S9A) worsened when a small inter-patient heterogeneity was considered ( and Supplementary Figure S9B) and disappeared when the heterogeneity was further increased ( and Supplementary Figure S9C). In the last case ( and Supplementary Figure S9C), the TCP values are too spread and no tendencies can be observed because the TCP calculation is quite sensitive to variations of . Hence, if the same RT schedule is performed for all the simulated patients, many will have TCP values of approximately 0 or 1. Thus, the TCP of a single simulated patient cannot be used to study the dependencies/correlations. However, the mean TCP value can be used as an alternative.
shows that the main difference between the two cell lines is that the HeLa cells have a significantly higher baseline mean TCP (RT only) when c.v.=50%. This is because the HeLa radiosensitivity (0.230 Gy−1) is close to the lower limit of the radiosensitivity range imposed in this manuscript (0.2–0.74 Gy−1) and, therefore, most of the selected radiosensitivities have higher values, increasing the mean TCP baseline.
Figure 11. Obtained TCP mean values for 106 simulated patients after four HT sessions with 30 min time intervals, achieving a temperature randomly selected from a uniform distribution between 39 and 43 °C for each HT session (considering direct HT cell killing). A case without inter-patient heterogeneity (left column) and with inter-patient heterogeneity with a c.v. of 5% (middle column) and 50% (right column) are shown. The SiHa (upper row) and HeLa (lower row) cell line model parameters were considered for this analysis.
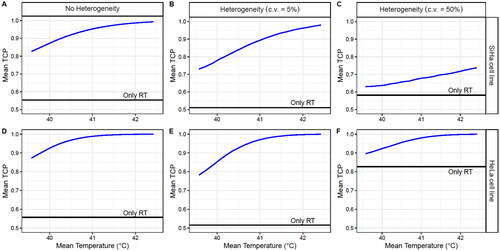
Nonetheless, a clear temperature dependence was observed for both cell lines. However, the improvement produced by HT decreases with inter-patient heterogeneity, which may result in an underestimation of the capacity of HT to improve RT treatments.
4. Discussion
This study demonstrated the utility of in-silico thermoradiobiological models in elucidating clinical findings, investigating the impact of variations in HT-related treatment conditions on treatment outcomes, and evaluating the efficacy of different HT + RT schedules. Furthermore, although the results obtained in this study pertain to the treatment of cervical cancer, the proposed methodology can be generalized to various tumor locations.
In terms of interpretation of clinical results, our findings demonstrate that the TCP dependence on temperature/time interval exhibit a stronger correlation with the mean value of all HT sessions than with the minimum/maximum value (Sections 3.2.1 and 3.2.2). Additionally, employing the mean temperature as a benchmark proves to be a valuable strategy for investigating the time interval effect (Section 3.2.3). This approach aligns with studies such as the one published by Kroesen et al. [Citation68], in which the authors examined the impact of time interval by comparing the mean time interval with the clinical outcomes. Nonetheless, it would be interesting to explore the relationship between treatment outcome dependence and mean temperature, and compare it with the correlations observed in this study. Therefore, in-silico models offer a novel perspective for comprehending clinical data, enabling not only the investigation of the importance of a specific biological process (e.g., the time interval effect) is important or not, but also to get an idea on how significant it might be.
Furthermore, several authors have underscored the significance of inter-patient heterogeneities in clinical outcomes [Citation69–71], a finding consistent with our results (Section 3.3). Consequently, the contribution of inter-patient heterogeneity should be meticulously considered when analyzing clinical data and comparing theoretical in-silico results with real patient data. Moreover, while intra-patient heterogeneities (i.e., differences within a patient) appear to have a lesser impact [Citation72–75], they should be considered alongside heterogeneities in radiation dose and temperature distributions (e.g., through voxel-based TCP calculation) to achieve greater precision in results. First, RT-related treatment conditions, such as dose-rate, dose per fraction, number of fractions, or impact of the brachytherapy boost, may influence final cell survival and should thus be carefully considered into calculations. However, precise monitoring of temperature distribution within the tumor is challenging, complicating the feasibility of conducting voxel-based TCP calculations accurately. Therefore, caution should be exercised when applying this approach to clinical data.
Regarding the impact of variations in HT treatment conditions, our findings indicate that single HT sessions usually do not exert a significant impact on treatment outcomes. A HT session with poor heating can be compensated by subsequent sessions, while a HT session achieving high temperatures only enhances the treatment outcomes if the remaining sessions are reasonably good. Additionally, we observed a discernible improvement in treatment outcomes with total CEM43 thermal doses of approximately 10 min. Furthermore, for a given thermal dose, the TCP increased with the total number of HT sessions (Section 3.2.4). These findings align with those by Ohguri et al. [Citation76], who demonstrated that CEM43 values higher than 1 min significantly increased the complete response rates in cervical cancer patients. Similarly, Franckena et al. [Citation77] showed that a high median CEM43 level was associated with tumor control and improved survival in a large retrospective data analysis of cervical cancer patients.
Concerning the evaluation of HT + RT schedules, the most effective treatment corresponds to the shortest time interval and highest temperature. However, patient characteristics strongly influence the achieved temperature and may be constrained by the presence of hotspots (i.e., high-temperature regions), which may lead to normal tissue toxicities [Citation78–81] as well as patient discomfort or pain [Citation82, Citation83]. To address these concerns, additional HT sessions may be incorporated into the schedule to compensate for the lower temperatures, thereby enhancing patient comfort. However, variations in RT doses/schedules for different cancer types directly impact the HT schedule (e.g., a three/six-week RT schedule implies treating twice/once per week with HT to deliver a total of six sessions). Furthermore, thermotolerance, characterized by the temporary heat resistance of cells following a prior HT session, imposes limitations on the maximum number of HT sessions that can be administered to a patient within a given week [Citation84–86]. Consequently, the feasibility of adding new HT sessions to a predefined HT + RT schedule warrants careful consideration.
In addition to the omission of the thermotolerance effect, one of the limitations of our calculations was the incapability to discern chronological differences in the treatment schedule. Furthermore, our calculations solely accounted for the effect of the HT therapeutic window (steady state) and assumed a constant heating duration of one hour. However, actual patient scenarios exhibit diverse temperature profiles, with some patients failing to reach a steady state, and the pre-heating part of the HT session may significantly contribute to HT-induced biological effects. In this regard, the integration of a dynamical model that considers the evolution of biological processes would be advantageous in addressing these aspects. Additionally, HT elicits a myriad of biological effects, including perfusion or immune reactions, which were not considered in our study. These additional factors may mask the results presented here. Thus, conducting an analysis of clinical patient data becomes essential to study the importance of such processes on the outcomes of HT + RT treatments under varying conditions and to validate the in-silico thermoradiobiological models. This validation represents a necessary step for the future development of biological treatment planning systems capable of identifying the ideal HT + RT treatment for each patient.
Finally, the variations in HT treatment conditions assumed in the presented results were modeled using uniform probability distributions. However, actual probability distributions may differ, potentially affecting the final results. Therefore, two Gaussian distributions were defined for temperature (µ = 40.46 °C and σ = 0.68 °C) and time interval (µ = 61 min and σ = 45 min) based on data reported in the reviews of Carrapiço-Seabra et al. [Citation57] and Ademaj et al. [Citation58] from diverse cancer types treated with deep HT. Repeating the calculations with these probability distributions resulted in a slight reduction (<10%) in the TCP ranges (i.e., the difference between the maximum and minimum TCP) due to the less extreme treatment conditions. Thus, while probability distributions appear to have an impact on the results, uniform distributions may serve as a reasonable approximation when actual probability distributions are unknown, as they produce similar results and cover a broader range of scenarios.
In conclusion, this study demonstrates how in-silico thermoradiobiological models can be used to theoretically analyze the impact of varying thermal conditions on the HT + RT treatment outcomes. Furthermore, biophysical models can help comprehend the importance of diverse biological processes, design new clinical trials, and eventually optimize HT + RT treatments.
Supplemental Material
Download MS Word (28.4 MB)Disclosure statement
No potential conflict of interest was reported by the author(s).
Data availability statement
The methods described in this manuscript were implemented in Python (version 3.9.7), and plots were created using R (version 4.1.3). All the codes used for simulating and plotting the presented results are available in the GitHub repository at https://github.com/mingzhaw/TCP_paper.git
Additional information
Funding
References
- Franckena M, Stalpers LJA, Koper PCM, et al. Long-term improvement in treatment outcome after radiotherapy and hyperthermia in locoregionally advanced cervix cancer: an update of the dutch deep hyperthermia trial. Int J Radiat Oncol Biol Phys. 2008;70(4):1–14. doi: 10.1016/j.ijrobp.2007.07.2348.
- Van Der Zee J, González DG, Rhoon GCV, et al. Comparison of radiotherapy alone with radiotherapy plus hyperthermia in locally advanced pelvic tumors. Lancet. 2000;355(9210):1119–1125. doi: 10.1016/s0140-6736(00)02059-6.
- Overgaard J, Gonzalez DG, Hulshof MCCM, et al. Randomised trial of hyperthermia as adjuvant to radiotherapy for recurrent or metastatic malignant melanoma. Lancet. 1995;345(8949):540–543. doi: 10.1016/s0140-6736(95)90463-8.
- Vernon C, Hand J, Field S, et al. Radiotherapy with or without hyperthermia in the treatment of superficial localized breast cancer: results from five randomized controlled trials international collaborative hyperthermia group: UK medical research council: european society for hyperthermi. Int J Radiat Oncol Biol Phys. 1996;35:73–744.
- Datta NR, Bose AK, Kapoor HK, et al. Head and neck cancers: results of thermoradiotherapy versus radiotherapy. Int J Hyperthermia. 1990;6(3):479–486. doi: 10.3109/02656739009140944.
- Chi MS, Yang KL, Chang YC, et al. Comparing the effectiveness of combined external beam radiation and hyperthermia Versus external beam radiation alone in treating patients with painful bony metastases: a phase 3 prospective, randomized, controlled trial. Int J Radiat Oncol Biol Phys. 2018;100(1):78–87. doi: 10.1016/j.ijrobp.2017.09.030.
- Valdagni R, Amichetti M. Report of long-term follow-up in a randomized trial comparing radiation therapy and radiation therapy plus hyperthermia to metastatic lymphnodes in stage IV head and neck patients. Int J Radiat Oncol Biol Phys. 1994;28(1):163–169. doi: 10.1016/0360-3016(94)90154-6.
- Kampinga HH, Dynlacht JR, Dikomey E. Mechanism of radiosensitization by hyperthermia (≥43 °C) as derived from studies with DNA repair defective mutant cell lines. Int J Hyperthermia. 2004;20(2):131–139. doi: 10.1080/02656730310001627713.
- Krawczyk PM, Eppink B, Essers J, et al. Mild hyperthermia inhibits homologous recombination, induces BRCA2 degradation, and sensitizes cancer cells to poly (ADP-ribose) polymerase-1 inhibition. Proc Natl Acad Sci U S A. 2011;108(24):9851–9856. doi: 10.1073/pnas.1101053108.
- Horsman MR, Overgaard J. Hyperthermia: a potent enhancer of radiotherapy. Clin Oncol. 2007;19(6):418–426. doi: 10.1016/j.clon.2007.03.015.
- Overgaard J. The heat is (still) on – The past and future of hyperthermic radiation oncology. Radiother Oncol. 2013;109(2):185–187. doi: 10.1016/j.radonc.2013.11.004.
- Suit HD, Gerweck LE. Potentialfor hyperthermiaand radiationtherapy. Cancer Res. 1979;39:2290–2298.
- Nielsen OS. Effect of fractionated hyperthermia on hypoxic cells in vitro. Int J Radiat Biol. 1981;39:73–82.
- Sun X, Xing L, Clifton Ling C, et al. The effect of mild temperature hyperthermia on tumour hypoxia and blood perfusion: relevance for radiotherapy, vascular targeting and imaging. Int J Hyperthermia. 2010;26(3):224–231. doi: 10.3109/02656730903479855.
- Song CW, Park H, Griffin RJ. Improvement of tumor oxygenation by mild hyperthermia. Radiat Res. 2001;155(4):515–528
- Song CW, Shakil A, Osborn JL, et al. Tumour oxygenation is increased by hyperthermia at mild temperatures. Int J Hyperthermia. 1996;12(3):367–373. https://www.tandfonline.com/doi/abs/10<?sch-permit JATS-0034-007?>.3109/02656739609022525.
- Bergs JWJ, Krawczyk PM, Borovski T, et al. Inhibition of homologous recombination by hyperthermia shunts early double strand break repair to non-homologous end-joining. DNA Repair. 2013;12(1):38–45. doi: 10.1016/j.dnarep.2012.10.008.
- Iliakis G, Wu W, Wang M. DNA double strand break repair inhibition as a cause of heat radiosensitization: re-evaluation considering backup pathways of NHEJ. Int J Hyperthermia. 2008;24(1):17–29. doi: 10.1080/02656730701784782.
- Hildebrandt B, Wust P, Ahlers O, et al. The cellular and molecular basis of hyperthermia. Crit Rev Oncol Hematol. 2002;43(1):33–56. doi: 10.1016/s1040-8428(01)00179-2.
- Dewey WC, Hopwood LE, Sapareto SA, et al. Cellular responses to combinations of hyperthermia and radiation. Radiology. 1977;123:463–474. https://pubs.rsna.org/doi/abs/10<?sch-permit JATS-0034-007?>.1148/123.2.463.
- Hall EJ, Roizin-Towle L. Biological effects of heat. Cancer Res. 1984;44(10 Suppl):4708s–4713s.
- Reinhold HS, Endrich B. Tumour microcirculation as a target for hyperthermia. Int J Hyperthermia. 1986;2(2):111–137. https://www.tandfonline.com/doi/abs/10<?sch-permit JATS-0034-007?>.3109/02656738609012389.
- Song CW. Effect of local hyperthermia on blood flow and microenvironment: a review. Cancer Res. 1984;44(10 Suppl):4721S–4730S.
- Winslow TB, Eranki A, Ullas S, et al. A pilot study of the effects of mild systemic heating on human head and neck tumour xenografts: analysis of tumour perfusion, interstitial fluid pressure, hypoxia and efficacy of radiation therapy. Int J Hyperthermia. 2015;31(6):693–701. doi: 10.3109/02656736.2015.1037800.
- Scheidegger S, Barba SM, Gaipl US. Theoretical evaluation of the impact of hyperthermia in combination with radiation therapy in an artificial immune—tumor-ecosystem. Cancers. 2021;13(22):5764. doi: 10.3390/cancers13225764.
- Marcu LG, Marcu D. In silico evaluation of radiobiological hypoxia and its effect on tumour control during radiotherapy. The 39th American Romanian Academy of Arts and Sciences Congress. 2015;124–127. doi: 10.14510/39ARA2015.3925.
- Marcu LG, Marcu D, Filip SM. In silico study of the impact of cancer stem cell dynamics and radiobiological hypoxia on tumour response to hyperfractionated radiotherapy. Cell Prolif. 2016;49(3):304–314. doi: 10.1111/cpr.12251.
- Marcu LG, Marcu D, Filip SM. In silico repopulation model of various tumour cells during treatment breaks in head and neck cancer radiotherapy. J Med Health Sci. 2015;9:153–156.
- Jenner AL, Cassidy T, Belaid K, et al. In silico trials predict that combination strategies for enhancing vesicular stomatitis oncolytic virus are determined by tumor aggressivity. J Immunother Cancer. 2021;9(2):e001387. doi: 10.1136/jitc-2020-001387.
- Kotecha RR, Hsu DJ, Lee CH, et al. In silico modeling of combination systemic therapy for advanced renal cell carcinoma. J Immunother Cancer. 2021;9(12):e004059. doi: 10.1136/jitc-2021-004059.
- Clermont G, Bartels J, Kumar R, et al. In silico design of clinical trials: a method coming of age. Crit Care Med. 2004;32(10):2061–2070. doi: 10.1097/01.ccm.0000142394.28791.c3.
- Forster JC, Marcu LG, Bezak E. Approaches to combat hypoxia in cancer therapy and the potential for in silico models in their evaluation. Phys Med. 2019;64:145–156. doi: 10.1016/j.ejmp.2019.07.006.
- Bekisz S, Geris L. Cancer modeling: from mechanistic to data-driven approaches, and from fundamental insights to clinical applications. J Comput Sci. 2020;46:101198. doi: 10.1016/j.jocs.2020.101198.
- Gong J, Dos Santos MM, Finlay C, et al. Are more complicated tumour control probability models better? Math Med Biol. 2013;30(1):1–19. doi: 10.1093/imammb/dqr023.
- Marrero CS, Acosta O, Castro M, et al. Sensitivity analysis of an in silico model of tumor growth and radiation response. Proc Int Symp Biomed Imaging. 2019;2019:1497–1500.
- Kiparissides A, Georgakis C, Mantalaris A, et al. Design of in silico experiments as a tool for nonlinear sensitivity analysis of knowledge-driven models. Ind Eng Chem Res. 2014;53(18):7517–7525. doi: 10.1021/ie4032154.
- Georgiadi EC, Dionysiou DD, Graf N, et al. Towards in silico oncology: adapting a four dimensional nephroblastoma treatment model to a clinical trial case based on multi-method sensitivity analysis. Comput Biol Med. 2012;42(11):1064–1078. doi: 10.1016/j.compbiomed.2012.08.008.
- Scheidegger S, Fuchs HU, Zaugg K, et al. Using state variables to model the response of tumour cells to radiation and heat: a novel multi-hit-repair approach. Comput Math Methods Med. 2013;2013:587543–587515. doi: 10.1155/2013/587543.
- De Mendoza AM, Michlíková S, Berger J, et al. Mathematical model for the thermal enhancement of radiation response: thermodynamic approach. Sci Rep. 2021;11(1):5503. doi: 10.1038/s41598-021-84620-z.
- Pearce JA. Comparative analysis of mathematical models of cell death and thermal damage processes. Int J Hyperthermia. 2013;29(4):262–280. doi: 10.3109/02656736.2013.786140.
- Scheff JD, Stallings JD, Reifman J, et al. Mathematical modeling of the heat-Shock response in HeLa cells. Biophys J. 2015;109(2):182–193. doi: 10.1016/j.bpj.2015.06.027.
- Brüningk SC, Ijaz J, Rivens I, et al. A comprehensive model for heat-induced radio-sensitisation. Int J Hyperthermia. 2018;34(4):392–402. doi: 10.1080/02656736.2017.1341059.
- Brüningk S, Powathil G, Ziegenhein P, et al. Combining radiation with hyperthermia: a multiscale model informed by in vitro experiments. J R Soc Interface. 2018;15(138):20170681. doi: 10.6084/m9.figshare.c.3970839.
- van Leeuwen CM, Oei AL, ten Cate R, et al. Measurement and analysis of the impact of time-interval, temperature and radiation dose on tumour cell survival and its application in thermoradiotherapy plan evaluation. Int J Hyperthermia. 2018;34(1):30–38. doi: 10.1080/02656736.2017.1320812.
- van Leeuwen CM, Crezee J, Oei AL, et al. 3D radiobiological evaluation of combined radiotherapy and hyperthermia treatments. Int J Hyperthermia. 2017;33(2):160–169. doi: 10.1080/02656736.2016.1241431.
- Crezee H, Van Leeuwen CM, Oei AL, et al. Thermoradiotherapy planning: integration in routine clinical practice. Int J Hyperthermia. 2016;32(1):41–49. doi: 10.3109/02656736.2015.1110757.
- Crezee J, van Leeuwen CM, Oei AL, et al. Biological modelling of the radiation dose escalation effect of regional hyperthermia in cervical cancer. Radiat Oncol. 2016;11(1):14. doi: 10.1186/s13014-016-0592-z.
- Kok HP, Crezee J, Franken NAP, et al. Quantifying the combined effect of radiation therapy and hyperthermia in terms of equivalent dose distributions. Int J Radiat Oncol Biol Phys. 2014;88(3):739–745. doi: 10.1016/j.ijrobp.2013.11.212.
- Kok HP, Herrera TD, Crezee J. The relevance of high temperatures and short time intervals Between radiation therapy and hyperthermia: insights in terms of predicted equivalent enhanced radiation dose. Int J Radiat Oncol Biol Phys. 2023;115(4):994–1003. doi: 10.1016/j.ijrobp.2022.10.023.
- Franken NAP, Rodermond HM, Stap J, et al. Clonogenic assay of cells in vitro. Nat Protoc. 2006;1(5):2315–2319. https://www.nature.com/articles/nprot.2006.339.
- Jones L, Hoban P, Metcalfe P. The use of the linear quadratic model in radiotherapy: a review. Australas Phys Eng Sci Med. 2001;24(3):132–146. doi: 10.1007/BF03178355.
- McMahon SJ. The linear quadratic model: usage, interpretation and challenges. Phys Med Biol. 2019;64(1):01TR01. doi: 10.1088/1361-6560/aaf26a.
- Li GC, Kal HB. Effect of hyperthermia on the radiation response of two mammalian cell lines. Eur J Cancer. 1977;13(1):65–69. doi: 10.1016/0014-2964(77)90231-6.
- Overgaard J. Simultaneous and sequential hyperthermia and radiation treatment of an experimental tumor and its surrounding normal tissue in vivo. Int J Radiat Oncol Biol Phys. 1980;6(11):1507–1517. doi: 10.1016/0360-3016(80)90008-5.
- Sapareto SA, Hopwood LE, Dewey WC. Combined effects of X irradiation and hyperthermia on CHO cells for various temperatures and orders of application. Radiat Res. 1978;73(2):221–233. doi: 10.2307/3574816.
- German Guideline Program in Oncology. German Guideline Program in Oncology (German Cancer Society, German Cancer Aid, AWMF): Diagnosis, Treatment, and Follow-Up in Patients with Cervical Carcinoma Long version 2.2, 2022, AWMF Registration Number: 032/033OL, 2022. https://www.leitlinienpro- gramm-on.
- Carrapiço-Seabra C, Curto S, Franckena M, et al. Avoiding pitfalls in thermal dose effect relationship studies: a review and guide forward. Cancers. 2022;14:4795. https://www.mdpi.com/2072-6694/14/19/4795/htm.
- Ademaj A, Veltsista DP, Ghadjar P, et al. Clinical evidence for thermometric parameters to guide hyperthermia treatment. Cancers. 2022;14(3):625. https://www.mdpi.com/2072-6694/14/3/625/htm. doi: 10.3390/cancers14030625.
- Dubray BM, Thames HD. The clinical significance of ratios of radiobiological parameters. Int J Radiat Oncol Biol Phys. 1996;35(5):1099–1111. doi: 10.1016/0360-3016(96)00255-6.
- Moiseenko V, Duzenli C, Durand RE. In vitro study of cell survival following dynamic MLC intensity-modulated radiation therapy dose delivery. Med Phys. 2007;34(4):1514–1520. doi: 10.1118/1.2712044.
- Bedford JS, Hall EJ. Survival of hela cells cultured in vitro and exposed to protracted gamma-irradiation. Int J Radiat Biol. 1963;7:377–383.
- Steel GG, Down JD, Peacock JH, et al. Dose-rate effects and the repair of radiation damage. Radiother Oncol. 1986;5(4):321–331. doi: 10.1016/s0167-8140(86)80181-5.
- Steel GG, Deacon JM, Duchesne GM, et al. The dose-rate effect in human tumour cells. Radiother Oncol. 1987;9(4):299–310. doi: 10.1016/s0167-8140(87)80151-2.
- Hall EJ, Bedford JS. Dose rate: its effect on the survival of hela cells irradiated With gamma rays. Radiat Res. 1964;22(2):305–315. doi: 10.2307/3571661.
- Roberts SA, Hendry JH, Swindell R, et al. Compensation for changes in dose-rate in radical low-dose-rate brachytherapy: a radiobiological analysis of a randomised clinical trial. Radiother Oncol. 2004;70(1):63–74. doi: 10.1016/j.radonc.2003.11.010.
- Kelland LR, Steel GG. Differences in radiation response among human cervix carcinoma cell lines. Radiother Oncol. 1988;13(3):225–232. doi: 10.1016/0167-8140(88)90059-x.
- Brenner DJ, Hall EJ. Conditions for the equivalence of continuous to pulsed low dose rate brachytherapy. Int J Radiat Oncol Biol Phys. 1991;20(1):181–190. doi: 10.1016/0360-3016(91)90158-z.
- Kroesen M, Mulder HT, van Holthe JML, et al. The effect of the time interval Between radiation and hyperthermia on clinical outcome in 400 locally advanced cervical carcinoma patients. Front Oncol. 2019;9:134. https://www.frontiersin.org/article/10<?sch-permit JATS-0034-007?>.3389/fonc.2019.00134/full.
- Dutreix J, Tubiana M, Dutreix A. An approach to the interpretation of clinical data on the tumour control probability-dose relationship. Radiother Oncol. 1988;11(3):239–248. doi: 10.1016/0167-8140(88)90006-0.
- Zagars GK, Schultheiss TE, Peters LJ. Inter-tumor heterogeneity and radiation dose-control curves. Radiother Oncol. 1987;8(4):353–361. doi: 10.1016/s0167-8140(87)80186-x.
- Bentzen SM, Thames HD, Overgaard J. Does variation in the in vitro cellular radiosensitivity explain the shallow clinical dose – control curve for malignant melanoma? Int J Radiat Biol. 1990;57(1):117–126. doi: 10.1080/09553009014550391.
- Haustermans K, Vanuytsel L, Geboes K, et al. In vivo cell kinetic measurements in human oesophageal cancer: what can be learned from multiple biopsies? Eur J Cancer. 1994;30A(12):1787–1791. doi: 10.1016/0959-8049(94)00252-z.
- Davidson SE, West CML, Roberts SA, et al. Radiosensitivity testing of primary cervical carcinoma: evaluation of intra- and inter-tumour heterogeneity. Radiother Oncol. 1990;18(4):349–356. doi: 10.1016/0167-8140(90)90115-d.
- Brock WA, Baker FL, Wike JL, et al. Cellular radiosensitivity of primary head and neck squamous cell carcinomas and local tumor control. Int J Radiat Oncol Biol Phys. 1990;18(6):1283–1286. doi: 10.1016/0360-3016(90)90298-x.
- Roberts SA, Hendry JH. 10 Inter-tumour heterogeneity and tumour control. In: Radiobiological modelling in radiation oncology. The British Institute of Radiology; 2007. p. 169–195. https://www.birpublications.org/doi/10<?sch-permit JATS-0034-007?>.1259/9780905749839.chapter10.
- Ohguri T, Harima Y, Imada H, et al. Relationships between thermal dose parameters and the efficacy of definitive chemoradiotherapy plus regional hyperthermia in the treatment of locally advanced cervical cancer: data from a multicentre randomised clinical trial. Int J Hyperthermia. 2018;34(4):461–468. doi: 10.1080/02656736.2017.1352105.
- Franckena M, Fatehi D, Bruijne M D, et al. Hyperthermia dose-effect relationship in 420 patients with cervical cancer treated with combined radiotherapy and hyperthermia. Eur J Cancer. 2009;45(11):1969–1978. doi: 10.1016/j.ejca.2009.03.009.
- Bakker A, van der Zee J, van Tienhoven G, et al. Temperature and thermal dose during radiotherapy and hyperthermia for recurrent breast cancer are related to clinical outcome and thermal toxicity: a systematic review. Int J Hyperthermia. 2019;36(1):1024–1039. doi: 10.1080/02656736.2019.1665718.
- Hurwitz MD, Kaplan ID, Hansen JL, et al. Association of rectal toxicity with thermal dose parameters in treatment of locally advanced prostate cancer with radiation and hyperthermia. Int J Radiat Oncol Biol Phys. 2002;53(4):913–918. doi: 10.1016/s0360-3016(02)02809-2.
- Bakker A, Kolff MW, Holman R, et al. Thermal skin damage during reirradiation and hyperthermia is time-temperature dependent. Int J Radiat Oncol Biol Phys. 2017;98(2):392–399. doi: 10.1016/j.ijrobp.2017.02.009.
- Seegenschmiedt MH, Sauer R, Miyamoto C, et al. Clinical experience with interstitial thermoradiotherapy for localized implantable pelvic tumors. Am J Clin Oncol. 1993;16(3):210–222. doi: 10.1097/00000421-199306000-00005.
- Kok HP, Korshuize- van Straten L, Bakker A, et al. Online adaptive hyperthermia treatment planning during locoregional heating to suppress treatment-limiting hot spots. Int J Radiat Oncol Biol Phys. 2017;99(4):1039–1047. doi: 10.1016/j.ijrobp.2017.07.011.
- Canters R, Franckena M, Van Der Zee J, et al. Optimizing deep hyperthermia treatments: are locations of patient pain complaints correlated with modelled SAR peak locations? Phys Med Biol. 2011;56(2):439–451. doi: 10.1088/0031-9155/56/2/010.
- Overgaard J, Nielsen OS. The importance of thermotolerance for the clinical treatment with hyperthermia. Radiother Oncol. 1983;1(2):167–178. doi: 10.1016/s0167-8140(83)80019-x.
- Li GC, Mivechi NF, Weitzel G. Heat shock proteins, thermotolerance, and their relevance to clinical hyperthermia. Int J Hyperthermia. 1995;11(4):459–488. doi: 10.3109/02656739509022483.
- Urano M. Kinetics of thermotolerance in normal and tumor tissues: a review. Cancer Res. 1986;46(2):474–482.