
 ?Mathematical formulae have been encoded as MathML and are displayed in this HTML version using MathJax in order to improve their display. Uncheck the box to turn MathJax off. This feature requires Javascript. Click on a formula to zoom.
Abstract
Purpose
To use computational modeling to provide a complete and logical description of the electrical and thermal behavior during stereoelectroencephalography-guided (SEEG) radiofrequency thermocoagulation (RF-TC).
Methods
A coupled electrical-thermal model was used to obtain the temperature distributions in the tissue during RF-TC. The computer model was first validated by an ex vivo model based on liver fragments and later used to study the impact of three different factors on the coagulation zone size: 1) the difference in the tissue surrounding the electrode (gray/white matter), 2) the presence of a peri-electrode gap occupied by cerebrospinal fluid (CSF), and 3) the energy setting used (power-duration).
Results
The model built for the experimental validation was able to predict both the evolution of impedance and the short diameter of the coagulation zone (error < 0.01 mm) reasonably well but overestimated the long diameter by 2 − 3 mm. After adapting the model to clinical conditions, the simulation showed that: 1) Impedance roll-off limited the coagulation size but involved overheating (around 100 °C); 2) The type of tissue around the contacts (gray vs. white matter) had a moderate impact on the coagulation size (maximum difference 0.84 mm), and 3) the peri-electrode gap considerably altered the temperature distributions, avoided overheating, although the diameter of the coagulation zone was not very different from the no-gap case (<0.2 mm).
Conclusions
This study showed that computer modeling, especially subject- and scenario-specific modeling, can be used to estimate in advance the electrical and thermal performance of the RF-TC in brain tissue.
1. Introduction
Epilepsy is a neurological pathology characterized by recurrent seizures resulting from abnormal electrical activity in groups of neuronal populations. To keep seizures under control, the most common treatment consists of administering drugs, although 30% of these patients do not respond to pharmacological treatment. In 50% of these refractory cases, tissue resection is the best option [Citation1]. As the epileptogenic zone (EZ) must be correctly identified for cortical resection to be effective [Citation2], it is important to correctly determine its position, for which brain-mapping procedures are used. Recording brain activity by intracranial electroencephalography (iEEG) is the preferred method for identifying the location and extent of the EZ, as it registers electrical signals directly from the cortical surface or over deep brain regions.
Stereoelectroencephalography (SEEG) is a minimally invasive mapping technique used to localize the EZ in the brain by inserting very thin electrodes (< 1.3 mm diameter) into the deep regions. Once the electrodes have located the suspected EZ area, radiofrequency (RF) power can be applied between them to destroy this area by thermal necrosis. This technique is known as SEEG-guided RF thermocoagulation (SEEG-guided RF-TC) [Citation2] and is essentially a bipolar RF ablation technique performed by applying constant power (values around 5 W) for 10 − 40 s [Citation3]. In a clinical study on a large population with a 10-year follow-up period [Citation4], SEEG-guided RF-CT was shown to be a safe and efficient technique. More than two thirds of the patients showed a short-term improvement and almost half responded to the 1-year follow-up. The technique appears to be especially interesting for limited EZ inaccessible to surgery when epilepsy is related to a large unilateral network (disruption by multiple RF-TC). The SEEG-guided RF-TC effect seems to be an outcome predictor after conventional cortectomy in patients eligible for surgery. Another study shows that SEEG-guided RF-TC in the EZ may be a treatment option for particularly complex drug-resistant focal epilepsy requiring an invasive evaluation [Citation5]. A small subset of patients who achieve freedom from seizures or a worthwhile improvement may thus avoid open surgery or undergo an alternative treatment if resection is not an option, especially for those with epileptogenic nodular heterotopy. We consider that planning SEEG-guided RF-TC by computational models and the electromagnetic forward problem optimization would improve effectiveness and safety and increase the percentage of seizure-free patients, even for larger EZs than in nodular heterotopy. In this regard, a recent study proposed specific software-based tools to increase modeling speed and resolution when implanting SEEG electrodes, thus reducing the electrode-implantation planning time and raising the clinical efficiency [Citation6].
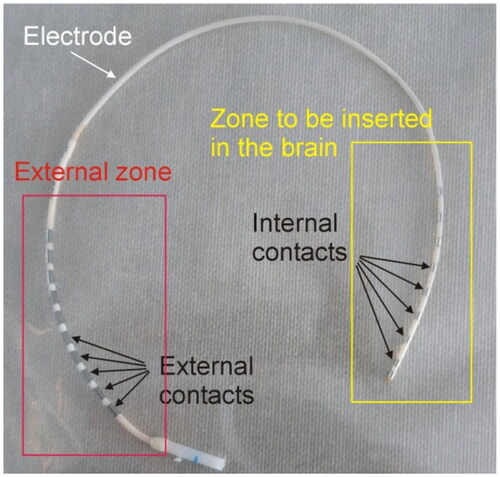
Although it is not common in the field of RF ablation, in the context of SEEG-guided RF-TC each of the metal electrodes is called a contact, and the applicator with the contacts is called an electrode (see ). Each internal contact (i.e. inside the brain) is electrically connected to an external contact through very thin wires (<0.1 mm diameter) with non-insignificant resistance (>100 Ω). In fact, we measured values of up to 190 Ω (both at DC and 500 kHz) in different electrode models manufactured by Ad-Tech Medical Instrument Corporation (Oak Creek, WI, USA). Applying RF power between the contacts in the brain raises the temperature in the target tissue and creates an elliptical coagulation volume. Although the possibility of increasing the size of the coagulation zone by applying RF between separate electrode contacts has been studied [Citation7], power is usually applied between two adjacent contacts in the same electrode [Citation8].
Figure 1. Example of SEEG electrode consisting of metal contacts joined in pairs. The internal contacts are inserted in the brain, while the external contacts are accessible for mapping, stimulation or applying RF power.
Different power-duration protocols can be used; while some clinical groups use fixed parameters, e.g., 5 W for 10 − 30 s, others propose progressively increasing the power until the current drops spontaneously [Citation9], which is associated with a drastic increase in impedance (roll-off). It has been suggested that this technique avoids unintentionally creating excessively large coagulation zones and that it limits tissue temperature to values between 78 and 82 °C [Citation9]. However, our previous experience of RF ablation rather suggests that the roll-off occurs when a zone of completely desiccated tissue surrounds one of the contacts, interrupting the passage of RF current and is associated with tissue temperatures close to 100 °C [Citation10]. This is corroborated by the fact that during the intervention the patient or neurosurgeon can ‘hear the coagulation’ before the coagulation zone reaches its maximum size [Citation9]. However, what is actually heard is an audible ‘pop’ due to the creation of steam within the tissue. Few studies have been published to date on RF-TC bench tests using SEEG electrodes (see e.g., [4,8 − 10]), while no computational model has been proposed to describe this technique.
Our objective was thus to use computational modeling to provide a full and clear description of the electrical and thermal behavior during SEEG-guided RF-TC. The computer model was first validated by an ex vivo model, and later used to assess the impact of three different factors on the coagulation zone size: 1) the presence of different neural tissue types around the contacts (gray/white matter), 2) the presence of a peri-electrode gap, and 3) the energy setting used (power-duration).
2. Materials and methods
The first step was to conduct RF-TC bench experiments on an ex vivo porcine liver model to obtain the data to validate the computational model. Ex vivo liver is widely used in this type of study for its ease of handling and the ability to identify the geometry of the coagulation zone with a characteristic whitish area [Citation11,Citation12]. The second step was to build a computational model adapted to the experimental conditions to compare the experimental and computational results. The model was then adapted to the physiological conditions found in SEEG-guided RF-TC, and to study the impact of the different relevant factors.
2.1. Ex vivo model
We used the SD10R-SP05X-000 electrode model (Ad-Tech Medical Instrument Corporation, Oak Creek, WI, USA) with a 1.12 mm outer diameter and 2.41 mm long platinum contacts separated by 2.59 mm (between their adjacent ends). Note that although this electrode model is not clinically approved for RF-TC, but rather for monitoring/mapping subsurface levels of the brain during the surgical treatment of epilepsy, it was suitable for our study since its dimensions are similar to those of other electrodes typically used for RF-TC.
Porcine liver fragments were obtained from a local slaughterhouse and kept in a refrigerator until used within 24 h of slaughter. The fragments were placed on an electric mat to keep them around 34 °C during the experiments. shows an overview of the experimental setup. RF power was applied in constant power mode from a model CC-1 generator Cosman Coagulator System (Radionics, Burlington, MA, USA). Power was set to 5 W for 20 s, or until roll-off (i.e. abrupt rise in impedance and subsequent current cessation), whichever occurred first. Due to the inaccuracy of the RF generator’s own timer, the actual duration of the ablations was 21.4 s. Prior to each RF-TC, the electrode was positioned between two liver fragments (sandwich-like), preventing the contacts being RF energized for being close to blood vessels and fatty zones. Both fragments (surrounding the electrode) were thick enough to prevent coagulation from reaching the surface (> 2 cm).
Figure 2. (A) Overview of the experimental setup used in the ex vivo experiments. (B) Detail of the microthermocouple attached to the electrode surface to assess self-heating caused by the resistance of the internal wires connecting the external and internal contacts.
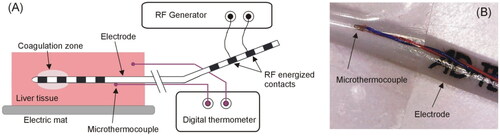
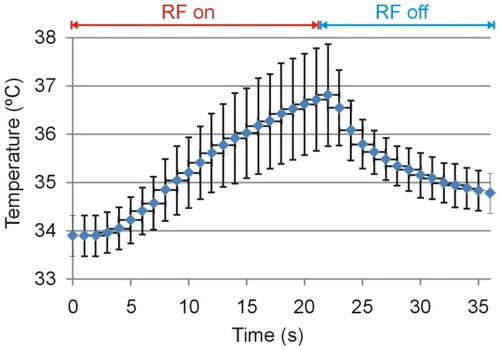
Due to the non-negligible electrical resistance associated with the wires connecting the external and internal contacts, it was reasonable to suspect that the RF current could cause self-heating of the electrode itself. In order to assess the possible increase in temperature in the electrode segment between the external and internal contacts, we therefore used a T-type micro thermocouple IT-23 model (Physitemp Instruments, Clifton, NJ, USA) with a 76 µm outer diameter and 5 ms constant time, which was attached to the electrode surface ∼2 cm from the proximal contact to be energized (see ), i.e. far enough from the coagulation zone to capture only the self-heating due to the Joule effect of the internal wires. An additional T-type thermocouple was placed ∼4 cm away from the electrode to monitor the basal temperature of the tissue fragments. Both thermocouples were connected to a Fluke 52 II (Fluke, Everett, WA, USA). The temperature was monitored by a camera synchronized with a clock to obtain the data available in digital format. The thermocouples used are accurate to ±0.1 °C (in the physiological range), while the Fluke 52 II thermometer is accurate to ± (0.05% + 0.3 °C), i.e. around ±0.32°at a maximum temperature of 38 °C (see ).
We conducted 10 ablations on different liver fragments and recorded the progress of the electrical variables (power, impedance, voltage and current), which were sampled at 1.2 kS/s and digitalized with 12-bit resolution using a USB data acquisition device USB-1208LS (Digilent, Pullman, WA USA) connected to a laptop. After each coagulation, the tissue fragments were carefully separated to photograph the heated samples and identify the coagulation zone by the whitish border. Since these areas were ellipsoidal in shape, their geometry was quantified by the largest (long) and smallest (short) diameters, considered as the length and diameter of the coagulation zone, respectively.
2.2. Computer model for experimental validation
We then built a two-dimensional model adapted to the conditions of the ex vivo experiments, considering a pair of contiguous contacts (2.41 mm long separated by 2.59 mm, and 50 µm thick) surrounded by homogeneous liver tissue (). The initial temperature was at 34 °C. The outer dimensions, time step and mesh size were verified by a sensitivity analysis. A denser mesh, a shorter time-step and an increase in the external dimensions of the simulation domain registered a variation of less than 0.1 mm in the short diameter of the coagulation zone.
Figure 3. Computer model geometry including the distal section of the electrode and a pair of metal contacts (not to scale).
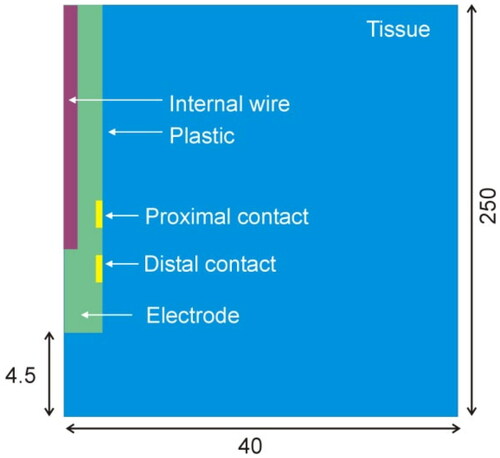
The electrode body is mainly composed of plastic and is surrounded by metal contacts, with the connection wires inside. These are extremely thin, which implies an electrical and thermal impact. From the thermal point of view, it is reasonable to assume that the internal wires could contribute to evacuating the heat induced in the coagulation zone, since the thermal conductivity of metal is much greater than that of plastic. Our model thus considered a central cylinder with an 84 µm diameter, mimicking the copper wires (red region in ). This diameter is that of a cable section equivalent to two cables with a diameter of 60 µm each (estimation taken from an electrode disassembled by us for this purpose).
From the electrical point of view, the electrical resistance of the internal wires (Rwire) has a double impact: 1) it can induce self-heating in the electrode due to the Joule effect, and 2) it means that only a part of the total power delivered by the RF generator will be effectively applied to the tissue. We measured the Rwire value between several contacts of the electrode model SD10R-SP05X-000 (Ad-Tech Medical Instrument Corporation, Oak Creek, WI, USA) and found values around 190 Ω, which is by no means negligible compared to the tissue resistance (Rtissue). This implies that the total impedance ZT measured by the RF generator during thermocoagulation is really the sum of the tissue resistance and that associated with the two wires connecting the two RF energized contacts, i.e. ZT = Rtissue + 2 × Rwire. This has a direct impact on the real power applied to the tissue (Ptissue), as a function of the power delivered by the RF generator (Pset), which can be formulated as:
(1)
(1)
The power effectively applied by the model to the tissue (Ptissue) was therefore reduced according to the relationship between Rtissue and 2·Rwire. We simulated a Pset(t) waveform based on the progress of the total power applied by the RF generator during the ex vivo experiments, i.e. a linear ramp during the first 10 s, followed by a period of 12.4 s in which power was more or less constant around 5 W (5.25 ± 0.02 W, see Supplementary Material). According to this explanation, Pset(t) was divided into two parts: Ptissue as in EquationEquation (1)(1)
(1) , and the remnant from the Joule heating of the internal wires (Pwire). Ptissue was applied to the tissue through both contacts as an electrical boundary condition based on modifying the current injected at each contact in each time-step to provide the tissue with the value of Ptissue according to EquationEquation (1)
(1)
(1) . On the other hand, the power dissipated in the internal wires (Pwire) was applied on the subdomain of the internal wire (see red zone in ).
The ANSYS Multiphysics software (ANSYS, Canonsburg, PA, USA) was used to solve the 2D axysimetric electro-thermal coupled problem by the Finite Element Method. Since the mathematical model is non-linear, we used the Newton-Raphson method to linearize the residual equation, configured with a maximum iteration of 400. We adopted a Crank–Nicolson scheme (with a theta value of 0.5) and a relative tolerance set at 0.2 for the transient integration. The adaptive time-step parameters were set at a minimum of 0.002 s, a maximum of 0.01 s and an initial time-step of 0.002 s.
Laplace’s equation was used to obtain the electric field distribution and current density, from which the power density deposited in the tissue (W/m3) was obtained. This value was coupled with the Bioheat Equation to calculate the temperature distribution in the tissue and electrode [Citation13]:
(2)
(2)
where ρ is density (kg/m3), c specific heat (J/kg·K), T temperature (°C), t time (s), k thermal conductivity (W/m·K), QRF the heat source caused by RF power (W/m3), Qp the heat loss caused by blood perfusion (W/m3) and Qmthe metabolic heat generation (W/m3). The last term is ignored as negligible compared to the rest of the terms [Citation13], while Qp was not considered in this first set of simulations aimed at mimicking ex vivo conditions.
To model tissue vaporization Equation (2) was written as a balance of enthalpy changes as described in [Citation14]:
(3)
(3)
where ht is the tissue enthalpy per unit volume. This value can be determined by assessing the amount of energy deposited in the tissue when raising temperature from 37 °C to values above 101 °C, as follows:
(4)
(4)
where Ht is the tissue vaporization latent heat, which was estimated as the product of the water vaporization latent heat (Hw) and the water mass fraction in the tissue (C). Hw was calculated as the product of the water vaporization latent heat (2256 kJ/kg) and water density (958 kg/m3), both assessed at 100 °C, given a value of 2.161 × 10⁹ J/m3. C was considered to be 71.46% for the experimental validation simulations, a typical liver value [Citation15]. The partial derivative of the enthalpy in EquationEquation (3)
(3)
(3) can therefore be expressed as:
(5)
(5)
The initial and outer boundary temperatures were set at the same temperature as in the experiments (34 °C). The electrical and thermal tissue properties were taken from [Citation16,Citation17] while the electrode properties (metal contacts and plastic parts) were taken from [Citation18,Citation19]. shows the characteristics of the materials used in all the models developed in this study. In the model used for experimental validation, the tissue was assumed to be liver. Electrical conductivity in the tissue was increased by +1.5%/°C up to 99 °C. Between 99 and 101 °C, the σ value was reduced by two orders of magnitude, and remained constant. Thermal conductivity was assumed to be constant.
Table 1. Thermal and electrical characteristics of the elements in the model.
The coagulation zone boundary was estimated using two isotherms just after RF application: 1) the 55 °C isotherm, since this value is considered to be the lethal threshold for tissues exposed to RF heating for several minutes [Citation20], and 2) the 60 °C isotherm, since it has also been proposed as a marker of heat-induced tissue change of color [Citation12].
2.3. Computer model to study clinical RF-TC
The computer model shown in was modified to the conditions found in the clinical practice of RF-TC. In this case, the blood perfusion term Qp was included in the Bioheat Equation and computed as follows:
(6)
(6)
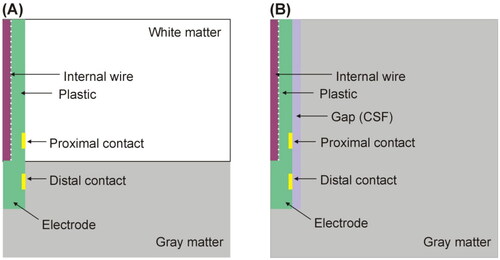
where ρb is blood density, cb blood specific heat, Tb body temperature (37 °C), and ω blood perfusion coefficient (at temperature Tb). It was set to zero once the temperature had reached 55 °C to model the necrosis-induced cessation. The initial and outer boundary temperatures were set at the standard body temperature (37 °C). The neural tissue was assumed to be either gray matter or white matter, since a pair of RF-energized contacts can be inserted in different tissue types. We considered that the gray/white matter interface located at different points between the contacts (see , which shows the specific case of the interface at mid-point). The model was also modified to include the peri-electrode gap between the electrode and neural tissue, since inserting the electrodes destroys the cortex in their immediate vicinity [Citation21]. This peri-electrode gap was assumed to be occupied by cerebrospinal fluid (CSF), as shown in . We considered a gap width ranging from 0.2 to 0.5 mm, as described in a previous computer modeling study on intracerebral EEG measurements [Citation21,Citation22]. The water contents (C) of brain and CSF were 73.33 and 93.33%, respectively [Citation15].
Figure 4. (A) Geometry of the computer model used to study coagulation zone changes when two RF-energized contacts are surrounded by different neural tissue (gray vs. white matter). (B) Geometry of the computer model used to study coagulation zone changes when a peri-electrode gap filled by cerebrospinal fluid (CSF) is considered around the electrode (out of scale). The outer dimensions were as shown in .
We lastly assessed how the energy setting (power-duration) could affect the temperature distributions and coagulation size, changing the applied power between 5 and 7 W, and extending the duration of the RF application up to 30 s or to roll-off (the point at which impedance reaches its initial value), whichever happens first. In total, a total of 33 simulations were performed considering these power values, variations in the type of tissue around the contacts, and the width of the peri-electrode gap. An Excel file is provided as Supplementary Material which includes all the cases along with the results of the simulations.
2.4. Statistics
The relationships between the considered variables (applied power, coagulation size, time to roll-off) were studied by simple regression. The coefficient of determination (R2) was reported to assess the goodness of fit. The Pearson correlation coefficient (R) was analyzed by the Student’s t-distribution with , where R2 is the coefficient of determination and n is the sample number. The P-value was computed under the null hypothesis of a non-linear correlation. Statistical significance was assumed when the P-value was lower than 0.05.
3. Results
3.1. Experimental results
shows the evolution of the applied power and electrical impedance during the ex vivo experiments. The RF generator took ∼10 s to reach the target value (5 W) and then stayed constant at 5.3 ± 0.2 W. The mean initial impedance was 945.5 ± 37.7 Ω. During the RF-induced heating, the impedance gradually decreased until reaching an approximately constant value of 727 ± 22 Ω. The Supplementary Material includes pictures of all the ablated samples, along with the raw data of the electrical and thermal variables recorded during the experiments. shows the temperature evolution recorded by the thermocouple on the electrode away from the coagulation zone, i.e. self-heating caused by the Joule effect of the internal wires.
Figure 5. Evolution of applied power (A) and electrical impedance (B) during ex vivo experiments. The results are shown as the mean value (blue symbol) ± standard deviation (black vertical bars).
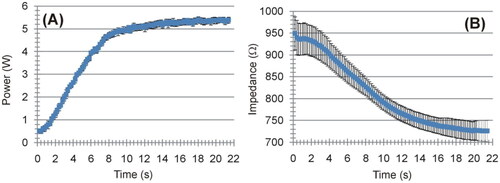
Figure 6. Evolution of the temperature measured on the plastic electrode surface, see ) at a point away from the coagulation zone.
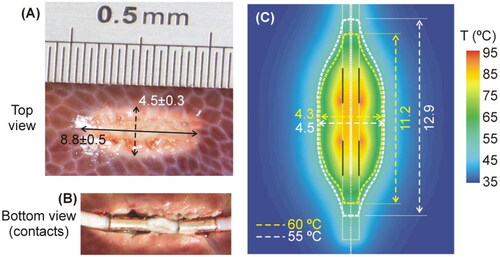
shows a typical coagulation zone created in the tissue. These zones had an ellipsoidal shape, with a length of 8.8 ± 0.5 mm and a diameter of 4.5 ± 0.3 mm. We felt moderate sticking when the electrode was separated from the tissue (see ). No audible pop occurred during the ablations.
Figure 7. (A,B) Typical coagulation zones created after RF-TC during ex vivo experiments. The dimensions (in mm) are the mean and standard deviation of the length and diameter. (C) Computer results: Temperature distributions after 21.4-s RF-TC (scale in °C). The coagulation boundary was assessed by the 55 °C and 60 °C isotherms. Vertical black solid lines represent the position of the metal contacts.
3.2. Computational results for experimental validation
To match the computational value of baseline impedance with the mean value measured in the experiments (950 ± 38 Ω), we chose an electrical conductivity for the tissue of 0.294 S/m, which is within the range of values reported for the liver at 500 kHz [Citation23]. We then simulated a power-controlled RF-TC with a protocol based on the mean values provided by the RF generator during the ex vivo experiments, i.e. a 10-s linear ramp up to 5 W and kept at this value for 11.4 s to mimic the same duration as that in the ex vivo experiments (21.4 s in total). shows the temperature distributions at the end of the RF power application. Using the 55 °C isotherm, the computer model predicted a length of 12.9 mm and a diameter of 4.5 mm for the coagulation zone, while the length and diameter using the 60 °C isotherm were 11.2 and 4.3 mm, respectively. Note that the length measurements were taken exhaustively from the position of each isotherm, i.e. including the elongation zones in the direction of the electrode. However, if we assume the coagulation zone to be ellipsoidal, these dimensions would probably be slightly smaller and closer to the experimental values.
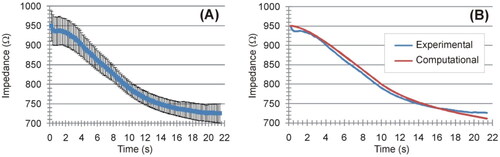
The maximum temperature was reached around the edge of the contacts (contact points between metal and plastic). shows the comparison between computational and experimental results in terms of impedance progress during ablation. We found good agreement between these, with a mean difference of 3.3 Ω and a deviation (15 Ω maximum value) in the last 2 s. The electrode self-heating implied a temperature of ∼40 °C along its entire surface. We also found a reasonable agreement in electrode self-heating between the ex-vivo experiments (around 3 °C, see ) and the computer simulations without a peri-electrode gap filled with CSF), which offered values around 4 °C (difference between the maximum temperature of ∼41 °C and 37 °C body temperature).
Figure 8. (A) Evolution of the electrical impedance during ex vivo experiments (mean and standard deviation) (B) Comparison between computer results (red line) and mean values of the experiments (blue line).
3.3. Computational results mimicking clinical RF-TC
The model built to mimic the conditions found in clinical practice (see ) had around 109,000 nodes and 52,000 elements. The model was verified in terms of mesh size and outer dimensions as follows: when the mesh size was reduced (430,000 nodes and 210,000 elements), the diameter of the coagulation zone changed by only 0.25%. When the external dimensions of the model were doubled, this diameter only changed by 0.22%. The Supplementary Material includes the raw data from the computer results. The results were analyzed by distinguishing the cases that did not include the peri-electrode gap (direct contact between electrode and neuronal tissue) from those considering the gap.
3.3.1. Scenario without peri-electrode gap
The mean value of the initial impedance was 1372 ± 20 Ω. We found that the initial impedance was higher when the electrode was completely surrounded by white matter than by gray matter (1692 vs. 1054 Ω). Intermediate values were found when the two contacts were surrounded by different types of matter. In the first few seconds the impedance dropped to a minimum value of 785 ± 13 Ω at 13.0 ± 2.1 s, after which it gradually rose, with a sharp rise just before reaching roll-off at 19.4 ± 3.7 s. The coagulation zone was 16.6 ± 0.4 mm long and 5.9 ± 0.3 mm in diameter, and the electrode self-heating (assessed on the plastic surface away from the contacts zone) implied an increase of 4.1 ± 0.3 °C.
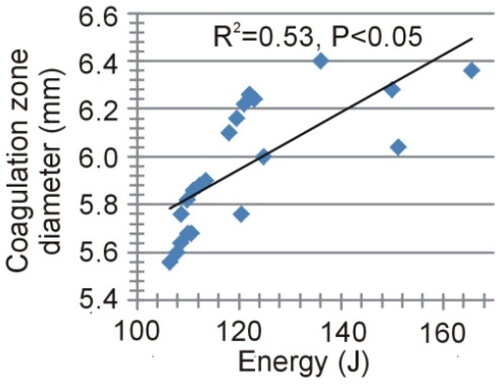
shows the impact of applied power on the coagulation zone size (maximum diameter and length) and time to roll-off. The results showed a strong negative correlation between the maximum diameter of the coagulation zone and the applied power (R2=0.69, p < 0.05), and a moderately negative correlation for the length (R2=0.36, p < 0.05). A strong negative correlation was also found with time to roll-off (R2=0.66, p < 0.05). In contrast, the total energy administered, calculated as the product of power and application time (time to roll-off), showed a moderately positive correlation with the diameter of the coagulation zone (R2=0.53, p < 0.05), as shown in , and also with the volume of the coagulation zone (not shown in ) estimated by the ellipsoid formula (R2=0.56, p < 0.05). Interestingly, the fit improved to R2=0.73 when regression was the second-order polynomial.
Figure 9. Relationships between applied power and coagulation zone size (maximum diameter and length) and time at impedance roll-off.
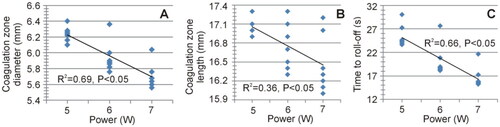
Figure 10. Relationships between the delivered total energy and the maximum diameter of the coagulation zone.
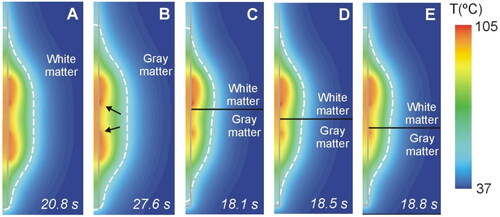
shows the temperature distributions at roll-off times for different cases according to the relative spatial position of the contacts and the different neural tissue (white and gray matter). We found that the fact of each contact being surrounded by gray or white matter had a moderate impact on the size and geometry of the coagulation zone (maximum difference 0.84 mm in coagulation zone diameter and 1.30 mm in its length), with a small asymmetry consisting of a slightly larger coagulation zone diameter in the white area. In all cases the maximum temperature reached 100 °C at a point in the tissue adjacent to the contacts, i.e. at the ends of the contacts closest to each other.
Figure 11. Temperature distributions at roll-off for different cases of neural tissue around the contacts (scale in °C) according to the model shown in (6 W applied power): white matter (a), gray matter (B), three different positions of the gray-white matter interface (indicated by a solid black line) (C − E). The coagulation boundary (white dashed line) is that of the 55 °C isotherm. The solid gray line indicates the electrode contour. The black arrows on panel B indicate the hot points at the ends of each contact when closest to each other.
3.3.2. Scenario with peri-electrode gap
We found that including the peri-electrode gap filled by CSF did have an important impact on the electrical and thermal behavior. Due to the higher value of the CSF electrical conductivity than that of neural tissues, the initial impedance values were considerably lower than in the case without a gap and that they gradually dropped as gap thickness increased, i.e. from 507 Ω with a 0.2 mm gap, to 300 Ω with a 0.5 mm gap. Unlike the case without a gap (section 3.3.1), no roll-off occurred with the power range used (5 − 7 W) and the programmed duration (30 s). The results showed a strong positive correlation between applied power and coagulation zone size, both in terms of maximum diameter (R2=0.55, p < 0.05) and length (R2=0.70, p < 0.05), as shown in . The maximum diameter of the coagulation zone when the peri-electrode gap was considered was 5.7 ± 0.3 mm (which is only 0.2 mm smaller than the case with no peri-electrode gap), with a moderately negative correlation with respect to gap thickness (R2 = 0.41, p < 0.05). This value was not in fact very different from that obtained in the case without a gap (5.9 ± 0.3 mm).
Figure 12. Relationship between applied power and coagulation zone size (maximum diameter and length).
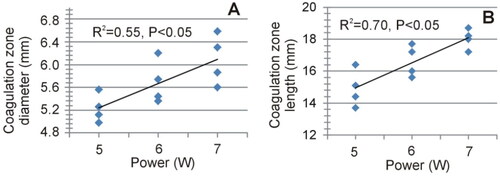
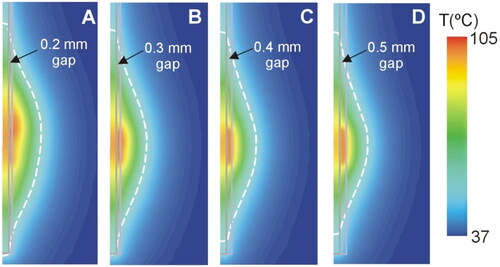
Figure 13 shows the temperature distributions at 30 s for different values of gap thickness in the case of gray matter around the contacts and 6 W power. While in the case without a gap, two hot spots were clearly seen at the proximal edges of the contacts (see ), as the gap increased in thickness from 0.2 to 0.5 mm, the hottest point was centered in the gap area between both contacts (see ). Note that the temperature was much lower in the presence of a gap, barely reaching 100 °C in the tissue.
Figure 13. Temperature distributions at 30 s for different values of gap thickness (scale in °C) according to the model shown in (6 W applied power). The coagulation boundary (white dashed line) is that of the 55 °C isotherm.
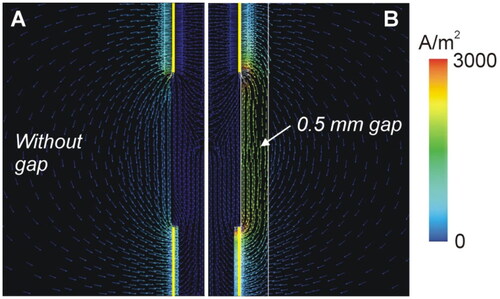
To determine the cause of this thermal behavior, we analyzed the electrical current density distribution in the cases with and without a gap (see ). While in the absence of a gap the RF current goes through the intervening tissue between both contacts, the presence of a gap filled with CSF creates a preferential path for RF current.
Figure 14. Electrical current density distributions in cases without (A) and with (B) a 0.5 mm peri-electrode gap filled by CSF (computed at the beginning of the RF coagulation, 0.1 s). Scale in a/m2.
4. Discussion
This computational study explored the electro-thermal behavior of SEEG electrodes with contacts energized by RF to create thermal lesions and destroy an epileptic focus. Our specific objective was to describe in mathematical terms the relationship between impedance evolution, the temperature distribution in the tissue and the geometry of the resulting coagulation zone. This is relevant because impedance roll-off in clinical practice is associated with a self-control mechanism that prevents the size of the coagulation zone from growing above a certain limit [Citation9], but at the same time it ignores the fact that the maximum temperature can exceed 100 °C. In the first part of this study, a computational model of radiofrequency thermocoagulation (RF-TC) was built using recording intracerebral stereoelectroencephalography (SEEG) electrodes and experimentally validated in an ex vivo bench model. The computer model was able to predict reasonably well both the impedance evolution and the short diameter of the coagulation zone (error < 0.01 mm) but overestimated the long diameter in 2 − 3 mm (see ), possibly because the computational measurement included the electrode, while the electrode was removed in the experiments prior to measuring the coagulation zone. The computer model also predicted impedance evolution well, with a mean difference of only 3.3 Ω. Also, the self-heating on the electrode surface was of the same order of magnitude in both the experiments and the computer simulations. These results suggest that the computational model and its mathematical framework can be used to study this ablative procedure. The findings of the computational model mimicking the in vivo conditions in clinical practice are discussed below.
4.1. Impedance roll-off limits coagulation size but implies overheating (100 °C)
Our computational results confirm that impedance roll-off acts as a self-control mechanism that prevents the size of the coagulation zone from growing above a certain limit [Citation9]. In fact, increasing the power from 5 to 7 W reduced the size of the coagulation zone due to anticipating roll-off (see ), which impedes the administration of RF power. However, our results also indicate that roll-off is always associated with a temperature close to 100 °C at some point in the tissue (see ), which could involve risks of the contacts sticking to the tissue, or steam pops. As previously found, roll-off occurs when a zone of tissue completely desiccated (associated with tissue temperatures close to 100 °C) surrounds one of the contacts, preventing the passage of RF current [Citation10]. Roll-off therefore seems to be a controversial mechanism for limiting the size of the coagulation zone and clinicians should keep this in mind when suggesting impedance-guided protocols.
4.2. Effects of tissue types around the contacts (gray vs. white matter)
Despite gray matter being 50% more electrically conductive than white matter (0.152 vs. 0.0947 S/m [Citation15]), so that a greater deposition of RF power and a larger coagulation zone could be expected in this tissue type, the truth is that blood perfusion is 3.5 times greater in gray than in white matter (764 vs. 212 ml/min·kg [Citation15]), so that the heat sink effect will also be greater. These two opposing factors could possibly compensate each other in some way since the computational results did not show a great degree of asymmetry of the coagulation zone around the contacts when each of them was surrounded by different matter (see ).
4.3. Peri-electrode gap filled with CSF significantly alters the temperature distributions
In the case of the peri-electrode gap, the current density distribution shows that the CSF acts as a preferential path for the RF current (see ), since its electrical conductivity is at least 10 times greater than that of neuronal tissue, which possibly minimizes Joule heating in the neuronal tissue itself. In fact, our results suggest that the coagulation zone created in the neuronal tissue is created mainly by thermal conduction from the heated CSF (see the ellipsoidal-like electric field intensity shape in ), unlike what happens in the absence of a gap, in which the temperature distribution includes hot spots at the edges of the contacts (by direct deposition of RF power) and the subsequent creation of the coagulation zone by thermal conduction (see the peanut-like electric field intensity shape in ).
Our results allow us to infer that it is necessary to create personalized computational head models to be representative of the actual thermal effect. We found that it was important to consider the heterogeneity of tissue conductivity, but it is also necessary to be able to model the peri-electrode gap. To achieve this, adding a post-implantation MR to clinical practice is essential, as modeling the gap is not possible with only a single CT scan due to the artifacts from the metal contacts having a larger volume than the contacts themselves. While there are various software tools for segmenting and 3D reconstruction of SEEG electrodes, such as iElectrodes [Citation24], IEEG-reconn [Citation25], or SimNimbs [Citation26], none of these include peri-electrode space modeling because it is not considered sufficiently important for solving electromagnetic forward problem only [Citation27]. It is important to note that it is necessary to add gap modeling to the modeling tools to solve at least the electromagnetic thermal problems. This could be achieved through post-implantation MR images and semi-automatic segmentation software such as Slicer 3D or Materialize.
4.4. Limitations
Firstly, the experimental validation was conducted using ex vivo liver tissue, which is quite different to the in vivo conditions during the clinical practice of RF-CT. In this regard, it is important to remember that one of the advantages of computational modeling is that it reduces experiments on animals. Our computational model was developed considering a type of electrode similar to those used in clinical practice. The validation results showed a good prediction capacity in terms of coagulation zone size and electrical impedance evolution. Any subsequent adaptations closer to the conditions in clinical practice should not invalidate the potential of the model to study factors such as the type of neuronal tissue around the contacts, and the existence of a peri-electrode gap filled by CSF. Secondly, although we included many technical electrode details, especially the electrical and thermal impact of the internal wires, little information is available on the specific properties of the plastic used in the coating. These other details, although minor, could have an impact if the model is used in the future as a patient-specific predictive clinical tool. Thirdly, our study considered a linear model for the heat sink effect due to blood perfusion, even though more advanced models have been proposed for RF heating [Citation28]. In spite of this limitation, as reported in [Citation29,Citation30] the clinical aim was to implant deep SEEG electrodes through minimally vascularized pathways and avoid the risk of cerebral bleeding. This is the reason why neuronavigation or even surgical robots and stereotaxic systems are used to maximize the safety and implant accuracy of the procedure [Citation31]. In short, SEEG contacts should be kept away from vascularized areas to minimize the blood perfusion effect.
5. Conclusions
This work describes an experimentally validated computational model on SEEG-guided RF-TC using two contiguous contacts, including the resistance of the internal wires. The results indicated a close relationship between impedance evolution, including an abrupt increase (roll-off) and the temperature distributions in the tissue, especially the appearance of overheating points (100 °C). When the model was adapted to clinical conditions, we found that: 1) Roll-off limits coagulation size but involves overheating (∼100 °C); 2) The tissue type around the contacts (gray vs. white matter) has a moderate impact on coagulation size; and 3) the peri-electrode gap filled by CSF significantly alters the temperature distributions, avoids overheating and reduces coagulation size to less than cases without a gap. This study shows that previous computer modeling should be used to estimate RF-TC electrical and thermal performance in brain tissue, while subject- and scenario-specific modeling is also recommended.
Supplemental Material
Download Zip (180.2 KB)Disclosure statement
No potential conflict of interest was reported by the author(s).
Data availability statement
The authors confirm that the data supporting the findings of this study are available within the article and its supplementary materials.
Additional information
Funding
References
- Engel J.Jr. Research on the human brain in an epilepsy surgery setting. Epilepsy Res. 1998;32(1-2):1–12. doi: 10.1016/s0920-1211(98)00034-5.
- Lüders HO, Najm I, Nair D, et al. The epileptogenic zone: general principles. Epileptic Disord. 2006;8(2):S1–S9.
- Bourdillon P, Devaux B, Job-Chapron AS, et al. SEEG-guided radiofrequency thermocoagulation. Neurophysiol Clin. 2018;48(1):59–64. doi: 10.1016/j.neucli.2017.11.011.
- Bourdillon P, Isnard J, Catenoix H, et al. Stereo electroencephalography-guided radiofrequency thermocoagulation (SEEG-guided RF-TC) in drug-resistant focal epilepsy: results from a 10-year experience. Epilepsia. 2017;58(1):85–93. doi: 10.1111/epi.13616.
- Cossu M, Fuschillo D, Casaceli G, et al. Stereoelectroencephalography-guided radiofrequency thermocoagulation in the epileptogenic zone: a retrospective study on 89 cases. J Neurosurg. 2015;123(6):1358–1367. doi: 10.3171/2014.12.JNS141968.
- Liu Q, Wang J, Wang C, et al. FreeSurfer and 3D Slicer-Assisted SEEG Implantation for Drug-Resistant Epilepsy. Front Neurorobot. 2022;16:848746. doi: 10.3389/fnbot.2022.848746.
- Guenot M, Isnard J. La thermocoagulation multiple de foyers épileptogènes guidée par la SEEG (thermo-SEEG) [Multiple SEEG-guided RF-thermolesions of epileptogenic foci]. Neurochirurgie. 2008;54(3):441–447. French. doi: 10.1016/j.neuchi.2008.02.012.
- Staudt MD, Maturu S, Miller JP. Radiofrequency Energy and Electrode Proximity Influences Stereoelectroencephalography-Guided Radiofrequency Thermocoagulation Lesion Size: an In Vitro Study with Clinical Correlation. Oper Neurosurg (Hagerstown). 2018;15(4):461–469. doi: 10.1093/ons/opx291.
- Bourdillon P, Isnard J, Catenoix H, et al. Stereo-electro-encephalography-Guided Radiofrequency Thermocoagulation: from In Vitro and In Vivo Data to Technical Guidelines. World Neurosurg. 2016;94:73–79. doi: 10.1016/j.wneu.2016.06.095.
- Trujillo M, Alba J, Berjano E. Relationship between roll-off occurrence and spatial distribution of dehydrated tissue during RF ablation with cooled electrodes. Int J Hyperthermia. 2012;28(1):62–68. doi: 10.3109/02656736.2011.631076.
- Cosman ER, Jr, Cosman ER.Sr. Electric and thermal field effects in tissue around radiofrequency electrodes. Pain Med. 2005;6(6):405–424. doi: 10.1111/j.1526-4637.2005.00076.x.
- Cosman ER, Jr, Gonzalez CD. Bipolar radiofrequency lesion geometry: implications for palisade treatment of sacroiliac joint pain. Pain Pract. 2011;11(1):3–22. doi: 10.1111/j.1533-2500.2010.00400.x.
- Berjano EJ. Theoretical modeling for radiofrequency ablation: state-of-the-art and challenges for the future. Biomed Eng Online. 2006;5(1):24. doi: 10.1186/1475-925X-5-24.
- Pérez JJ, Nadal E, Berjano E, et al. Computer modeling of radiofrequency cardiac ablation including heartbeat-induced electrode displacement. Comput Biol Med. 2022;144:105346. doi: 10.1016/j.compbiomed.2022.105346.
- Mitchell HH, Hamilton TS, Steggerda FR, et al. The chemical composition of the adult human body and its bearing on the biochemistry of growth. J Biol Chemistry. 1945;158(3):625–637. doi: 10.1016/S0021-9258(19)51339-4.
- Hasgall PA, Di Gennaro F, Baumgartner C, et al. IT’IS Database for thermal and electromagnetic parameters of biological tissues. Version. 2022;4(1). doi: 10.13099/VIP21000-04-1. Available online: https://itis.swiss/virtual-population/tissue-properties/database/dielectric-properties.
- Latikka J, Eskola H. The electrical conductivity of human cerebrospinal fluid in vivo. In: World Congress on Medical Physics and Biomedical Engineering 2018. Springer; 2019. p. 773–776. (IFMBE Proceedings; 1). doi: 10.1007/978-981-10-9035-6_142.
- Pérez JJ, Ewertowska E, Berjano E. Computer modeling for radiofrequency bipolar ablation inside ducts and vessels: relation between pullback speed and impedance progress. Lasers Surg Med. 2020;52(9):897–906. doi: 10.1002/lsm.23230.
- https://matmatch.com/. (accessed on Feb 1st 2024).
- Haines DE. Letter by Haines regarding article, "Direct measurement of the lethal isotherm for radiofrequency ablation of myocardial tissue. Circ Arrhythm Electrophysiol. 2011;4(5):e67; author reply e68. doi: 10.1161/CIRCEP.111.965459.
- Yousif N, Bayford R, Bain PG, et al. The peri-electrode space is a significant element of the electrode-brain interface in deep brain stimulation: a computational study. Brain Res Bull. 2007;74(5):361–368. doi: 10.1016/j.brainresbull.2007.07.007.
- von Ellenrieder N, Khoo HM, Dubeau F, et al. What do intracerebral electrodes measure? Clin Neurophysiol. 2021;132(5):1105–1115. doi: 10.1016/j.clinph.2021.02.012.
- Gabriel C, Peyman A, Grant EH. Electrical conductivity of tissue at frequencies below 1 MHz. Phys Med Biol. 2009;54(16):4863–4878. doi: 10.1088/0031-9155/54/16/002.
- Blenkmann AO, Leske SL, Llorens A, et al. Anatomical registration of intracranial electrodes. Robust model-based localization and deformable smooth brain-shift compensation methods. J Neurosci Methods. 2024;404:110056. doi: 10.1016/j.jneumeth.2024.110056.
- Lucas A, Scheid BH, Pattnaik AR, et al. iEEG-recon: a fast and scalable pipeline for accurate reconstruction of intracranial electrodes and implantable devices. Epilepsia. 2023;65(3):817–829. doi: 10.1111/epi.17863.
- Saturnino GB, Puonti O, Nielsen JD, et al. Chapter 1, SimNIBS 2.1: a comprehensive pipeline for individualized electric field modelling for transcranial brain stimulation. In: Makarov S, Horner M, Noetscher G, editors. Brain and human body modeling: computational human modeling at EMBC 2018 [Internet]. Cham (CH): Springer; 2019. doi: 10.1007/978-3-030-21293-3_1.
- Collavini S, Fernández-Corazza M, Oddo S, et al. Improvements on spatial coverage and focality of deep brain stimulation in pre-surgical epilepsy mapping. J Neural Eng. 2021;18(4):046004. doi: 10.1088/1741-2552/abe5b9.
- Schutt DJ, Haemmerich D. Effects of variation in perfusion rates and of perfusion models in computational models of radio frequency tumor ablation. Med Phys. 2008;35(8):3462–3470. doi: 10.1118/1.2948388.
- Cardinale F, Cossu M, Castana L, et al. Stereoelectroencephalography: surgical methodology, safety, and stereotactic application accuracy in 500 procedures. Neurosurgery. 2013;72(3):353–366; discussion 366. doi: 10.1227/NEU.0b013e31827d1161.
- Isnard J, Taussig D, Bartolomei F, et al. French guidelines on stereoelectroencephalography (SEEG). Neurophysiol Clin. 2018;48(1):5–13. doi: 10.1016/j.neucli.2017.11.005.
- Kaewborisutsakul A, Chernov M, Yokosako S, et al. Usefulness of Robotic Stereotactic Assistance (ROSA®) Device for Stereoelectroencephalography Electrode Implantation: A Systematic Review and Meta-analysis. Neurol Med Chir. 2024;64(2):71–86. doi: 10.2176/jns-nmc.2023-0119.